 News
News  Market Data
  Discover

Support: 888-992-3836
Copyright © 2023 InvestorsHub Inc.


Register for free to join our community of investors and share your ideas. You will also get access to streaming quotes, interactive charts, trades, portfolio, live options flow and more tools.
The StockCharts Technical Rank (SCTR) - often pronounced "Scooter" - is a numerical score that ranks a stock within a group of stocks. The methodology for these rankings comes from the wisdom of John Murphy, author of many books on technical analysis and contributor to the Market Message at StockCharts.com.
$DROP BarChart Technical Analysis
http://www.barchart.com/technicals/stocks/DROP
Issuers of ETFs
? AdvisorShares issues actively managed ETFs.
? Bips Investment Managers issues Bips (Beta Investment Performance Securities).
? BNP Paribas issues EasyETFs.
? BlackRock issues iShares.
? Charles Schwab offers several commission-free ETFs for its clients.
? Deutsche Bank issues db x-trackers ETFs, as well as managing PowerShares DB commodity- and currency-based ETFs.
? ETF Securities issues ETFs or specialised commodity ETCs.
? Global X Funds issues ETFs.
? Guggenheim Funds issues specialty Guggenheim Funds ETFs.
? Invesco issues PowerShares ETFs, as well as BLDRS based on American Depositary Receipts.
? Lyxor Asset Management issues Lyxor ETFs.
? Merrill Lynch issues HOLDRs.
? Source UK Services, a European joint-venture between Bank of America Merrill Lynch, Goldman Sachs, Morgan Stanley, Nomura and J. P. Morgan issues ETFs and ETCs
? State Street Global Advisors issues SPDRs.
? Van Eck Global issues Market Vectors ETFs.
? Vanguard Group issues Vanguard ETFs, formerly known as VIPERs.

In Keltner's description the centre line is a 10-day simple moving average of typical price, where typical price each day is the average of high, low and close.
$HUIY BarChart Technical Analysis
http://www.barchart.com/technicals/stocks/HUIY
The Coppock indicator was originally designed for use on a monthly time scale. It is effectively an oscillator calculated from the sum of a 14 month rate of change and 11-month rate of change, smoothed by a 10-period weighted moving average.
Form 10-12G, 10-12G/A ~ SEC Filings Explained
Initial general form for registration of a class of securities pursuant to section 12(g) (and amendment thereto)
$ONCS BarChart Technical Analysis
http://www.barchart.com/technicals/stocks/ONCS
MACD Bullish Signal Line Cross: This scan reveals stocks that are trading above their 200-day moving average and have a bullish signal line crossover in MACD. Also notice that MACD is required to be negative to insure this upturn occurs after a pullback. This scan is just meant as a starter for further refinement.
CONCEALING BABY SWALLOW
This Bullish pattern is highlighted by two consecutive Black Marubozu. They are characterized by the fact that a gapping black candlestick trades into the body of the previous day and it is seen during a downtrend. Then there is another Black Marubozu on the third day showing sale of positions since it closes at a new low. However this may give incentive to the shorts to cover their positions implying that a bullish reversal is now possible.

Recognition Criteria:
1. Market is characterized by downtrend.
2. We see two consecutive Black Marubozu in the first and second days.
3. Then we see a black candlestick on the third day opening with a downward gap but trading into the body of the second day and it is characterized by a long upper shadow.
4. Finally we see another Black Marubozu on the fourth day that completely engulfs the candlestick of the third day including the shadow.
Explanation:
Two black Marubozu show that downtrend is continuing to the satisfaction of the bears. On the third day, we see a downward gap further confirming the downtrend. However, prices on the third day start going above the close of the previous day causing some doubts about the bearish direction even though the day closes at or near its low. The next day shows us a significantly higher gap in the opening. After the opening, however, prices again go down closing at a new low. This last day may be interpreted as a good chance for the short-sellers to cover their short positions.
$GWIV BarChart Technical Analysis
http://www.barchart.com/technicals/stocks/GWIV
The Force Index can be used to reinforce or determine the trend. The trend in question, short-term, medium-term or long-term, depends on the Force Index parameters. While the default Force Index parameter is 13, chartists can use a higher number for more smoothing or a lower number for less smoothing. The chart below shows Home Depot with a 100-day Force Index and a 13-day Force Index. Notice how the 13-day Force Index is more volatile and jagged. The 100-day Force Index is smoother and crosses the zero line fewer times.
BULLISH LADDER BOTTOM
The shorts may have a chance to close their positions and realize their profits by the fourth day of a considerable downtrend. Then we see an upward gap on the fifth day as a result of this. If the body of the fifth day is long, or the volume of trading is high, this may also imply a bullish reversal.

Recognition Criteria:
1. Market is characterized by downtrend.
2. We see three long black candlesticks characterized by consecutively lower opens and a closing sequence just like the Bearish Three Black Crows Pattern.
3. Then we see a black candlestick on the fourth day with an upper shadow.
4. Finally we see a white candlestick opening above the body of the fourth day on the fifth day.
Explanation:
There is a considerable downtrend for some time and the bears are happy. Then we see a good move downward. Prices start trading above the opening price and almost reaching to the new high of the previous day, but then they close at another new low. This action is a warning for shorts telling them that the market will not go down forever. The shorts may then be forced to reevaluate their positions and they may start closing their positions on the next day if profits are good. This act is the reason behind the upward gap we see on the last day of the pattern and also the close is considerably higher. If volume is high on the last day, a trend reversal has probably occurred.
Important Factors:
A confirmation on the sixth day is suggested in the form a white candlestick, a large gap up or a higher close, to be sure that the market has reversed.
$GRBG BarChart Technical Analysis
http://www.barchart.com/technicals/stocks/GRBG
Like any stock market forecast, the MACD can generate false signals. A false positive, for example, would be a bullish crossover followed by a sudden decline in a stock. A false negative would be a situation where there was no bullish crossover, yet the stock accelerated suddenly upwards.
$GNCP BarChart Technical Analysis
http://www.barchart.com/technicals/stocks/GNCP
RSI = 100 - 100/(1 RS*) Where RS = Average of x days' up closes / Average of x days' down closes.
Hammer and Gravestone
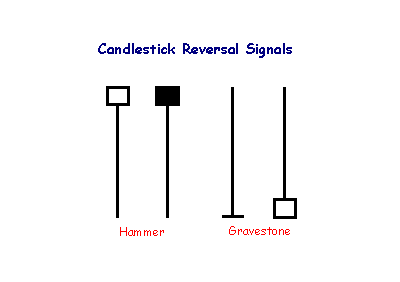
The hammer is not as strong as the dragonfly candlestick, but also signals reversal after a down-trend: control has shifted from sellers to buyers. The shadow of the candlestick should be at least twice the height of the body.
A gravestone is identified by open and close near the bottom of the trading range. The candlestick is the converse of a hammer and signals reversal when it occurs after an up-trend.
$IXEH BarChart Technical Analysis
http://www.barchart.com/technicals/stocks/IXEH
Standard Pivot Points
Standard Pivot Points begin with a base Pivot Point. This is a simple average of the high, low and close. The middle Pivot Point is shown as a solid line between the support and resistance pivots. Keep in mind that the high, low and close are all from the prior period.
Pivot Point (P) = (High Low Close)/3
Support 1 (S1) = (P x 2) - High
Support 2 (S2) = P - (High - Low)
Resistance 1 (R1) = (P x 2) - Low
Resistance 2 (R2) = P (High - Low)
The chart below shows the Nasdaq 100 ETF (QQQ) with Standard Pivot points on a 15 minute chart. At the start of trading on June 9th, the Pivot Point is in the middle, the resistance levels are above and the support levels are below. These levels remain constant throughout the day.

The purpose of Bollinger Bands is to provide a relative definition of high and low. By definition, prices are high at the upper band and low at the lower band. This definition can aid in rigorous pattern recognition and is useful in comparing price action to the action of indicators to arrive at systematic trading decisions.
$CWBS BarChart Technical Analysis
http://www.barchart.com/technicals/stocks/CWBS
Keltner Channels also use an exponential moving average, which is more sensitive than the simple moving average used in Bollinger Bands. The chart below shows Keltner Channels (blue), Bollinger Bands (pink), Average True Range (10), Standard Deviation (10) and Standard Deviation (20) for comparison. Notice how the Keltner Channels are smoother than the Bollinger Bands. Also notice how the Standard Deviation covers a larger range than the Average True Range (ATR).
Taxation on ETF’s
ETFs are structured for tax efficiency and can be more attractive than mutual funds. In the U.S., whenever a mutual fund realizes a capital gain that is not balanced by a realized loss, the mutual fund must distribute the capital gains to its shareholders. This can happen whenever the mutual fund sells portfolio securities, whether to reallocate its investments or to fund shareholder redemptions. These gains are taxable to all shareholders, even those who reinvest the gains distributions in more shares of the fund. In contrast, ETFs are not redeemed by holders (instead, holders simply sell their ETF shares on the stock market, as they would a stock, or effect a non-taxable redemption of a creation unit for portfolio securities), so that investors generally only realize capital gains when they sell their own shares or when the ETF trades to reflect changes in the underlying index.[5]
In most cases, ETFs are more tax-efficient than conventional mutual funds in the same asset classes or categories.[42] Because Vanguard's ETFs are a share-class of their mutual funds, they don't get all the tax advantages if there are net redemptions on the mutual fund shares.[43] Although they do not get all the tax advantages, they get an additional advantage from tax loss harvesting any capital losses from net redemptions.[44][45]
In the U.K., ETFs can be shielded from capital gains tax by placing them in an Individual Savings Account or self-invested personal pension, in the same manner as many other shares. Because UK-resident ETFs would be liable for UK corporation tax on non-UK dividends, most ETFs which hold non-UK companies sold to UK investors are issued in Ireland or Luxembourg
$AMBEQ BarChart Technical Analysis
http://www.barchart.com/technicals/stocks/AMBEQ
The Coppock/Trendex Indicator was first developed in 1945 when the Episcopal Church authorities asked Edwin Sedgewick Coppock, the founder of Trendex Research in San Antonio, for a low-risk, long-term signal for use on the Dow.
BEARISH DELIBERATION
The Bearish Deliberation Pattern is a derivative of the Bearish Three White Soldiers Pattern. This pattern also shows a weakness similar to the Bearish Advance Block Pattern since it becomes weaker in a short period of time. However here the weakness occurs all at once on the third day. The small third body of the pattern shows that the rally is losing strength and a reversal is possible.
Recognition Criteria:
1. Market is characterized by uptrend.
2. We see long white bodies in the first and second days.
3. The second day has a higher close than the first day.
4. Then the third day opens near the second day's close.
5. The third day is typically a short white candlestick, a spinning top or a star that gaps above the second day.
Explanation:
The Bearish Deliberation Pattern appears after a sustained upward move and is suggestive of the fact that the rally is losing strength and a reversal is possible. The formation is a proof that the bulls’ strength is at least temporarily exhausted.
Important Factors:
The last small white candlestick may show a gap away from the long white body, thus becoming a star, or it can be riding on the shoulder of the long white real body.
The Bearish Deliberation Pattern is not normally a top reversal pattern but it has potential to precede a meaningful price decline. This pattern is more important at higher price levels. It must be used to liquidate long positions but it is yet too early for short positions.
A confirmation on fourth day is required to confirm that the uptrend has reversed. This may be in the form of a black candlestick, a large gap down or a lower close on the fourth day.
$OPEI BarChart Technical Analysis
http://www.barchart.com/technicals/stocks/OPEI
The Chaikin Money Flow measures buying and selling pressure for a given period of time. A move into positive readings indicates buying pressure, while a move into negative readings indicates selling pressure. Traders and analysts can use the Chaikin Money Flow to confirm price action of the stock. Positive CMF would confirm an uptrend and a negative CMF the opposite.
Form N-Q ~ SEC Filings Explained
Quarterly Schedule of Portfolio Holdings of Registered Management Investment Company
$HALB BarChart Technical Analysis
http://www.barchart.com/technicals/stocks/HALB
Bollinger Bands is a technical analysis tool invented by John Bollinger in the 1980s, and a term trademarked by him in 2011.
Form NT 10-K ~ SEC Filings Explained
Notice under Rule 12b25 of inability to timely file all or part of a Form 10-K, 10-KSB, or 10KT
$PLSB BarChart Technical Analysis
http://www.barchart.com/technicals/stocks/PLSB
The FI is calculated by multiplying the difference between the last and previous closing prices by the volume of the commodity, yielding a momentum scaled by the volume. The strength of the force is determined by a larger price change or by a larger volume.
SEC Filings Explained ~ Form 4
Form 4 is a United States SEC filing that relates to insider trading. Every director, officer or owner of more than ten percent of a class of equity securities registered under Section 12 of the Securities Exchange Act of 1934 must file with the United States Securities and Exchange Commission a statement of ownership regarding such security. The initial filing is on Form 3 and changes are reported on Form 4. The Annual Statement of beneficial ownership of securities is on Form 5. The forms contain information on the reporting person's relationship to the company and on purchases and sales of such equity securities.
Form 4 is stored in SEC's EDGAR database. EDGAR is Electronic Data Gathering, Analysis and Retrieval System. It is a registered trademark of the SEC.
A Form 4 must be filed before the end of the second business day following a change in ownership of securities or derivative securities (including the exercise or grant of stock options) for individuals subject to Section 16 of the Securities Exchange Act of 1934.
$GDNEF BarChart Technical Analysis
http://www.barchart.com/technicals/stocks/GDNEF
A buy signal is generated when the indicator is below zero and turns upwards from a trough. No sell signals are generated (that not being its design), but turns at the top have their uses in signalling danger. The indicator is trend-following, and based on averages, so by its nature it doesn't pick a absolute market bottom like our TroughFinder product, but rather shows when a rally has become established.
Vipers
Just like iShares are Barclay's brand of ETFs, VIPERs are Vanguard's brand of the financial instrument. Vipers, or Vanguard Index Participation Receipts, are structured as share classes of open-end funds. Vanguard also offers dozens upon dozens of ETFs for many different areas of the market including the financial, healthcare and utilities sectors.
$DTVI BarChart Technical Analysis
http://www.barchart.com/technicals/stocks/DTVI
The Money Flow Index is a rather unique indicator that combines momentum and volume with an RSI formula. RSI momentum generally favors the bulls when the indicator is above 50 and the bears when below 50. Even though MFI is considered a volume-weighted RSI, using the centerline to determine a bullish or bearish bias does not work as well. Instead, MFI is better suited to identify potential reversals with overbought/oversold levels, bullish/bearish divergences and bullish/bearish failure swings. As with all indicators, MFI should not be used by itself. A pure momentum oscillator, such as RSI, or pattern analysis can be combined with MFI to increase signal robustness.
Form N-30D ~ SEC Filings Explained
Initial annual and semi-annual reports mailed to investment company shareholders
$FHAI BarChart Technical Analysis
http://www.barchart.com/technicals/stocks/FHAI
The drawdown of measuring the ulcer index indicator is the Intel stock that had sustained and strong higher movement. These are simple ulcer index indicator that might be able to help you understand more of the standard business procedure.
1. Effects on stability (Risks Associated with ETF’s)
ETFs that buy and hold commodities or futures of commodities have become popular. For example, SPDR Gold Shares ETF (GLD) has 41 million ounces in trust. [49] The silver ETF, SLV, is also very large. The commodity ETFs are in effect consumers of their target commodities, thereby affecting the price in a spurious fashion. [50] In the words of the IMF, “Some market participants believe the growing popularity of exchange-traded funds (ETFs) may have contributed to equity price appreciation in some emerging economies, and warn that leverage embedded in ETFs could pose financial stability risks if equity prices were to decline for a protracted period.”
$YLLC BarChart Technical Analysis
http://www.barchart.com/technicals/stocks/YLLC
Negative Divergence: The trick with MACD is to look at the trend it is a powerful indicator when you compare the direction of the MACD Mountains with the Price Movement.
Point 2 illustrates, that although the price doubled in 2008 we saw the MACD make lower lows “negative divergence”. We see here a change in the MACD from positive to negative and the large mountain (below the Zero Line) forms. MACD is an oscillating indicator and as such is always tied to the Zero line in the middle.
MORNING STAR
This is a three-candlestick formation that signals a major bottom. It is composed of a first long black body, a second small real body, white or black, gapping lower to form a star. These two candlesticks define a basic star pattern. The third is a white candlestick that closes well into the first session’s black real body. Third candlestick shows that the market turned bullish now.

Recognition Criteria:
1. Market is characterized by downtrend.
2. We see a long black candlestick in the first day.
3. Then we see a small body on the second day gapping in the direction of the previous downtrend.
4. Finally we see a white candlestick on the third day.
Explanation:
We see the black body in a falling market suggesting that the bears are in command. Then a small real body appears implying the incapacity of sellers to drive the market lower. The strong white body of third day proves that bulls have taken over. An ideal Bullish Morning Star Pattern preferably has a gap before and after the middle candlestick. The second gap is rare, but lack of it does not take away from the power of this formation.
Important Factors:
The stars may be more than one, two or even three.
The color of the star and its gaps are not important.
$SAPX BarChart Technical Analysis
http://www.barchart.com/technicals/stocks/SAPX
|
Followers
|
3287
|
Posters
|
|
|
Posts (Today)
|
0
|
Posts (Total)
|
2804248
|
|
Created
|
08/22/10
|
Type
|
Free
|
| Moderator Nilbud | |||
| Assistants mick ManicTrader PhotoChick Kirimi $Pistol Pete$ | |||
   Investor Hub Alerts: Sign up for 'STOCKGOODIES PLAYS OF THE WEEK ' E-Mail List Investor Hub Alerts: Sign up for 'STOCKGOODIES PLAYS OF THE WEEK ' E-Mail ListUPDATE; 5-1-22 courtesy of charting /\ wit tweezer top calls /\ Tony @Montana_Trades Really good study sheet on Candlestick Patterns [-chart]pbs.twimg.com/media/FRn8188XMAAdZvk?format=jpg&name=small[/chart] 

02-07-2021
|
|
Posts Today
|
0
|
|
Posts (Total)
|
2804248
|
|
Posters
|
|
|
Moderator
|
|
|
Assistants
|
| Volume | |
| Day Range: | |
| Bid Price | |
| Ask Price | |
| Last Trade Time: |


