 News
News  Market Data
  Discover
Support: 888-992-3836
Copyright © 2023 InvestorsHub Inc.


Register for free to join our community of investors and share your ideas. You will also get access to streaming quotes, interactive charts, trades, portfolio, live options flow and more tools.
$PSID BarChart Technical Analysis
http://www.barchart.com/technicals/stocks/PSID
A channel upturn and break above the upper trendline can signal the start of an uptrend. A channel downturn and break below the lower trendline can signal the start a downtrend. Sometimes a strong trend does not take hold after a channel breakout and prices oscillate between the channel lines. Such trading ranges are marked by a relatively flat moving average. The channel boundaries can then be used to identify overbought and oversold levels for trading purposes.
$ZMRK BarChart Technical Analysis
http://www.barchart.com/technicals/stocks/ZMRK
Form 10-Q~ SEC Filings Explained
Form 10-Q, (also known as a 10-Q or 10Q) is a quarterly report mandated by the United States federalSecurities and Exchange Commission, to be filed by publicly traded corporations.
Pursuant to Section 13 or 15(d) of the Securities Exchange Act of 1934, it's an SEC filing that must be filed quarterly with the US Securities and Exchange Commission. It contains similar information to the annual form 10-K, however the information is generally less detailed, and the financial statements are generally unaudited. Information for the final quarter of a firm's fiscal year is included in the 10-K, so only three 10-Q filings are made each year.
These reports generally compare last quarter to the current quarter and last years quarter to this years quarter. The SEC put this form in place to facilitate better informed investors. The form 10-Q must be filed within 40 days for large accelerated filers and accelerated filers or 45 days after the end of the fiscal quarter for all other registrants (formerly 45 days)

Signal line crossovers are the most common MACD signals. The signal line is a 9-day EMA of the MACD Line. As a moving average of the indicator, it trails the MACD and makes it easier to spot MACD turns. A bullish crossover occurs when the MACD turns up and crosses above the signal line. A bearish crossover occurs when the MACD turns down and crosses below the signal line. Crossovers can last a few days or a few weeks, it all depends on the strength of the move.
$BION BarChart Technical Analysis
http://www.barchart.com/technicals/stocks/BION
Form N-2 ~ SEC Filings Explained
Initial filing of a registration statement on Form N-2 for closed-end investment companies
The MACD is an absolute price oscillator (APO), because it deals with the actual prices of moving averages rather than percentage changes. A percentage price oscillator (PPO), on the other hand, computes the difference between two moving averages of price divided by the longer moving average value.
$MRFD BarChart Technical Analysis
http://www.barchart.com/technicals/stocks/MRFD
TRIX (15,9) is quite similar to MACD (12,26,9). Both are momentum oscillators that fluctuate above and below the zero line. Both have signal lines based on a 9-day EMA. Most notably, both lines have similar shapes, signal line crossovers and centerline crosses. The biggest difference between TRIX and MACD is that TRIX is smoother than MACD. The TRIX lines are less jagged and tend to turn a bit later.
Form 13F-NT, 13F-NT/A ~ SEC Filings Explained
Initial Quarterly Form 13F Notice Report filed by institutional managers (and amendment thereto)
$MDGEF BarChart Technical Analysis
http://www.barchart.com/technicals/stocks/MDGEF
Engulfing Candlesticks
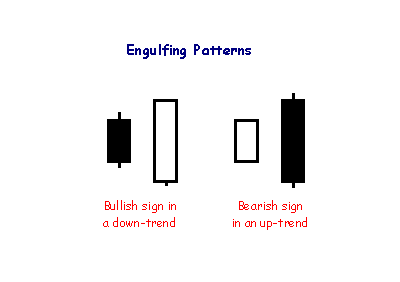
Engulfing patterns are where the body of the second candlestick 'engulfs' the first. They often follow or complete doji, hammer or gravestone patterns and signal reversal in the short-term trend.
The sharper the movement up or down of the MACD, the stronger the sign is to buy or sell, taking the above recommendations into consideration.
$CASG BarChart Technical Analysis
http://www.barchart.com/technicals/stocks/CASG
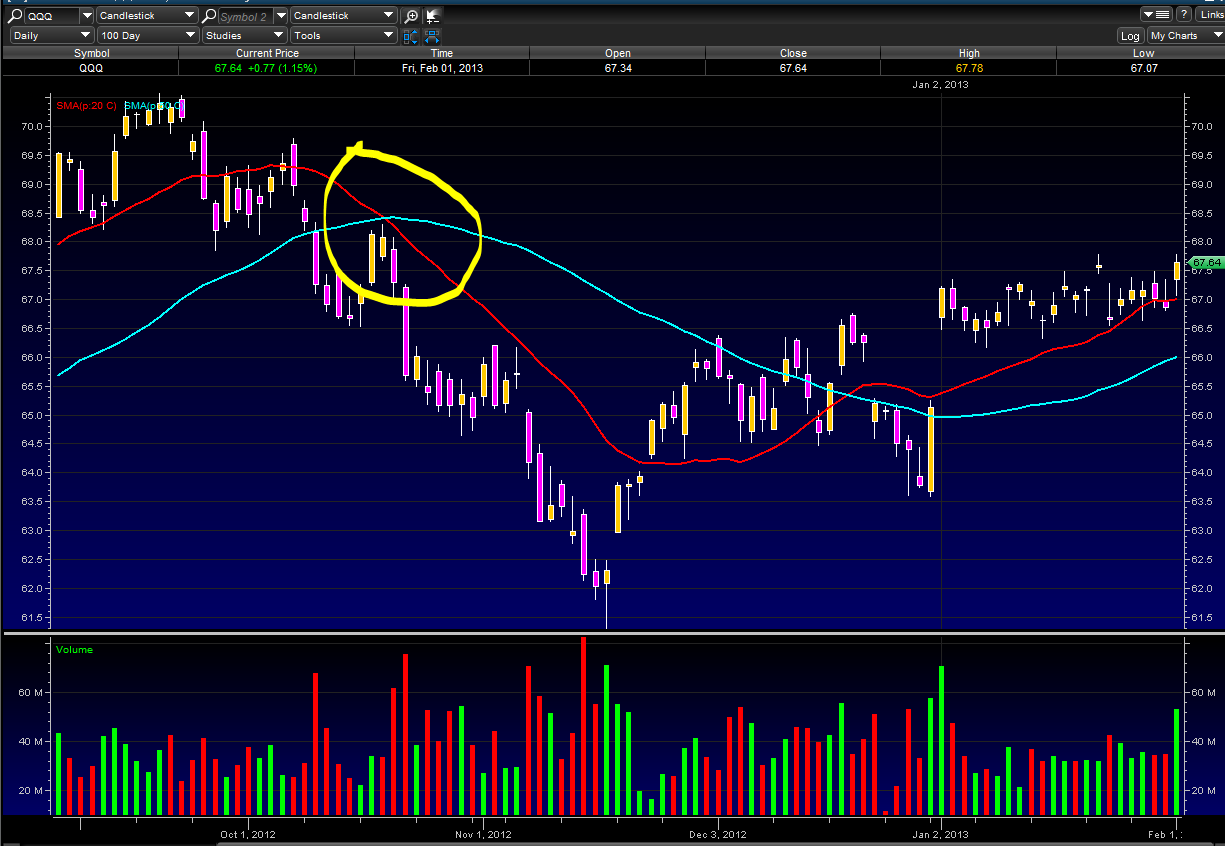
Death Cross
A Death Cross is when a shorter term moving average crosses below a longer term moving average, for example a 20 day SMA crossing under a 50 day SMA. A death cross indicates a bearish trend, especially when it is coupled with higher trading volume. As well as being a trend indicator, the longer term moving average becomes a resistance line as the price rises.
The chart below shows a 20/50 SMA Death cross:
20 SMA is in Red
50 SMA is in Blue
Chaikin Money Flow is not suited for all securities. The chart above shows P.F. Chang (PFCB) with some 18 crosses above .50 or below -.50. Basing CMF signals on these crosses resulted in one whipsaw after another. It is important to analyze the basic price trend and the characteristics of an indicator with a particular security. PFCB exhibits some trend, but price action within this trend is choppy and money flow cannot maintain a positive or negative bias. It would be better to find a different indicator for this stocks.
$HLOSF BarChart Technical Analysis
http://www.barchart.com/technicals/stocks/HLOSF
Simple Moving Average or (SMA)
The SMA does not predict the price direction but it smooths out the price action to give a trend indication.
Moving averages are lagging indicators because they are based on past prices. Despite this lag, moving averages help smooth price action and filter out the noise. They are also used to form the building blocks for many other technical indicators and overlays, such as Bollinger Bands, MACD and the McClellan Oscillator. Moving averages can be used to identify the direction of the trend or define potential support and resistance levels.
Here's a chart with a 5 day SMA on it:
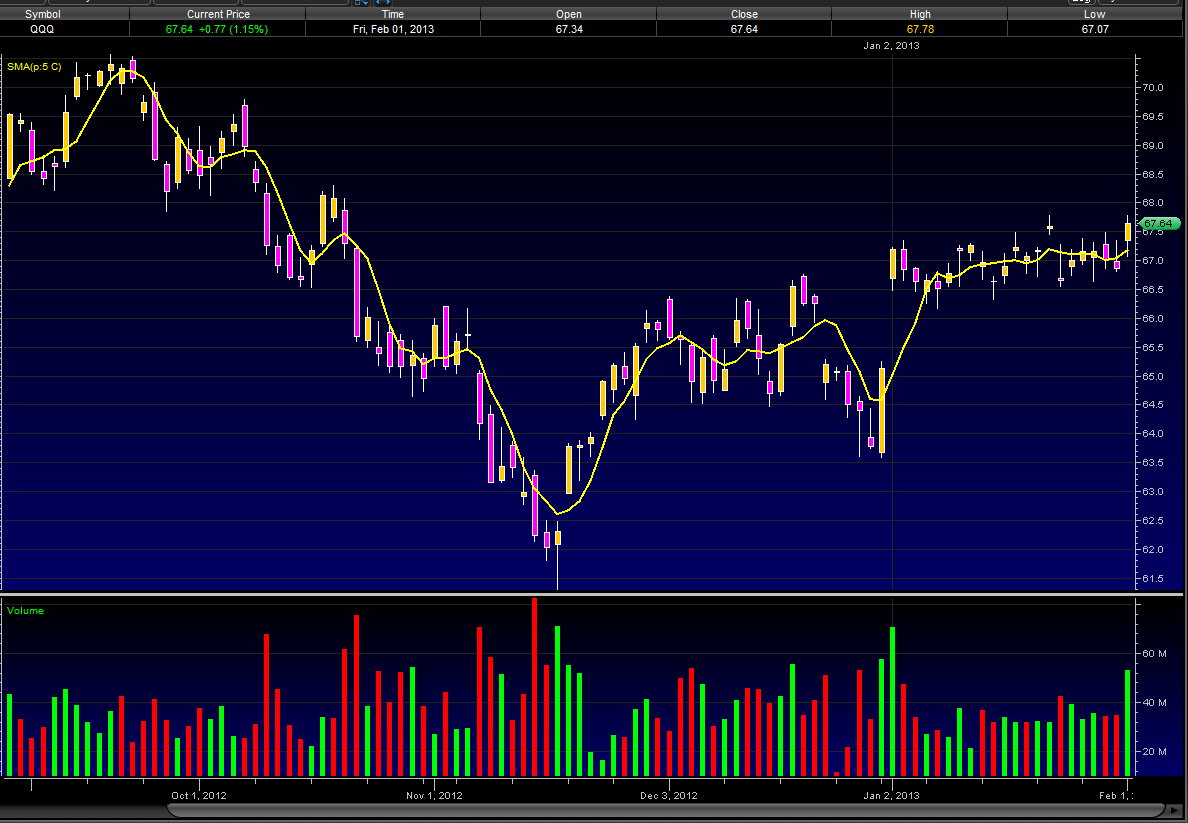
A simple moving average is made by calculating the average price of a security over a specific number of closing costs. The SMA will reflect the average closing cost, based on the time line of the chart you are looking at. i.e.: A 5 SMA on a daily chart will plot a line showing the average closing daily price, on a 60 minute chart that 5 SMA will plot a line showing the average hourly closing price. If the closing price changes so too does the SMA, hence the Moving part of Simple Moving Average. Old data is dropped and new data is added as it comes and goes, making the average move along the timeline. For those who need a visual take a look at how a SMA is plotted.
We will start our SMA on day 5
Daily Closing Prices:
Day 1 ------ 10
Day 2 ------ 12
Day 3 ------ 11
Day 4 ------ 14
Day 5 ------ 13
Day 6 ------ 15
Day 7 ------ 18
Day 8 ------ 19
SMA Plot points:
Day 5 ---- 10 12 11 14 13(closing price each day, 1 through 5) = 60 /5(# of days) = SMA of 12
Day 6 ---- Drop the 10 from day 1 and add the 15 from day 6 = 65 /5 = 13
Day 7 ---- Drop the 12 from day 2 and add 18 from day 7 = 71 /5 = 14.2
Day 8 ---- Drop the 11 from day 3 and add 19 from day 8 = 79 /5 = 15.8
The RSI formula normalizes RS and turns it into an oscillator that fluctuates between zero and 100. In fact, a plot of RS looks exactly the same as a plot of RSI. The normalization step makes it easier to identify extremes because RSI is range bound. RSI is 0 when the Average Gain equals zero. Assuming a 14-period RSI, a zero RSI value means prices moved lower all 14 periods. There were no gains to measure. RSI is 100 when the Average Loss equals zero. This means prices moved higher all 14 periods. There were no losses to measure.
$SELR BarChart Technical Analysis
http://www.barchart.com/technicals/stocks/SELR
Marubozu Candlesticks
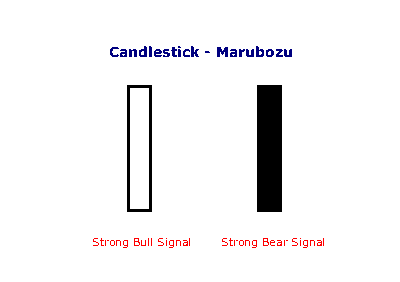
Marubozu are even stronger bull or bear signals than long lines as they show that buyers/sellers have remained in control from the open to the close -- there are no intra-day retracements.
MACD Bullish Signal Line Cross: This scan reveals stocks that are trading above their 200-day moving average and have a bullish signal line crossover in MACD. Also notice that MACD is required to be negative to insure this upturn occurs after a pullback. This scan is just meant as a starter for further refinement.
$VKMD BarChart Technical Analysis
http://www.barchart.com/technicals/stocks/VKMD
Parabolic SAR
Introduction
Developed by Welles Wilder, the Parabolic SAR refers to a price and time based trading system. Wilder called this the "Parabolic Time/Price System". SAR stands for "stop and reverse", which is the actual indicator used in the system. SAR trails price as the trend extends over time. The indicator is below prices when prices are rising and above prices when prices are falling. In this regard, the indicator stops and reverses when the price trend reverses and breaks above or below the indicator.
Wilder introduced the Parabolic Time/Price System in his 1978 book, New Concepts in Technical Trading Systems. This book also includes RSI, Average True Range and the Directional Movement Concept (ADX). Despite being developed before the computer age, Wilder's indicators have stood the test of time and remain extremely popular.

Calculation
Calculation of SAR is complex with if/then variables that make it difficult to put in a spreadsheet. These examples will provide a general idea of how SAR is calculated. Because the formulas for rising and falling SAR are different, it is easier to divide the calculation into two parts. The first calculation covers rising SAR and the second covers falling SAR.
Rising SAR
Prior SAR: The SAR value for the previous period.
Extreme Point (EP): The highest high of the current uptrend.
Acceleration Factor (AF): Starting at .02, AF increases by .02 each
time the extreme point makes a new high. AF can reach a maximum
of .20, no matter how long the uptrend extends.
Current SAR = Prior SAR Prior AF(Prior EP - Prior SAR)
13-Apr-10 SAR = 48.28 = 48.13 .14(49.20 - 48.13)
The Acceleration Factor is multiplied by the difference between the
Extreme Point and the prior period's SAR. This is then added to the
prior period's SAR. Note however that SAR can never be above the
prior two periods' lows. Should SAR be above one of those lows, use
the lowest of the two for SAR.


Falling SAR
Prior SAR: The SAR value for the previous period.
Extreme Point (EP): The lowest low of the current downtrend.
Acceleration Factor (AF): Starting at .02, AF increases by .02 each
time the extreme point makes a new low. AF can reach a maximum
of .20, no matter how long the downtrend extends.
Current SAR = Prior SAR - Prior AF(Prior SAR - Prior EP)
9-Feb-10 SAR = 43.56 = 43.84 - .16(43.84 - 42.07)
The Acceleration Factor is multiplied by the difference between the
Prior period's SAR and the Extreme Point. This is then subtracted
from the prior period's SAR. Note however that SAR can never be
below the prior two periods' highs. Should SAR be below one of
those highs, use the highest of the two for SAR.


Interpretation
SAR follows price and can be considered a trend following indicator. Once a downtrend reverses and starts up, SAR follows prices like a trailing stop. The stop continuously rises as long as the uptrend remains in place. In other words, SAR never decreases in an uptrend and continuously protects profits as prices advance. The indicator acts as a guard against the propensity to lower a stop-loss. Once price stops rising and reverses below SAR, a downtrend starts and SAR is above the price. SAR follows prices lower like a trailing stop. The stop continuously falls as long as the downtrend extends. Because SAR never rises in a downtrend, it continuously protects profits on short positions.
Step Increments
The Acceleration Factor (AF), which is also referred to as the Step, dictates SAR sensitivity. SharpCharts users can set the Step and the Maximum Step. As shown in the spreadsheet example, the Step is a multiplier that influences the rate-of-change in SAR. That is why it is referred to as the Acceleration Factor. Step gradually increases as the trend extends until it hits a maximum. SAR sensitivity can be decreased by decreasing the Step. A lower step moves SAR further from price, which makes a reversal less likely.
SAR sensitivity can be increased by increasing the step. A higher step moves SAR closer to the price action, which makes a reversal more likely. The indicator will reverse too often if the step is set too high. This will produce whipsaws and fail to capture the trend. Chart 6 shows IBM with SAR (.01, .20). The step is .01 and the Maximum Step is .20. Chart 7 shows IBM with a higher Step (.03). SAR is more sensitive in chart 7 because there are more reversals. This is because the Step is higher in chart 7 (.03) than chart 6 (.01).


Maximum Step
The sensitivity of the indicator can also be adjusted using the Maximum Step. While the Maximum Step can influence sensitivity, the Step carries more weight because it sets the incremental rate-of-increase as the trend develops. Also note that increasing the Step insures that the Maximum Step will be hit quicker when a trend develops. Chart 8 shows Best Buy (BBY) with a Maximum Step (.10), which is lower than the default setting (.20). This lower Maximum Step decreases the sensitivity of the indicator and produces fewer reversals. Notice how this setting caught a two month downtrend and a subsequent two month uptrend. Chart 9 shows BBY with a higher Maximum Step (.20). This higher reading produced extra reversals in early February and early April.


Conclusions
The Parabolic SAR works best with trending securities, which occur roughly 30% of the time according to Wilder's estimates. This means the indicator will be prone to whipsaws over 50% of the time or when a security is not trending. After all, SAR is designed to catch the trend and follow it like a trailing stop. As with most indicators, the signal quality depends on the settings and the characteristics of the underlying security. The right settings combined with decent trends can produce a great trading system. The wrong settings will result in whipsaws, losses and frustration. There is no golden rule or one-size-fits-all setting. Each security should be evaluated based on its own characteristics. Parabolic SAR should also be used in conjunction with other indicators and technical analysis techniques. For example, Wilder's Average Directional Index can be used to estimate the strength of the trend before considering signals.
Scans
Break above falling SAR: This scan starts with stocks that have an average price of $10 or greater over the last three months and average volume greater than 40,000. The scan then filters for stocks that have a bullish SAR reversal (Parabolic SAR (.01,.20)). This scan is just meant as a starter for further refinement.
Break below rising SAR: This scans starts with stocks that have an average price of $10 or greater over the last three months and average volume greater than 40,000. The scan then filters for stocks that have a bearish SAR reversal (Parabolic SAR (.01,.20)). This scan is just meant as a starter for further refinement.
The triple-smoothed EMA is very different from a plain EMA. In a plain EMA the latest few days dominate and the EMA follows recent prices quite closely; however, applying it three times results in weightings spread much more broadly, and the weights for the latest few days are in fact smaller than those of days further past. The following graph shows the weightings for an N=10 triple EMA (most recent days at the left).
$CLKTF BarChart Technical Analysis
http://www.barchart.com/technicals/stocks/CLKTF
ETF’s Explained
An exchange-traded fund (ETF) is an investment fund traded on stock exchanges, much like stocks.[1] An ETF holds assets such as stocks, commodities, or bonds, and trades close to its net asset value over the course of the trading day. Most ETFs track an index, such as a stock index or bond index. ETFs may be attractive as investments because of their low costs, tax efficiency, and stock-like features.[2][3] ETFs are the most popular type of exchange-traded product.[citation needed]
Only so-called authorized participants (typically, large institutional investors) actually buy or sell shares of an ETF directly from or to the fund manager, and then only in creation units, which are large blocks of tens of thousands of ETF shares, usually exchanged in-kind with baskets of the underlying securities. Authorized participants may wish to invest in the ETF shares for the long-term, but they usually act as market makers on the open market, using their ability to exchange creation units with their underlying securities to provide liquidity of the ETF shares and help ensure that their intraday market price approximates to the net asset value of the underlying assets.[4] Other investors, such as individuals using a retail broker, trade ETF shares on this secondary market.
An ETF combines the valuation feature of a mutual fund or unit investment trust, which can be bought or sold at the end of each trading day for its net asset value, with the tradability feature of a closed-end fund, which trades throughout the trading day at prices that may be more or less than its net asset value. Closed-end funds are not considered to be "ETFs", even though they are funds and are traded on an exchange. ETFs have been available in the US since 1993 and in Europe since 1999. ETFs traditionally have been index funds, but in 2008 the U.S. Securities and Exchange Commission began to authorize the creation of actively managed ETFs.
The Force Index is uses both price and volume to measure buying and selling pressure. The price portion covers the trend, while the volume portion determines the intensity. At its most basic, chartists can use a long-term Force Index to confirm the underlying trend.
$DNAG BarChart Technical Analysis
http://www.barchart.com/technicals/stocks/DNAG
Direxion Daily Financial Bear 3X Shares (NYSE:FAZ)
Not all ETFs are designed to move in the same direction or even in the same amount as the index they are tracking. For example, this triple bear fund attempts to perform 300% in the opposite direction of the Russell 1000 Financial Services Index. This fund became popular in 2008 and 2009 when the financial crisis placed downward pressure on financial stocks.
TRIX oscillates around a zero line so like most oscillating indicators a positive value indicates an overbought market and a negative value indicates an oversold market. Thus when the TRIX crosses above the zero line it gives a buy signal, and when it closes below the zero line, it gives a sell signal.
$NMPNF BarChart Technical Analysis
http://www.barchart.com/technicals/stocks/NMPNF
Form 15F-12G, 15F-12G/A ~ SEC Filings Explained
Notice of termination of a foreign private issuer's registration of a class of securities under Section 12(g) (and amendment thereto)
SCTRs take a predefined universe of stocks (initially the S
$JGBO BarChart Technical Analysis
http://www.barchart.com/technicals/stocks/JGBO
Form N-CSRS ~ SEC Filings Explained
Certified semi-annual shareholder report of registered management investment companies
Exponential moving averages highlight recent changes in a stock's price. By comparing EMAs of different lengths, the MACD line gauges changes in the trend of a stock. By then comparing differences in the change of that line to an average, an analyst can identify subtle shifts in the strength and direction of a stock's trend.
$MFRVF BarChart Technical Analysis
http://www.barchart.com/technicals/stocks/MFRVF
Star Formations[/]
Stars are similar to gaps. A long body followed by a much shorter candlestick with a short body, where the bodies must not overlap -- though their shadows may.
$NWSZF BarChart Technical Analysis
http://www.barchart.com/technicals/stocks/NWSZF
RSI in Technical Analysis for the Trading Professional, Constance Brown suggests that oscillators do not travel between 0 and 100. This also happens to be the name of the first chapter. Brown identifies a bull market range and a bear market for RSI. RSI tends to fluctuate between 40 and 90 in a bull market (uptrend) with the 40-50 zones acting as support. These ranges may vary depending on RSI parameters, strength of trend and volatility of the underlying security.
DEF 14A~ SEC Filings Explained
A proxy statement is a statement required of a firm when soliciting shareholder votes. This statement is filed in advance of the annual meeting. The firm needs to file a proxy statement, otherwise known as a Form DEF 14A (Definitive Proxy Statement), with the U.S. Securities and Exchange Commission. This statement is useful in assessing how management is paid and potential conflict-of-interest issues with auditors. The statement includes:
? Voting procedure and information.
? Background information about the company's nominated directors including relevant history in the company or industry, positions on other corporate boards, and potential conflicts in interest.
? Board compensation.
? Executive compensation, including salary, bonus, non-equity compensation, stock awards, options, and deferred compensation. Also, information is included about perks such as personal use of company aircraft, travel, and tax gross-ups. Many companies will also include pre-determined payout packages for if an executive leaves the company.
? Who is on the audit committee, as well as a breakdown of audit and non-audit fees paid to the auditor.
SEC proxy rules: The term "proxy statement" means the statement required by Section 240.14a-3(a) whether or not contained in a single document.
In many cases, shareholder votes - particularly institutional shareholder votes - are determined by proxy firms which advise the shareholders...
Traditionally, broker-dealers have been permitted to vote for "routine" proposals on behalf of their shareholders if the shareholders do not return the proxy statement. This has been controversial, and in 2006 the NYSE Proxy Working Group recommended that the rules be modified so that uncontested director elections were not considered routine.[1] The SEC approved the rule on July 1, 2009.[2]
In July 2010, the SEC announced that it was seeking public comment on the efficiency of the proxy system.[3]
There has been some controversy over "proxy access" which is a method to allow shareholders to nominate candidates which appear on the proxy statement. Currently, only the nominating board can place candidates on the proxy statement. The United States Dodd–Frank Wall Street Reform and Consumer Protection Act specifically allowed the SEC to rule on this issue. In 2010, the SEC passed a rule which allowed certain shareholders to place candidates on the proxy statement,;[4] however, the rule was struck down by the United States Court of Appeals for the District of Columbia Circuit in 2011
$ORRV BarChart Technical Analysis
http://www.barchart.com/technicals/stocks/ORRV
Oversold in Up Trend. This scan searches for stocks where the Force Index (100) is in positive territory and the Commodity Channel Index (20) is oversold. A positive Force Index establishes an overall up trend. An oversold CCI identifies a pullback within this up trend. This scan is meant as a starting point. Further scrutiny and adjustment is advised.
FOUR PRICE DOJI
The Four Price Doji is a single candlestick pattern. It is simply a horizontal line that has no upper or lower shadows.

Recognition Criteria:
1. The body is a horizontal line.
2. There are no upper or lower shadows at all.
3. The open, close, high and low are the same throughout the entire day.
Explanation:
A Four Price Doji is a very rare occurrence and it may be seen only if all the four price components are equal. That is, the open, high, low, and close turn out to be the same. It represents complete and total uncertainty by traders concerning the market direction.
Important Factors:
The Four Price Doji usually occurs when a stock is very illiquid, has low volume, or the data source do not report any other price other than the closing price.
The Four Price Doji is not reliable like most other single candlestick patterns. It only reflects one day's trading and conveys a sense of complete indecision. It usually is interpreted as a reversal pattern however this indicator must be used with other candlesticks for a healthier judgment about the course of the trend.
Like all other doji types, Four Price Doji is also important only in markets where there are not many doji. In a chart characterized by many doji, the emergence of Four Price Doji do not have a signal value.
$RYUN BarChart Technical Analysis
http://www.barchart.com/technicals/stocks/RYUN
The Coppock curve or Coppock indicator is a technical analysis indicator for long-term stock market investors created by E.S.C. Coppock, first published in Barron's Magazine on October 15, 1962.[1]
The indicator is designed for use on a monthly time scale. It's the sum of a 14-month rate of change and 11-month rate of change, smoothed by a 10-period weighted moving average.
Actively managed ETFs
Actively managed ETFs (AMETFs) are quite recent in the United States. The first one was offered in March 2008, but it was liquidated in October 2008. The actively managed ETFs approved to date are fully transparent, publishing their current securities portfolios on their web sites daily. However, the SEC has indicated that it is willing to consider allowing actively managed ETFs that are not fully transparent in the future.[4]
The fully transparent nature of existing ETFs means that an actively managed ETF is at risk from arbitrage activities by market participants who might choose to front run its trades[citation needed]. The initial actively traded equity ETFs have addressed this problem by trading only weekly or monthly, however today, actively managed ETFs trade at the discretion of the manager and to date, there have been no instances of front running. Actively traded debt ETFs, which are less susceptible to front-running, trade their holdings more frequently.[30]
Actively managed ETFs have grown faster in their first three years of existence than index ETFs did in their first three years of existence. However, as track records develop, many see actively managed ETFs as a significant competitive threat to actively managed mutual funds
$AUMY BarChart Technical Analysis
http://www.barchart.com/technicals/stocks/AUMY
|
Followers
|
3286
|
Posters
|
|
|
Posts (Today)
|
0
|
Posts (Total)
|
2804248
|
|
Created
|
08/22/10
|
Type
|
Free
|
| Moderator Nilbud | |||
| Assistants mick ManicTrader PhotoChick Kirimi $Pistol Pete$ | |||
   Investor Hub Alerts: Sign up for 'STOCKGOODIES PLAYS OF THE WEEK ' E-Mail List Investor Hub Alerts: Sign up for 'STOCKGOODIES PLAYS OF THE WEEK ' E-Mail ListUPDATE; 5-1-22 courtesy of charting /\ wit tweezer top calls /\ Tony @Montana_Trades Really good study sheet on Candlestick Patterns [-chart]pbs.twimg.com/media/FRn8188XMAAdZvk?format=jpg&name=small[/chart] 

02-07-2021
|
|
Posts Today
|
0
|
|
Posts (Total)
|
2804248
|
|
Posters
|
|
|
Moderator
|
|
|
Assistants
|
| Volume | |
| Day Range: | |
| Bid Price | |
| Ask Price | |
| Last Trade Time: |


