 News
News  Market Data
  Discover
Support: 888-992-3836
Copyright © 2023 InvestorsHub Inc.


Register for free to join our community of investors and share your ideas. You will also get access to streaming quotes, interactive charts, trades, portfolio, live options flow and more tools.
$FROG BarChart Technical Analysis
http://www.barchart.com/technicals/stocks/FROG
Ulcer Index measures the depth and duration of percentage drawdowns in price from earlier highs. The greater a drawdown in value, and the longer it takes to recover to earlier highs, the higher the UI. Technically, it is the square root of the mean of the squared percentage drawdowns in value. The squaring effect penalizes large drawdowns proportionately more than small drawdowns.
Form 11-K, 11-K/A ~ SEC Filings Explained
Annual report of employee stock purchase, savings and similar plans (and amendment thereto)

$SAPX BarChart Technical Analysis
http://www.barchart.com/technicals/stocks/SAPX
Chaikin Money Flow is an oscillator that measures buying and selling pressure over a set period of time. At its most basic, money flow favors the bulls when CMF is positive and the bears when negative. Chartists looking for quicker money flow shifts can look for bullish and bearish divergences.
Form N-4 ~ SEC Filings Explained
Initial registration statement on Form N-4 for separate accounts (unit investment trusts)
$PRTN BarChart Technical Analysis
http://www.barchart.com/technicals/stocks/PRTN
TRIX is the 1-period percentage rate-of-change for a triple smoothed exponential moving average (EMA), which is an EMA of an EMA of an EMA. Here is a breakdown of the steps involved for a 15 period TRIX.
Form 20-F ~ SEC Filings Explained
Form 20-F is an SEC filing submitted to the US Securities and Exchange Commission used by certain foreign private issuers to provide information.
20-F, 20-F/A Annual and transition report of foreign private issuers pursuant to sections 13 or 15(d)
20FR12B, 20FR12B/A Form for initial registration of a class of securities of foreign private issuers pursuant to section 12(b)
20FR12G, 20FR12G/A Form for initial registration of a class of securities of foreign private issuers pursuant to section 12(g)
The postfix /A stands for 'Amendment'
The report must be filed within six months after the end of the fiscal year.
$IVFH BarChart Technical Analysis
http://www.barchart.com/technicals/stocks/IVFH
RSI tends to fluctuate between 10 and 60 in a bear market (downtrend) with the 50-60 zone acting as resistance. Chart 10 shows 14-day RSI for the US Dollar Index ($USD) during its 2009 downtrend. RSI moved to 30 in March to signal the start of a bear range. The 40-50 zone subsequently marked resistance until a breakout in December.
Hammer and Gravestone
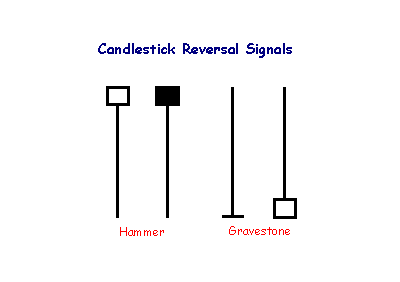
The hammer is not as strong as the dragonfly candlestick, but also signals reversal after a down-trend: control has shifted from sellers to buyers. The shadow of the candlestick should be at least twice the height of the body.
A gravestone is identified by open and close near the bottom of the trading range. The candlestick is the converse of a hammer and signals reversal when it occurs after an up-trend.
$PREV BarChart Technical Analysis
http://www.barchart.com/technicals/stocks/PREV
The purpose of Bollinger Bands is to provide a relative definition of high and low. By definition, prices are high at the upper band and low at the lower band. This definition can aid in rigorous pattern recognition and is useful in comparing price action to the action of indicators to arrive at systematic trading decisions.
BULLISH UNIQUE THREE RIVER BOTTOM
The Bullish Unique Three River Bottom Pattern is an extremely rare bottom reversal pattern. Its first candlestick is an extended black candlestick then followed by a second black real body closing higher than the first candlestick’s close, and the third candlestick is a white candlestick with a very small real body. The real white body shows that the market lost the selling pressure.

Recognition Criteria:
1. Market is characterized by a downtrend.
2. We see a long black candlestick in the first day.
3. Then we see a Hammer-like black candlestick on the second day.
4. The lower shadow of the second day sets a new low.
5. Then we see a short white candlestick, which is below the second day candlestick.
Explanation:
With the Unique Three River Bottom bull pattern, we first see a long black stick in a falling market. The next day opens at a higher level, however bearish sentiment is strong causing a new low during the day however the day closes near the high thus producing a small black body within the body of the first day. This rally questions the strength of bears. The increasing uncertainty is further strengthened when the third day opens lower, but not lower than the low of the second day. There is some stability on the third day as evidenced by its small white body. Third day ends by a rally closing below the close of the second day. If price rises to new high on the fourth day, then a reversal of trend is confirmed.
Important Factors:
A confirmation on fourth day is advisable to show that that the downtrend has reversed. This may be in the form of a white candlestick, a large gap up or a higher close on the fourth day.
$SDRG BarChart Technical Analysis
http://www.barchart.com/technicals/stocks/SDRG
Simple vs Exponential Moving Averages
Even though there are clear differences between simple moving averages and exponential moving averages, one is not necessarily better than the other. Exponential moving averages have less lag and are therefore more sensitive to recent prices - and recent price changes. Exponential moving averages will turn before simple moving averages. Simple moving averages, on the other hand, represent a true average of prices for the entire time period. As such, simple moving averages may be better suited to identify support or resistance levels.
Moving average preference depends on objectives, analytical style and time horizon. Chartists should experiment with both types of moving averages as well as different timeframes to find the best fit.
Below is an example of a chart with both the SMA
Keltner Channels also use an exponential moving average, which is more sensitive than the simple moving average used in Bollinger Bands. The chart below shows Keltner Channels (blue), Bollinger Bands (pink), Average True Range (10), Standard Deviation (10) and Standard Deviation (20) for comparison. Notice how the Keltner Channels are smoother than the Bollinger Bands. Also notice how the Standard Deviation covers a larger range than the Average True Range (ATR).
$DUSS BarChart Technical Analysis
http://www.barchart.com/technicals/stocks/DUSS
SEC Filings Explained ~ F-1
Registration statement for certain foreign private issuers.
There are two differences between Keltner Channels and Bollinger Bands. First, Keltner Channels are smoother than Bollinger Bands because the width of the Bollinger Bands is based on the standard deviation, which is more volatile than the Average True Range (ATR). Many consider this a plus because it creates a more constant width. This makes Keltner Channels well suited for trend following and trend identification.
$EFIR BarChart Technical Analysis
http://www.barchart.com/technicals/stocks/EFIR
Form S-8 ~ SEC Filings Explained
Initial registration statement for securities to be offered to employees pursuant to employee benefit plans
The Coppock Curve is simply a smoothed momentum oscillator. Even though it was originally designed for monthly charts and long-term analysis, it can be used on intraday, daily or weekly charts and the settings can be adjusted to suit one's style. The main signals are generated with crosses above and below the zero line. More aggressive chartists can consider looking for bullish and bearish divergences to anticipate such crossovers. Be careful though. Divergences do not always result in trend reversals because the trend can simply slow and continue in the same direction.
$PMCB PharmaCyte Biotech Announces Production of Master Cell Bank PMCB
LAGUNA HILLS, Calif.--(BUSINESS WIRE)--PharmaCyte Biotech, Inc. (OTCQB: PMCB), a clinical stage biotechnology company focused on developing targeted cellular therapies for cancer and diabetes using its signature live-cell encapsulation technology, Cell-in-a-Box®, today reported that the production of the cells necessary to prepare the Master Cell Bank (MCB) has started. This important work is being carried out by Eurofins, a leading Contract Manufacturing Organization, PharmaCyte selected for this task. Successful development of the MCB is a critical step in PharmaCyte’s preparation for its pancreatic cancer clinical trial.
“The decision to forego a WCB was made because we believe that the MCB will contain more than enough cells for the clinical trial. The goal is to validate PharmaCyte’s unique technology at the earliest opportunity.”
Tweet this
PharmaCyte’s Chief Executive Officer, Kenneth L. Waggoner, stated, “The commencement of the Master Cell Bank (MCB) by Eurofins means that many of the problems discussed during the shareholder call on November 1st have been overcome. When the MCB has been fully populated, the cells will undergo a variety of tests to ensure that they are correct in all respects and then placed in frozen storage for encapsulation and further testing by Austrianova.”
In consultation with principals at Austrianova, PharmaCyte has decided that, once the MCB is fully populated and successfully tested, cells from the MCB will be shipped to Austrianova and used for encapsulation. These encapsulated cells will then be used, along with low-doses of the cancer prodrug ifosfamide, in PharmaCyte’s pancreatic cancer clinical trial.
Waggoner added, “PharmaCyte has decided to proceed with only the MCB for the upcoming clinical trial and, as previously discussed, a Working Cell Bank (WCB) is not required. This will save both a significant amount of time and cost for PharmaCyte in the overall development process of the production of the encapsulated cells.
“The decision to forego a WCB was made because we believe that the MCB will contain more than enough cells for the clinical trial. The goal is to validate PharmaCyte’s unique technology at the earliest opportunity.”
About PharmaCyte Biotech
PharmaCyte Biotech is a clinical stage biotechnology company developing cellular therapies for cancer and diabetes based upon a proprietary cellulose-based live cell encapsulation technology known as “Cell-in-a-Box®.” This technology will be used as a platform upon which therapies for several types of cancer and diabetes are being developed.
PharmaCyte’s therapy for cancer involves encapsulating genetically engineered human cells that convert an inactive chemotherapy drug into its active or “cancer-killing” form. For pancreatic cancer, these encapsulated cells are implanted in the blood supply to the patient’s tumor as close as possible to the site of the tumor. Once implanted, a chemotherapy drug that is normally activated in the liver (ifosfamide) is given intravenously at one-third the normal dose. The ifosfamide is carried by the circulatory system to where the encapsulated cells have been implanted. When the ifosfamide flows through pores in the capsules, the live cells inside act as a “bio-artificial liver” and activate the chemotherapy drug at the site of the cancer. This “targeted chemotherapy” has proven effective and safe to use in past clinical trials and results in no treatment related side effects.
PharmaCyte’s therapy for Type 1 diabetes and insulin-dependent Type 2 diabetes involves encapsulating a human cell line that has been genetically engineered to produce, store and release insulin in response to the levels of blood sugar in the human body. The encapsulation will be done using the Cell-in-a-Box® technology. Once the encapsulated cells are implanted in a diabetic patient, they will function as a “bio-artificial pancreas” for purposes of insulin production.
Safe Harbor
This press release contains forward-looking statements, which are generally statements that are not historical facts. Forward-looking statements can be identified by the words "expects," "anticipates," "believes," "intends," "estimates," "plans," "will," "outlook" and similar expressions. Forward-looking statements are based on management's current plans, estimates, assumptions and projections, and speak only as of the date they are made. We undertake no obligation to update any forward-looking statement because of new information or future events, except as otherwise required by law. Forward-looking statements involve inherent risks and uncertainties, most of which are difficult to predict and are generally beyond our control. Actual results or outcomes may differ materially from those implied by the forward-looking statements due to the impact of numerous risk factors, many of which are discussed in more detail in our Annual Report on Form 10-K and our other reports filed with the Securities and Exchange Commission.
More information about PharmaCyte Biotech can be found at www.PharmaCyte.com. Information may also be obtained by contacting PharmaCyte’s Investor Relations Department.
Contacts
Investor Relations:
PharmaCyte Biotech, Inc.
Dr. Gerald W. Crabtree
Investor Relations Department
917.595.2856
Info@PharmaCyte.com
$ELRA BarChart Technical Analysis
http://www.barchart.com/technicals/stocks/ELRA
A ratio of positive and negative money flow is then plugged into an RSI formula to create an oscillator that moves between zero and one hundred. As a momentum oscillator tied to volume, the Money Flow Index (MFI) is best suited to identify reversals and price extremes with a variety of signals.
$RBCC BarChart Technical Analysis
http://www.barchart.com/technicals/stocks/RBCC
Trix is calculated with a given N-day period as follows:
Smooth prices (often closing prices) using an N-day exponential moving average (EMA).
Smooth that series using another N-day EMA.
Smooth a third time, using a further N-day EMA.
Calculate the percentage difference between today's and yesterday's value in that final smoothed series.
SEC Filings Explained ~ Rule 144
On December 6, 2007, the SEC published final rules revising Rule 144 under the Securities Act of 1933, which regulates the resale of restricted securities and securities held by affiliates. The amendments to Rule 144, among other things:
1. Shorten the holding period for affiliate and non-affiliate holders of restricted securities of SEC-reporting companies to six months, subject to certain conditions
2. Permit unlimited resale by non-affiliate holders of restricted securities by complying only with the current public information condition for resale of restricted securities issued by SEC reporting companies made after the six-month holding period; and without complying with any Rule 144 conditions for resale of restricted securities issued by both SEC reporting and non-reporting companies made after a one-year holding period.
3. permit resale of equity securities by affiliates that meet certain conditions through riskless principal transactions and brokers’ transactions in which the broker has published bid and asked quotations for the security in an alternative trading system.
4. Eliminate the manner of sale conditions and ease the volume limitations for resale of debt securities by affiliates.
5. Increase the thresholds that trigger the Form 144 filing requirement to 5,000 shares or $50,000.
The SEC did not adopt previously proposed provisions relating to the tolling of holding periods in connection with hedging transactions.
The amendments will become effective on February 15, 2008, and will apply to securities acquired before or after that date. Background
Rule 144 regulates the resale of “restricted securities”1 and “control securities,”2 by establishing certain conditions that must be satisfied in order for the resale to be exempt from the Securities Act registration requirements pursuant to Section 4(1) of the Securities Act—a safe harbor from “underwriter” status for the selling security holder.
The conditions include the following:
? There must be adequate current public information available about the issuer;
? If the securities being sold are restricted securities, the security holder must have held the security for a specified holding period;
? The resale must be within specified sales volume limitations;
? The resale must comply with the manner of sale requirements of the rule; and
? The selling security holder must file Form 144 with the SEC if the amount of securities being sold exceeds specified thresholds.
Amendments to Conditions for Resale of Restricted Securities
Restricted Securities of SEC-Reporting Companies. The SEC has reduced the holding period under Rule 144 for restricted securities of SEC-reporting companies held by both affiliates and non-affiliates from one year to six months. Affiliate holders of reporting company securities may now resell their restricted securities after six months, subject to the other Rule 144 requirements. Non-affiliate holders of reporting company securities (who have also not been affiliates during the prior three months) may now resell their restricted securities held between six months and one year subject only to Rule 144’s current public information requirement. Any such resale by a non-affiliate after one year will be exempt from all Rule 144 requirements.
Restricted Securities of Non-Reporting Companies. There is still a one-year holding period for affiliate and non-affiliate holders of restricted securities in non-reporting companies under amended Rule 144. After the one-year holding period, non-affiliates may now resell their restricted securities without having to comply with any other Rule 144 requirements; affiliates seeking to resell their restricted securities must still meet all Rule 144 requirements.
The manner of sale requirements of Rule 144 require securities to be sold in “brokers’ transactions” or in transactions directly with a “market maker.”
The rule includes restrictions on (1) soliciting or arranging for the solicitation of orders to buy the securities in anticipation of, or in connection with, the Rule 144 transaction or (2) making any payment in connection with the offer or sale of the securities to any person other than the broker who executes the order to sell the securities.
The SEC amended these rules to also permit the resale of restricted equity securities by affiliates through riskless principal transactions in which trades are executed at the same price, exclusive of any explicitly disclosed markup or markdown, commission equivalent or other fee, and the rules for a self-regulatory organization permit the transaction to be reported as riskless.3 The amended rule also expands the definition of a “brokers’ transaction” for purposes of such resale by permitting a broker to insert bid and ask quotations for the security in an alternative trading system, provided that the broker has published bona fide bid and ask quotations for such security on each of the last 12 business days. Resale of Restricted Debt Securities The SEC has eliminated the manner-of-sale requirements for affiliate resale of debt securities, including non-participatory preferred stock (which has debt-like characteristics) and asset-backed securities. The SEC also raised the volume limitations for the resale of debt securities to permit resale in an amount that does not exceed ten percent of a tranche (or a class with respect to non-participatory preferred stock), together with all sales of securities of the same tranche sold for the selling debt security holder within a three-month period. Form 144 Filing Triggers
The sales thresholds for filing Form 144 have been increased from 500 shares or $10,000 worth of securities to 5,000 shares or $50,000. Codified
SEC Staff Interpretations
The SEC has also codified various staff interpretations relating to Rule 144, including the following:
1. Stating that securities acquired by accredited investors pursuant to Section 4(6) of the Securities Act are considered restricted securities
2. Permitting tacking of holding periods when a company reorganizes into a holding company structure
3. Permitting tacking of holding periods for conversions and exchanges of securities
4. Deeming the acquisition dates for securities acquired pursuant to the cashless exercise of options and warrants as the dates the options or warrants were acquired
5. Permitting a pledgee of restricted securities to sell the pledged securities without having to aggregate the sale with sales by other pledgees from the same pledgor (as long as there is no concerted action by those pledgees), for purposes of the Rule 144 volume limitation condition
6. Permitting the Form 144 representations required from security holders relying on Exchange Act Rule 10b5-1 to be made as of the date the holder adopted a trading plan or gave trading instructions
7. Confirming the unavailability of Rule 144 for the resale of securities by reporting and non-reporting firms
$FTEG BarChart Technical Analysis
http://www.barchart.com/technicals/stocks/FTEG
A crossing of the MACD line through zero happens when there is no difference between the fast and slow EMAs. A move from positive to negative is bearish and from negative to positive, bullish. Zero crossovers provide evidence of a change in the direction of a trend but less confirmation of its momentum than a signal line crossover.
Doji Star
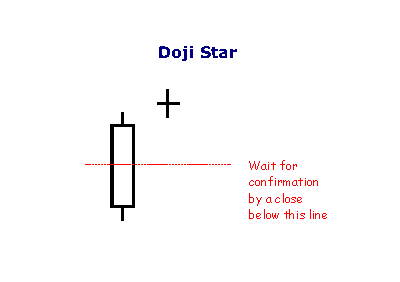
A Doji Star is weaker than the Morning or Evening Star: the doji represents indecision. The doji star requires confirmation from the next candlestick closing in the bottom half of the body of the first candlestick.
$SGAS BarChart Technical Analysis
http://www.barchart.com/technicals/stocks/SGAS
The MACD "oscillator" or "indicator" is a collection of three signals (or computed data-series), calculated from historical price data, most often the closing price. These three signal lines are: the MACD line, the signal line (or average line), and the difference (or divergence).
United States Natural Gas (NYSE:UNG)
Funds can also provide a way to invest in natural resources. This investments gives a replication of natural gas prices , after expenses. It will try to follow the prices of natural gas by buying futures contracts on natural gas in the coming months. As with all funds you need to keep an eye on the total expense ratio before investing.
RSI is an extremely popular momentum indicator that has been featured in a number of articles, interviews and books over the years. In particular, Constance Brown's book, Technical Analysis for the Trading Professional, features the concept of bull market and bear market ranges for RSI. Andrew Cardwell, Brown's RSI mentor, introduced positive and negative reversals for RSI. In addition, Cardwell turned the notion of divergence, literally and figuratively, on its head.
$KDKN BarChart Technical Analysis
http://www.barchart.com/technicals/stocks/KDKN
THREE OUTSIDE UP
The Bearish Upside Gap Two Crows Pattern is a three-candlestick pattern and it signals a top reversal. The first candlestick is a long white candlestick followed by a real body that gaps higher. Then another black real body appears, which opens above the second day’s open and closes under the second day’s close, completing the pattern
Recognition Criteria:
1. Market is characterized by downtrend.
2. We see a Bullish Engulfing Pattern in the first two days.
3. The third day is a white candlestick with a higher close than the second day.
Explanation:
The first two days of this three-day pattern is simply a Bullish Engulfing Pattern, and the third day confirms the reversal suggested by the Bullish Engulfing Pattern since it is a white candlestick closing with a new high for the last three days.
Chaikin Money Flow can be used to define a general buying or selling bias simply with positive or negative values. The indicator oscillates above/below the zero line. Generally, buying pressure is stronger when the indicator is positive and selling pressure is stronger when the indicator is negative.
$ETLS BarChart Technical Analysis
http://www.barchart.com/technicals/stocks/ETLS
Inverted Hammer

The Inverted Hammer is a type of bullish reversal pattern. As its name implies, the Inverted Hammer looks like an upside down version of the hammer candlestick pattern. Like the hammer candlestick pattern, the Inverted Hammer consists of one candle and when found in a downtrend is considered a potential reversal pattern.
The pattern is made up of a candle with a small lower body and a long upper wick which is at least two times as large as the short lower body. The body of the candle should be at the low end of the trading range and there should be little or no lower wick in the candle.

The long upper wick of the candlestick pattern indicates that the buyers drove prices up at some point during the period in which the candle was formed but encountered selling pressure which drove prices back down for the period to close near to where they opened. As this occurred in an uptrend the selling pressure is seen as a potential reversal sign. When encountering the Inverted Hammer traders will look for a higher open on the next period before considering the pattern confirmed and potentially including it in their trading strategy.
Divergences signal a potential reversal point because directional momentum does not confirm price. A bullish divergence occurs when the underlying security makes a lower low and RSI forms a higher low. RSI does not confirm the lower low and this shows strengthening momentum. A bearish divergence forms when the security records a higher high and RSI forms a lower high. RSI does not confirm the new high and this shows weakening momentum. Chart 5 shows Ebay (EBAY) with a bearish divergence in August-October. The stock moved to new highs in September-October, but RSI formed lower highs for the bearish divergence. The subsequent breakdown in mid October confirmed weakening momentum.
MORNING DOJI STAR
This is also a three-candlestick formation signaling a major bottom reversal. It is composed of a long black candlestick followed by a doji, which characteristically gaps down to form a doji star. Then we have a third white candlestick whose closing is well into the first session’s black real body. This is a meaningful bottom pattern.
Recognition Criteria:
1. Market is characterized by downtrend.
2. We see a long black candlestick in the first day.
3. Then we see a Doji on the second day that gaps in the direction of the previous downtrend.
4. The white candlestick on the third day confirms the reversal.
Explanation:
Black real body while market is falling down may suggest that the bears are in command. Then a Doji appears showing the diminishing capacity of sellers to drive the market lower. Confirmation of bull ascendancy is the third day’s strong white real body. An ideal Bullish Morning Doji Star Pattern must have a gap before and after the middle line’s real body. The second gap is rare, but lack of it does not take away from the power of this formation.
Important Factors:
The Doji may be more than one, two or even three.
Doji’s gaps are not important.
$MPPCQ BarChart Technical Analysis
http://www.barchart.com/technicals/stocks/MPPCQ
The MACD fluctuates above and below the zero line as the moving averages converge, cross and diverge. Traders can look for signal line crossovers, centerline crossovers and divergences to generate signals. Because the MACD is unbounded, it is not particularly useful for identifying overbought and oversold levels.
Using Moving Averages to Find Support and Resistance
Moving averages can also act as support in an uptrend and resistance in a downtrend. A short-term uptrend might find support near the 20-day simple moving average, which is also used in Bollinger Bands. A long-term uptrend might find support near the 200-day simple moving average, which is the most popular long-term moving average. If fact, the 200-day moving average may offer support or resistance simply because it is so widely used. It is almost like a self-fulfilling prophecy.

The chart above shows the NY Composite with the 200-day simple moving average from mid 2004 until the end of 2008. The 200-day provided support numerous times during the advance. Once the trend reversed with a double top support break, the 200-day moving average acted as resistance around 9500.
Do not expect exact support and resistance levels from moving averages, especially longer moving averages. Markets are driven by emotion, which makes them prone to overshoots. Instead of exact levels, moving averages can be used to identify support or resistance zones.
$CMRZF BarChart Technical Analysis
http://www.barchart.com/technicals/stocks/CMRZF
Raw Money Flow is essentially dollar volume because the formula is volume multiplied by the typical price. Raw Money Flow is positive when the typical price advances from one period to the next and negative when the typical price declines. The Raw Money Flow values are not used when the typical price is unchanged. The Money Flow Ratio in step 3 forms the basis for the Money Flow Index (MFI).
|
Followers
|
3284
|
Posters
|
|
|
Posts (Today)
|
0
|
Posts (Total)
|
2804248
|
|
Created
|
08/22/10
|
Type
|
Free
|
| Moderator Nilbud | |||
| Assistants mick ManicTrader PhotoChick Kirimi $Pistol Pete$ | |||
   Investor Hub Alerts: Sign up for 'STOCKGOODIES PLAYS OF THE WEEK ' E-Mail List Investor Hub Alerts: Sign up for 'STOCKGOODIES PLAYS OF THE WEEK ' E-Mail ListUPDATE; 5-1-22 courtesy of charting /\ wit tweezer top calls /\ Tony @Montana_Trades Really good study sheet on Candlestick Patterns [-chart]pbs.twimg.com/media/FRn8188XMAAdZvk?format=jpg&name=small[/chart] 

02-07-2021
|
|
Posts Today
|
0
|
|
Posts (Total)
|
2804248
|
|
Posters
|
|
|
Moderator
|
|
|
Assistants
|
| Volume | |
| Day Range: | |
| Bid Price | |
| Ask Price | |
| Last Trade Time: |


