 News
News  Market Data
  Discover
Support: 888-992-3836
Copyright © 2023 InvestorsHub Inc.


Register for free to join our community of investors and share your ideas. You will also get access to streaming quotes, interactive charts, trades, portfolio, live options flow and more tools.
Gold Record High of 2,431 Hit Before Retracing: What’s Next?
By: Bruce Powers | April 12, 2024
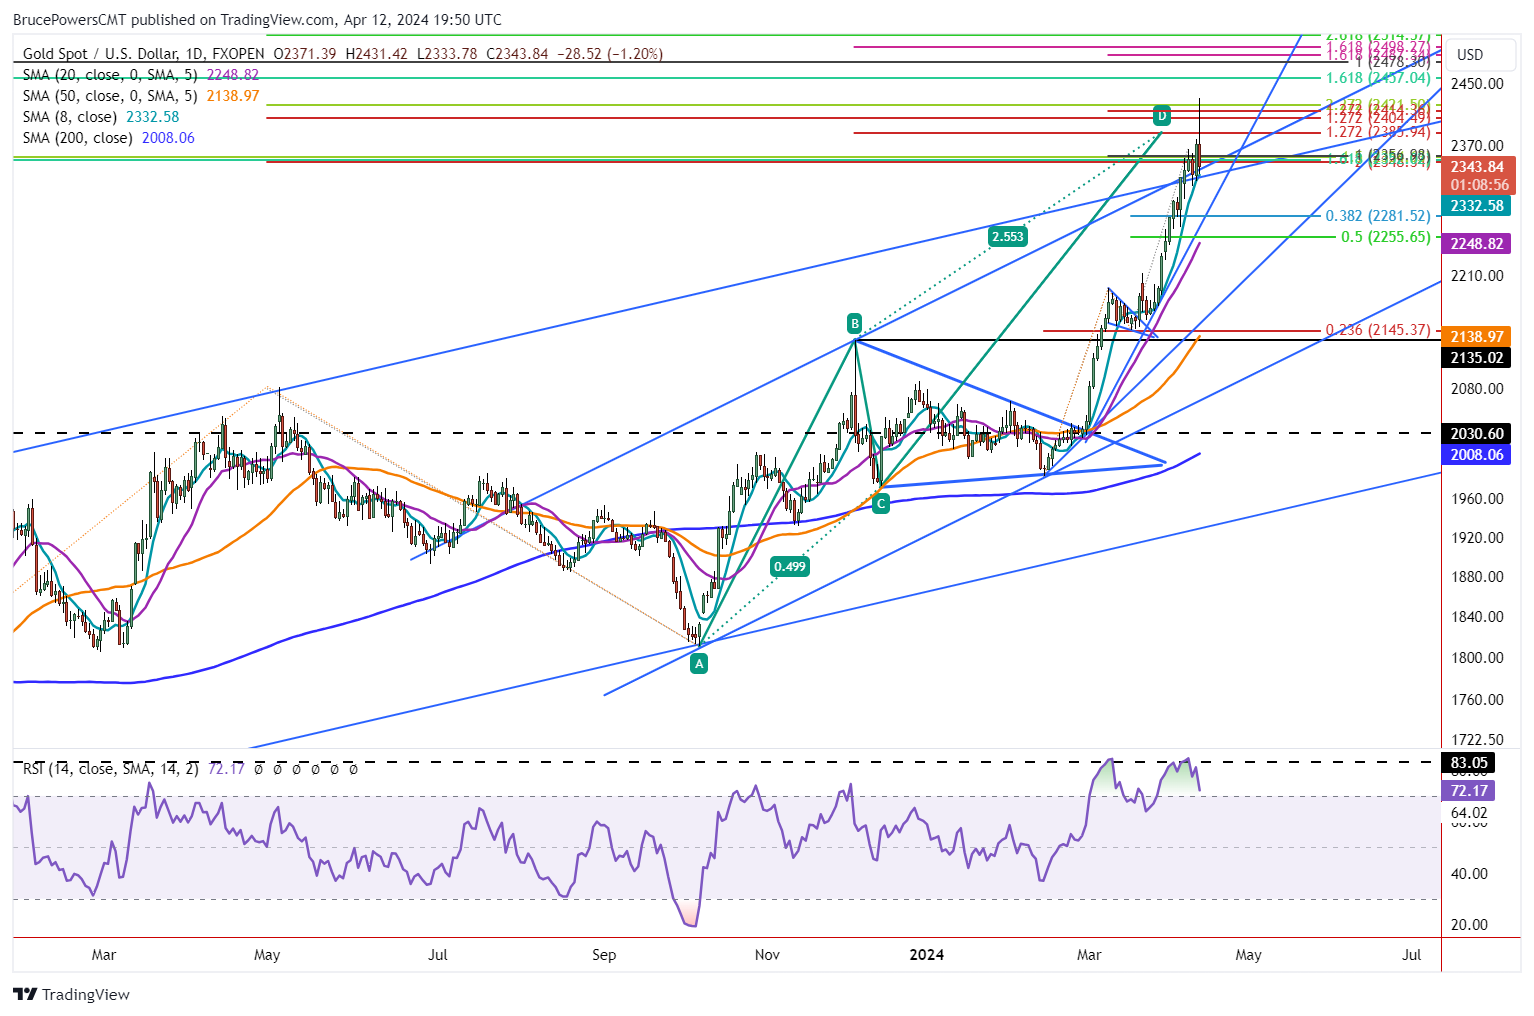
• Gold soared to a new record high of 2,431 before facing resistance, potentially marking a temporary top. Support near the 8-Day MA and Fibonacci levels will be crucial.
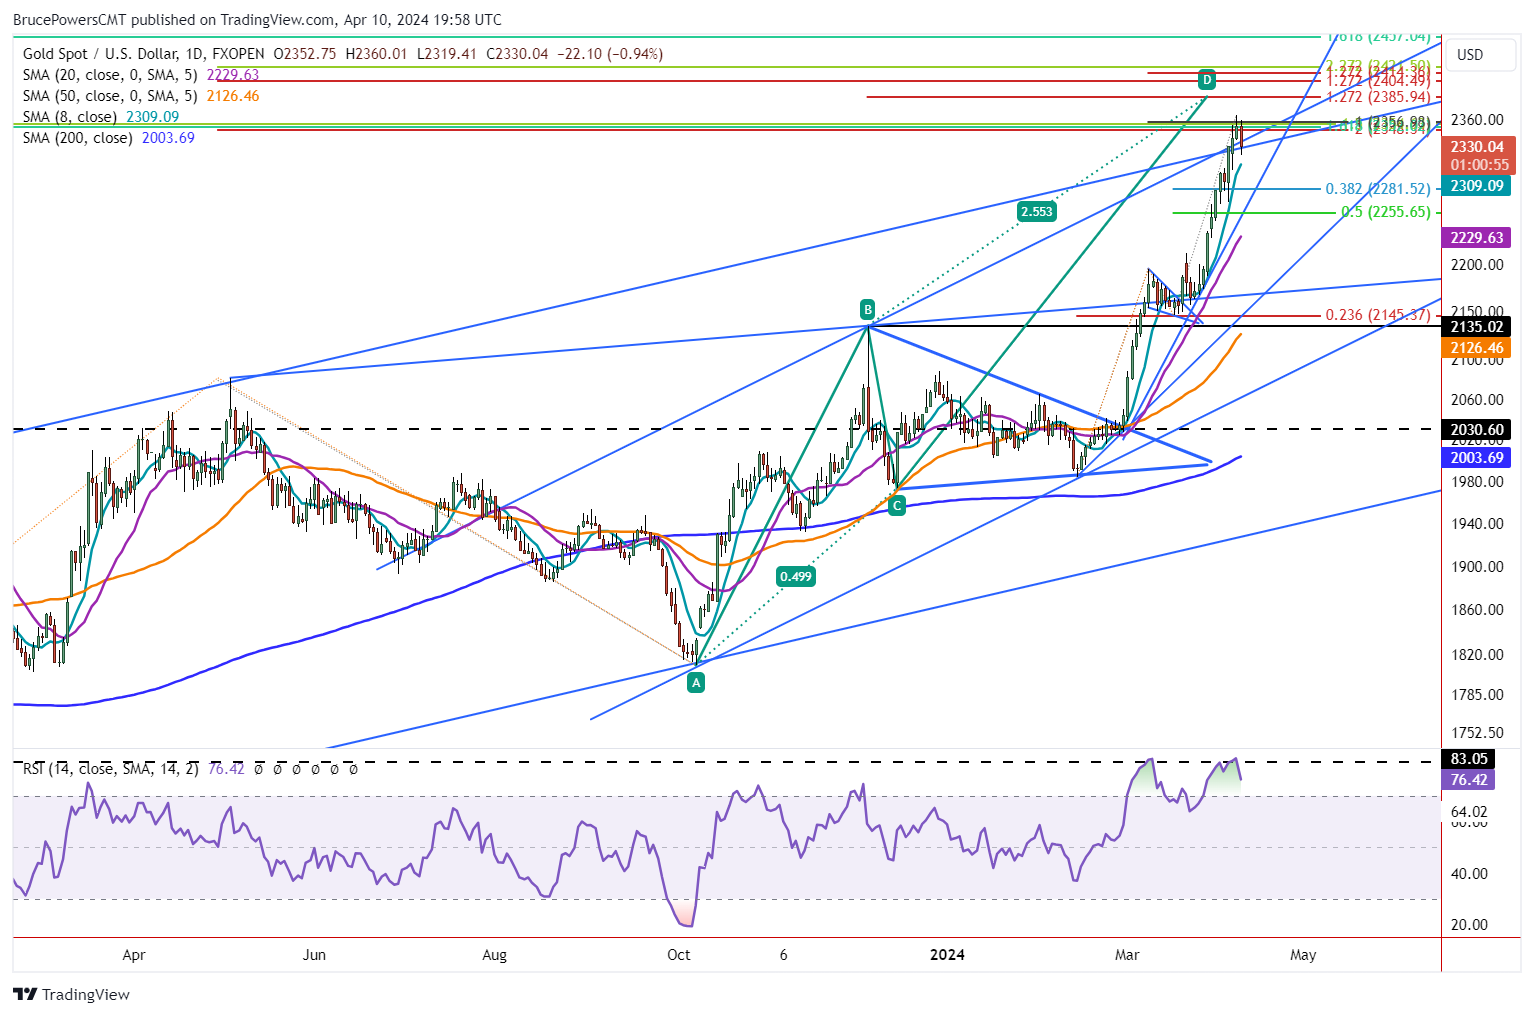
The runaway advance in gold headed to a new record high of 2,431 before resistance kicked in and turned the trend back down on an intraday basis. It looks like today could be the top for now. Today’s high exceeded the top of a Fibonacci confluence zone with a high of 2,422.
Support was subsequently seen near the 8-Day MA with a low of 2,334, at the time of this writing. In addition to the higher Fibonacci levels being reached a large ABCD pattern completed during today’s advance at 2,386.
Weak Close is Likely Clue for a Deeper Retracement
Gold is set to close weak, not only on the daily chart, but also on a weekly basis. Unless there is a rally prior to today’s close, gold will end the week with a bearish shooting star candlestick pattern. A weekly bearish signal will subsequently be given on a drop below this week’s low of 2,303. If hit, the short-term 8-Day MA will have already been broken.
Initial Retracement Levels
If a bearish retracement does trigger support might first be seen around the 38.2% Fibonacci retracement at 2,282. Also, the 50% retracement is at 2,256. However, since gold would be coming off a very aggressive rally, having risen as much as 22.5% from the February swing low of 1,984, a rapid recovery from a retracement may not come quickly.
Notice that the relative strength index (RSI) momentum oscillator has formed a double top and is fast turning back down from overbought conditions. The RSI has been the most overbought recently since the 2020 swing high.
Correction Could See Test of 20-Day MA
When considering the moving averages, a decline to test support around the 20-Day MA would not be surprising once the 8-Day line fails. It is currently at 2,249. Gold rose away from the 20-Day line prior to the symmetrical triangle breakout on February 29. Since then, there has not been a test of support at the line.
That means that once it is approached again, there is a good chance it will be tested. Today’s price action does not change the long-term bullish outlook for gold given its recent breakout from a multi-year basing pattern. As with all assets, profit taking eventually takes hold, weakening short-term demand and leading to a retracement.
Read Full Story »»»
 DiscoverGold
Gold into the April/May Target
By: Marty Armstrong | April 12, 2024
Gold has been primarily rising since the April 1st Israeli attack on Iran. Everyone is waiting for retaliation from Iran with the expectation that this will lead to a Middle East War. We still see that the target for April should produce an ideal high intraday and perhaps fall back to retest support for the ECM on May 7th. The primary threshold of resistance stands at the 2453.88 area, and we need to see a weekly closing above this level to imply a further ahead. An April high on a blow-off rally has resistance at 2627.39, 2822.79, and 2839.70. However, that does not appear likely just yet.
Caution is needed now, for this is often when people rush in to buy the high after a 7-month strong rally. Pay attention to the Daily and Weekly arrays at this time. Projections in price are NOT infallible. What tends to be more reliable is always the timing targets. Here, you can see that the top of this breakout channel stands at this 2453 zone. This indicated that the market is not running away at this time and has been trading within expected parameters. Also, look at the stochastic. It is at the top rather than the bottom, also suggesting that we are in a near-term topping-out pattern.
The FALSE MOVE appears to be shaping up. The market has sucked in a lot of people, and they expect it to just blast off. This is how a market will trap everyone. We do NOT want a high on May 7th, and April has been the target for the entire year. Let's see if we now get the FALSE MOVE after this high and then set the stage for the real rally with war.
DiscoverGold
June contract just hit a new all time high of $2,406.9 moments ago around the time Chinese buy orders started rolling in...
“There are decades where nothing happens, and there are weeks where decades happen.”
https://www.zerohedge.com/markets/godl-precious-metal-soars-above-2400-after-sudden-gap-higher
Is Someone Cornering The Gold Market Using Options?
Thursday, Apr 11, 2024
https://www.zerohedge.com/news/2024-04-11/ross-norman-someone-cornering-gold-markets-using-options
Gold Resistance at Fibonacci Confluence, Bullish Momentum Persists
By: Bruce Powers | April 11, 2024
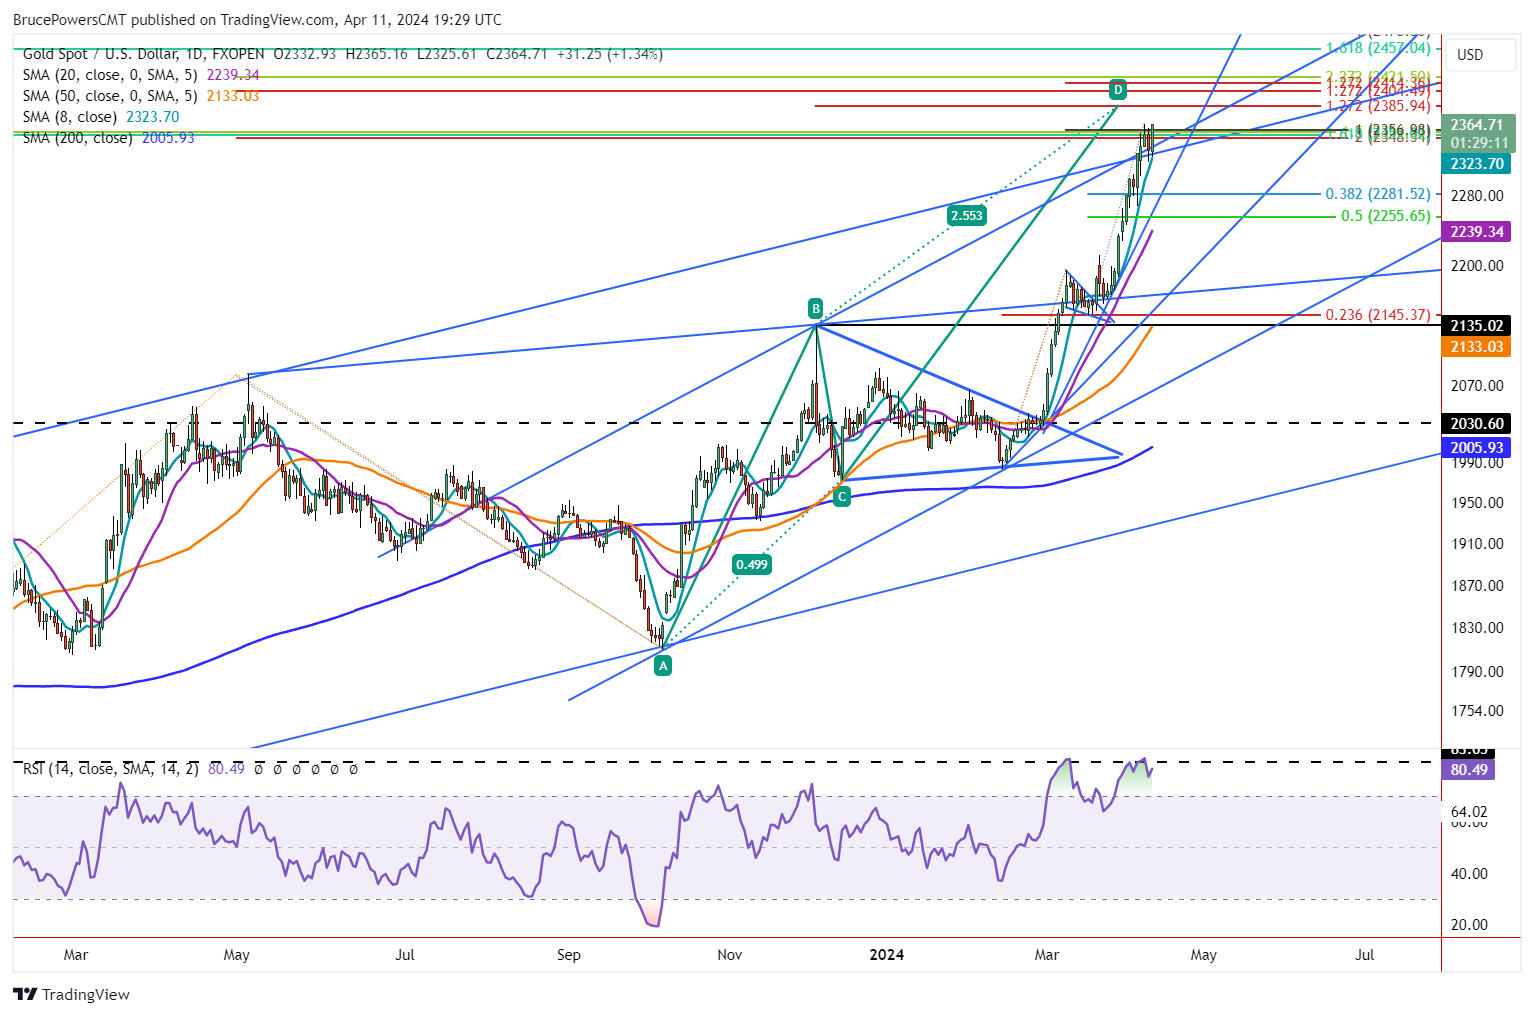
• Gold faces resistance but demand remains strong. Breakout above 2,365 could signal continued advance to higher targets.
Gold continues to press up into a resistance zone that has stalled the ascent since Monday. Support for the sharp rally is around the 8-Day MA at 2,322. It remains the most sensitive level to watch for a sign of a change. A decisive drop below the line could lead to a deeper retracement. Today’s low of 2,326 and yesterday’s low of 2,319 are other nearby price levels to watch.
Fibonacci Confluence Zone Marks Resistance
There are four Fibonacci levels that create the current resistance zone. They mark a potentially formidable supply area that may lead to a turn down in price prior or a move to new trend highs. A drop below today’s low provides the first sign of weakening. Weakness will then be further indicated on moves below 2,322 and 2,319. A daily close below 2,319 will confirm a pullback. Nevertheless, given the strong rally a pullback may not last long. It will leave clues as to remaining bullish demand.
Decisive Breakout Above 2,365 Triggers Bullish Continuation
Moreover, the Fibonacci confluence resistance zone marks a key pivot that gold may break through before a pullback. A decisive breakout above this week’s trend high at 2,365 will be bullish and could lead to the price of gold continuing to advance to the next higher target zones. It would mark a breakout from a key pivot zone.
At the time of this writing gold remains strong and is trading near the highs of the day and above yesterday’s high of 2,360. If it stays strong into the close the day may end at a new record high daily closing price. Also, notice that much of the trading for the past several days recognized support above the two trendlines that cross around 2,323. Each is a top line of a rising parallel trend channel.
New High Targets Start at 2,386
The first new high target completes a rising ABCD pattern with the CD leg extended by 127.2% of the AB leg. It is at 2,386. That target is followed by several higher Fibonacci targets that cover a range from around 2,404 to 2,422. Unless there is a sharp drop on Friday, gold is set to close strong for the week and near the highs. If it occurs, it suggests that buyers remain in charge, and they may stay in charge heading into next week.
Read Full Story »»»
DiscoverGold
Gold Corrections After Major Breakouts
By: Jordan Roy-Byrne | April 11, 2024
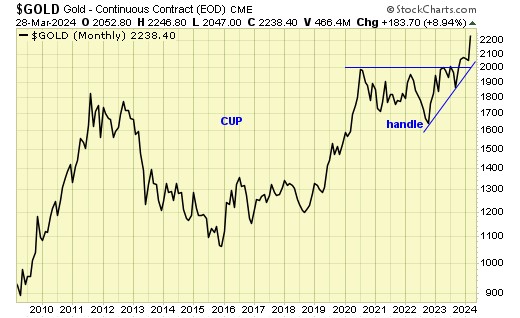
Gold has reached the first of a handful of measured upside targets at $2350.
It has another measured upside target of $2350 and the cup and handle targets of roughly $3000 and $4000.
Many observers will naturally worry about the next correction after unexpected and sudden strength. It is almost a knee-jerk reaction after many fits and starts in recent years.
A review of history helps us to understand that post-breakout corrections in Gold are usually minor.
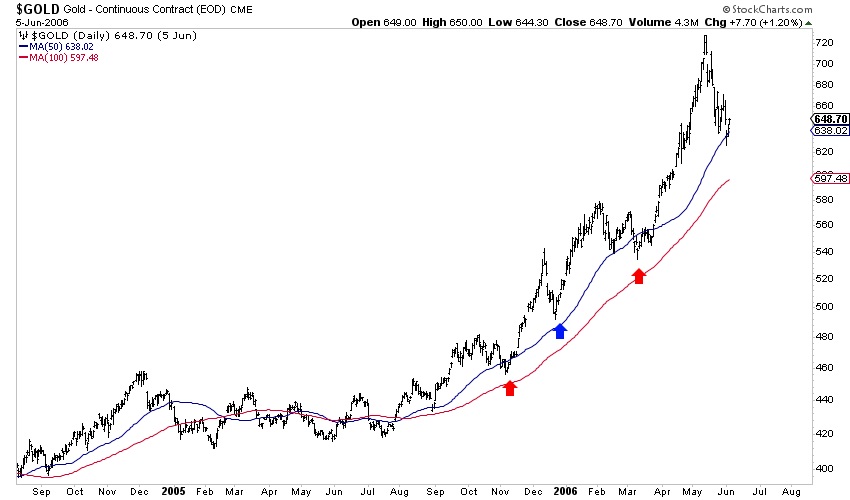
Let’s examine how Gold performed and corrected after similar major breakouts to new all-time highs. We use the 50-day, 100-day, and 150-day moving averages as support levels.
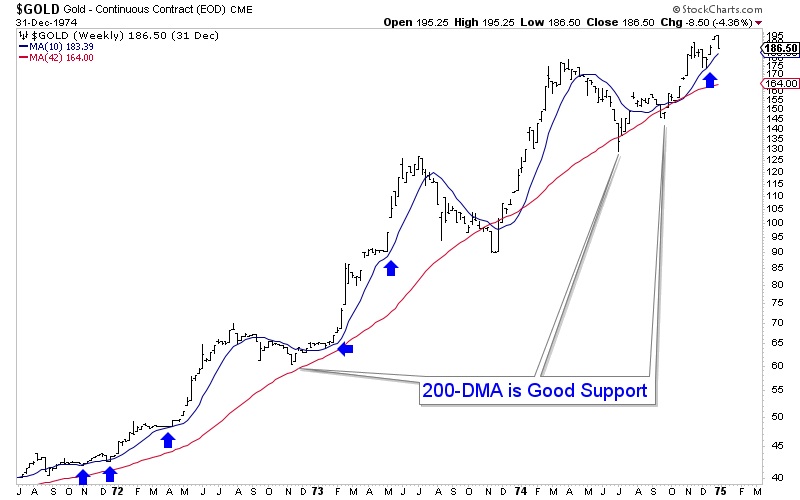
After President Nixon ended the Gold Standard, the price of Gold climbed from $35/oz in 1971 to nearly $200/oz at the end of 1974.
Gold enjoyed three strong legs higher and a fourth that was not as strong—during those three legs higher, Gold never lost its 50-day moving average.
Gold surged from $35 in 1971 to $125 in 1973, with only one 13% decline and single test of the 200-day moving average in between.
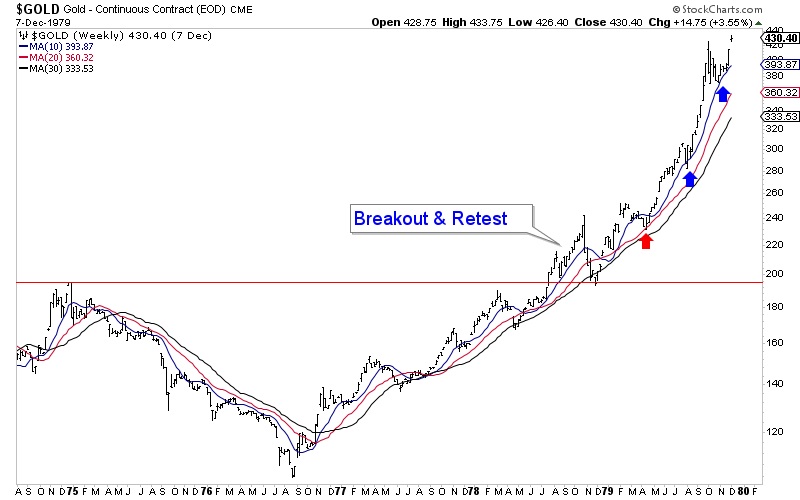
In the second half of 1978, Gold broke out to a new all-time high but quickly retested the breakout successfully.
After the successful retest in 1978, Gold had one pullback to its 100-day moving average in 1979 and remained above its 50-day moving average until its secular peak in January 1980.
The 2005 breakout was significant because although Gold did not break to a new all-time high, it broke a 23-year sideways range to a slight downtrend. It was the first time Gold had traded at $500 since the early 1980s.
After Gold broke out in September 2005, it carried to above $700 without even testing its 100-day moving average. (The 2007 breakout was similar).
The 2009 breakout to a new all-time high led to a strong but steady advance.
After the initial breakout move, Gold would test its 150-day moving average (black) four times over the next 12 months. Gold had slowed down after gaining 70% over the previous 13 months.

We can draw two conclusions from this analysis of history.
The first is that the corrections are minor unless Gold made a huge move in the previous year.
Gold, before its 20% snapback retest in late 1978, had rebounded 135% in the preceding two years. In 2010, Gold tested the 150-day moving average three different times. Those tests were preceded by a 70% rebound in 13 months.
The second conclusion is that when Gold moves higher impulsively, it tends to hold above its 50-day moving average.
Gold closed Wednesday near $2350. It is only 12% above the major breakout line, so there is no need to worry about a significant correction.
However, Gold is stretched above its 50-day moving average, and Silver now faces stiff resistance at $28-$29. It is reasonable for things to cool down and for Gold to test its 50-day moving average.
Nevertheless, Gold is only weeks past its most significant breakout in 50 years. We should expect gold stocks, especially junior gold stocks and silver stocks, to continue to outperform Gold over the next year or two.
Read Full Story »»»
DiscoverGold
Gold Sellers Take Charge for the Day
By: Bruce Powers | April 10, 2024
• A deeper pullback seems likely with the 8-Day MA at 2,319 showing near-term support.
Gold triggers a short-term bearish signal on a drop below yesterday’s low of 2,337. Also, it is on track to close below that level further confirming weakness and increasing the chance for a deeper pullback. As of this week’s new record high of 2,365, gold was up by 381 points or 19.2% from the February 14 swing low at 1,984. It is overdue for a retracement, even if it is short and shallow.
The relative strength index (RSI) may be reflecting a similar sentiment. Notice there is a double top present in the RSI, and it has risen to its highest reading since the peak in August 2020.
Weekly Trend Intact Above 2,228 Support
If a deeper retracement does come then last week’s low of 2,228 is going to be a key price level to watch for support, or higher. It is part of the price structure of the weekly trend. On the daily chart you can see how the 8-Day MA was tested as support last week and price was quickly rejected to the upside thereby confirming strong support.
Therefore, it could be an area of support again or mark a clean pivot towards lower price levels. Below the 8-Day line lies the 38.2% Fibonacci retracement at 2,282 and the 50% retracement at 2,256. The near-term uptrend line is also associated with those price areas but that depends on when the line is reached.
20-Day MA at 2,230 Key Support
A more significant price zone is represented by the 20-Day MA, now at 2,230. It helps determine the quality of the near-term trend. If gold stays above that line, strong upward momentum as seen recently may return. It usually is a more reliable line to gauge the market than the trendline. Gold remains in a near-term bullish posture if it stays above the 20-Day MA. Of course, this is relative to one’s time frame that is being used to engage the market.
Further Weakness Sets Up Bearish Weekly
Currently, the weekly chart shows weakness if it closed today. A bearish candle in the weekly chart would further point to a likely pullback before higher prices. In other words, where gold closes within the week’s trading range should provide clues as to whether it pulls back or continues to strengthen heading into next week.
Read Full Story »»»
DiscoverGold
Gold Price Forecast – Expert Predicts $10,000 Gold and $300 Silver
https://www.fxempire.com/forecasts/article/gold-price-forecast-expert-predicts-10000-gold-and-300-silver-1382665 $GLD
Gold New Record High but Faces Potential Resistance
By: Bruce Powers | April 9, 2024
• Gold reached a new record high but faces potential resistance at a Fibonacci confluence zone, increasing chance of a retracement.
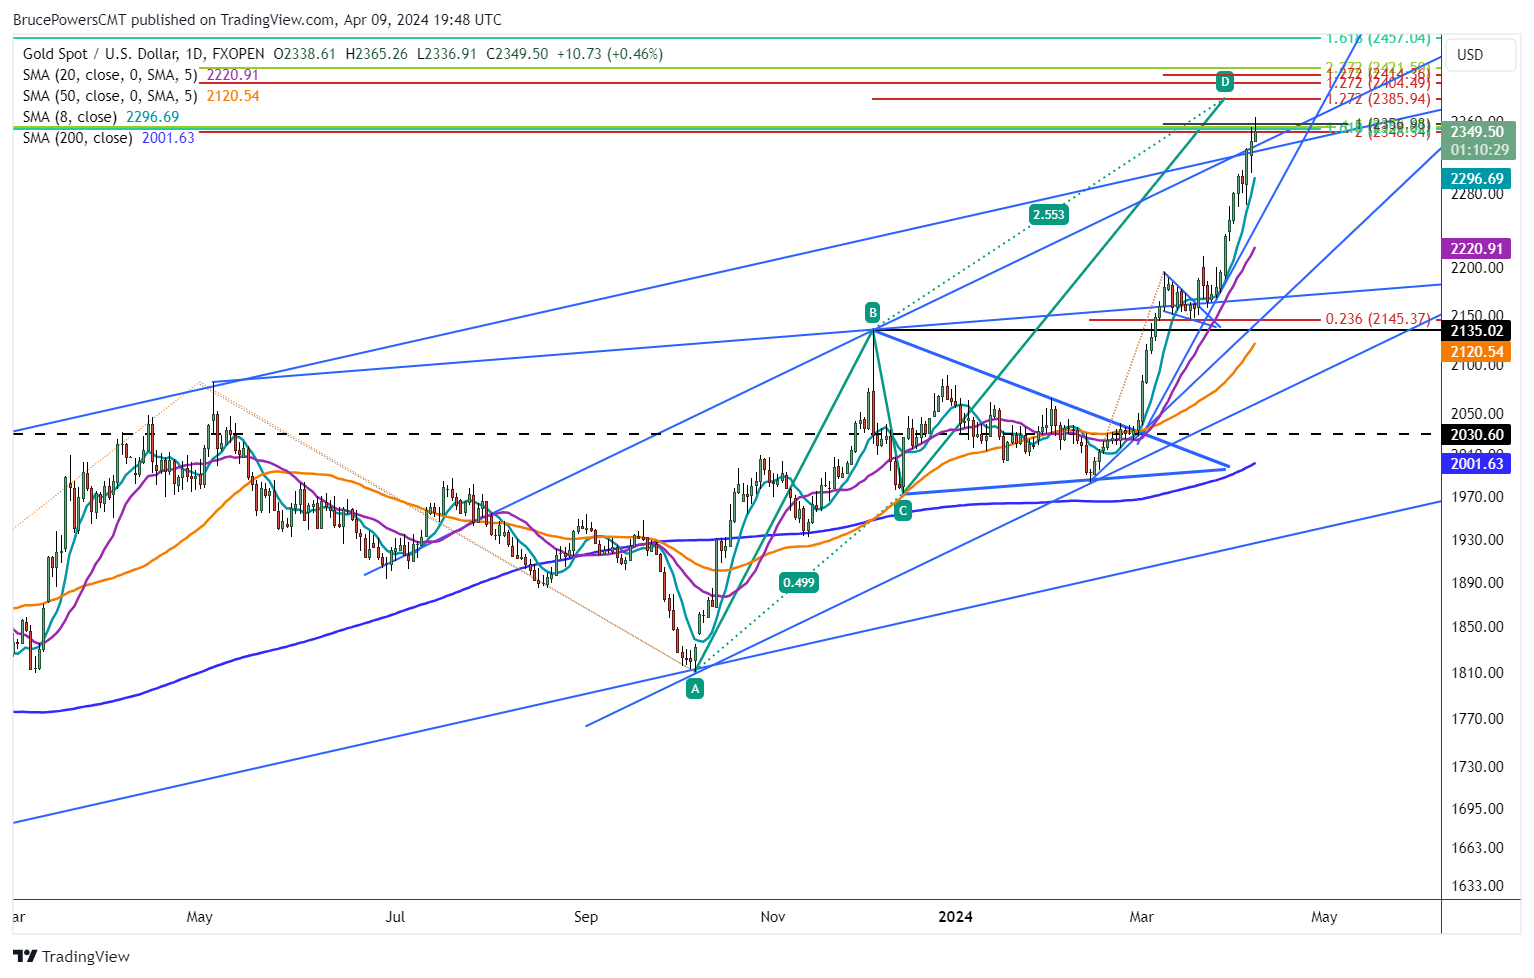
Gold looks to have stalled on Tuesday, following a new record high of 2,365 reached earlier in the session. It hit a potential resistance zone yesterday, based on Fibonacci confluence. The confluence zone shown on the chart is confirmed by more Fibonacci levels than any previously identified resistance zone since the rally began.
That is, since gold broke out of a symmetrical triangle consolidation pattern on February 29. In other words, gold is at the greatest risk of a retracement since the breakout. When more indicators identify a similar price zone the potential significance of that price zone increases. In addition, it may end the day with a bearish shooting star candlestick pattern.
Move Above 2,365, Says Rally is Not Over Yet
Nevertheless, if a decisive rally above today’s high of 2,365 triggers, higher prices will be in sight. The next higher price targets are at 2,386, followed by a Fibonacci confluence zone from around 2,404 to 2,421. The first level completes the target from a large rising ABCD pattern that is extended by the 127.2% Fibonacci ratio. It is interesting to note that there is a potential double top in the relative strength indicator (RSI) momentum oscillator. In addition, the oscillator is the most overbought since the summer of 2020.
8-Day Moving Average First Support Zone
If a pullback is in the plans before a new record high, then the first confirmation of weakness should be seen on a drop below today’s low of 2,337. There waw a quick pullback last week, but gold quickly bounced off support around the blue 8-Day MA. Certainly, it could do so again.
Currently, the 8-Day line is at 2,297. The 8-Day MA has done a good job of reflecting dynamic support for the current sharp rally. Nevertheless, given the aggressive move seen in the rally, a test of support around the 20-Day MA would not be a surprise. It is currently at 2,221. Or the uptrend line between the two moving averages could see support.
Following a correction gold is expected to continue to strengthen. It recently broke out of a three and a half year basing period and strength was confirmed with a new high monthly close. This means that the current uptrend is still in its early stages.
Read Full Story »»»
DiscoverGold
Gold $GLD - Latest: After tapping all my targets up to $2320 I now have my focus on 2800 target
By: Sahara | April 9, 2024
• $GOLD $GLD - Latest
After tapping all my targets up to $2320 I now have my focus on 2800 target. Which I showed on my lngr-term 24° channel chart prior.
Here I have a channel from the Jan/1980 high which gives me an 11° channel & shows us in the uppr-band aiming for $2800...

Read Full Story »»»
DiscoverGold
I wish to publicly express how grateful I am that some of my readers who were gracious enough to reciprocate.
I just wanted to convey some of the knowledge I had gained from trading for many years to those who were attempting to learn how to understand and look inside the markets for themselves.
Best of luck with your investments!
DiscoverGold
Your posts are, by far, the best on this entire platform across all the stocks you cover..I personally appreciate them and their information..
$GLD $2 Million Far OTM Call Sweeps
By: Cheddar Flow | April 9, 2024
• $GLD $2M Far OTM Call Sweeps
It is unusual to see this type of flow on $GLD

Read Full Story »»»
DiscoverGold
No bank is safe, implosion coming: 'Every single bank is insolvent' — Lynette Zang
https://kitco.com/news/article/2024-04-08/no-bank-safe-implosion-coming-every-single-bank-insolvent-lynette-zang $GLD
Gold Markets Continue to Look Higher
By: Christopher Lewis | April 8, 2024
• Although the gold market continues to rise, it seems as if we are running out of momentum, and it is worth noting that the RSI is stretched as well, showing that we might be ready for some kind of pullback.
Gold Markets Technical Analysis
You can see that we are a bit stretched yet again during the early hours on Monday, and it must be said that we have given back some of the gains that we initially had. Now, this doesn’t necessarily mean that it’s time to start selling gold, just that perhaps a pullback is finally coming. We’ve had a couple of minor pullbacks during the course of the last couple of days, but nothing to truly shock the market. There are plenty of reasons for gold to go higher over the longer term and therefore I look at any pullback as a potential buying opportunity, but I would much prefer a deeper correction. The relative strength index is sitting well above the 70 level, and it does suggest that perhaps a pullback could be coming.
At this juncture, I would look to the $2,200 level as an ideal entry point, assuming that we can pull back that far. And at this point, it would be about a $135 an ounce drop, something that wouldn’t necessarily be out of the question. On the other hand, if we break above the range for the day, then I think we will reach our target of $2,500 rather quickly, mainly due to the fact that there’s just so much momentum.
The reasons for gold going higher include interest rates dropping around the world, and central banks possibly collecting more gold than they had been in the past. Remember, they’ve been net buyers. And then perhaps the most obvious reason would be geopolitical tensions. So all of that does lead to higher gold prices over the longer term but it also must be said that we’ve gone straight up in the air for the last couple of weeks and perhaps it’s time to pull back a little bit.
Read Full Story »»»
DiscoverGold
$GLD Send Gold to the golden fib extension for the culture
By: TrendSpider | April 7, 2024
• Send Gold to the golden fib extension for the culture. $GLD.

Read Full Story »»»
DiscoverGold
Gold CoT: Peek Into Future Through Futures, How Hedge Funds Are Positioned
By: Hedgopia | April 6, 2024
• Following futures positions of non-commercials are as of April 2, 2024.
Gold: Currently net long 207.3k, up 8k.
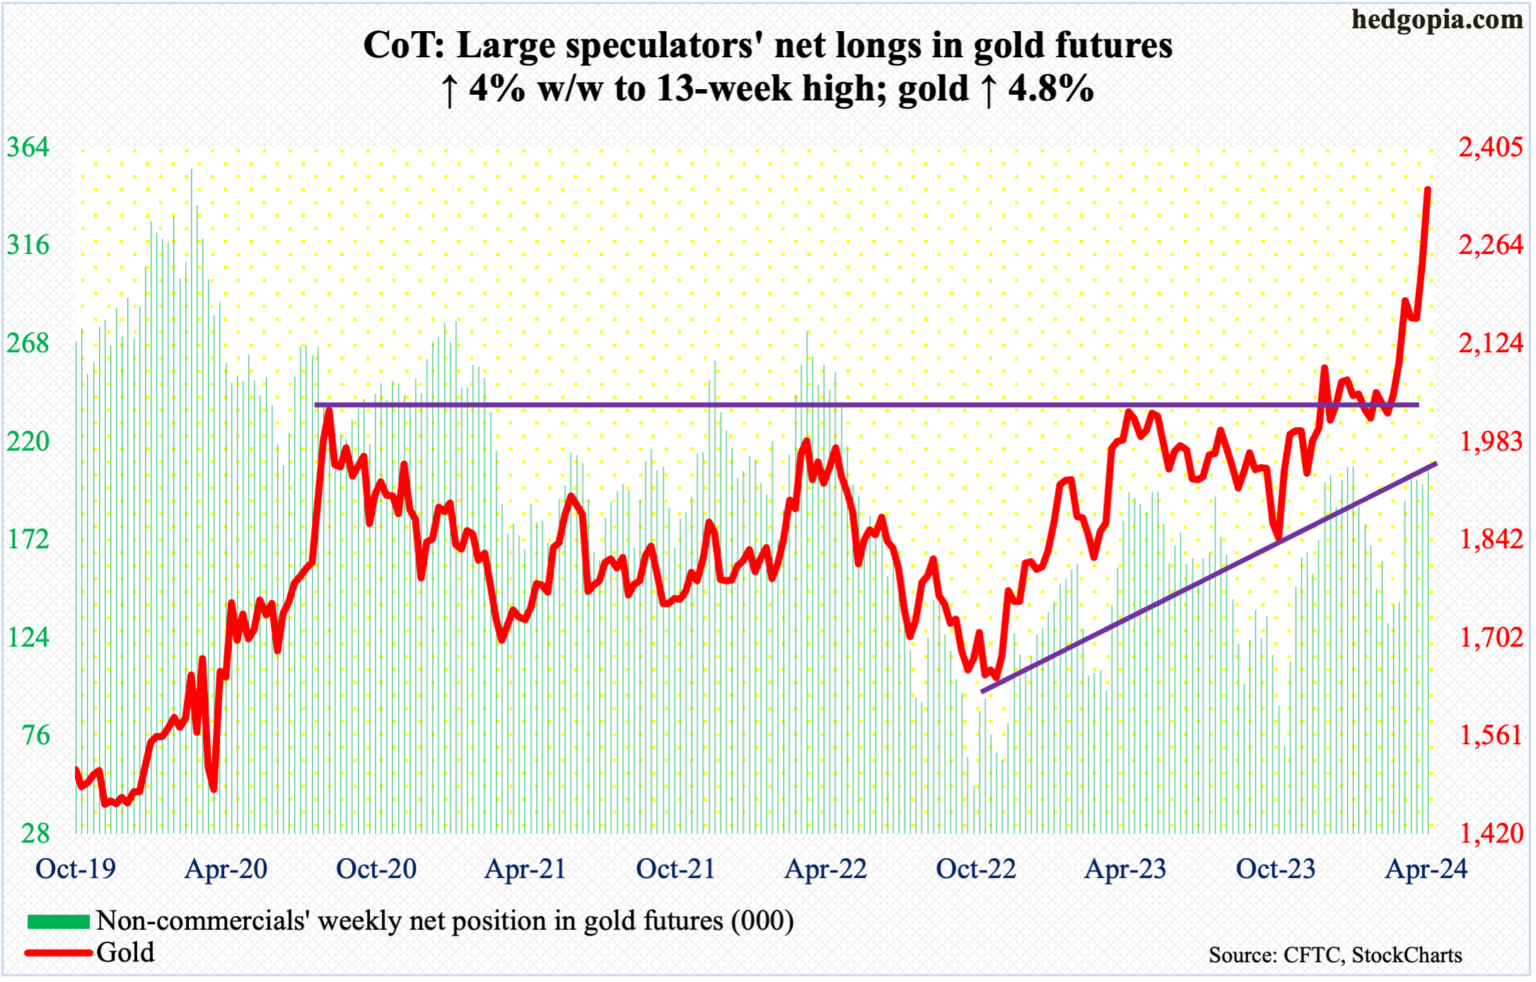
Gold bottomed at $1,824 last October. Friday, it ticked $2,350 intraday with a close of $2,345/oz – both new highs.
The rally shifted into a higher gear after the metal broke out of $2,080s, which was touched the first time in August 2020, early last month. At some point, breakout retest will occur. But the way the rally has unfolded, there is support before that happens, with the nearest at $2,240s.
Amidst this, non-commercials, who have been adding to net longs the last several weeks, could be tempted to show some aggression. If this scenario pans out, gold bears will be forced to wait before the overbought condition the metal is in gets unwound. The daily RSI closed this week at 82.7 and the weekly at 76.5.
Read Full Story »»»
DiscoverGold
NY Gold Futures »» Weekly Summary Analysis
By: Marty Armstrong | April 6, 2024
NY Gold Futures closed today at 23454 and is trading up about 13% for the year from last year's settlement of 20718. Up to this moment in time, this market has been rising for 5 months going into April suggesting that this has been a bull market trend on the monthly time level which has been confirmed by electing all of our model's long-term Bullish Reversals from the key low. As we stand right now, this market has made a new high exceeding the previous month's high reaching thus far 23500 while it has not broken last month's low so far of 20470. Nevertheless, this market is still trading above last month's high of 22569.
ECONOMIC CONFIDENCE MODEL CORRELATION
Here in NY Gold Futures, we do find that this particular market has correlated with our Economic Confidence Model in the past. The Last turning point on the ECM cycle low to line up with this market was 2022 and 2015. The Last turning point on the ECM cycle high to line up with this market was 2020 and 2011 and 1996.
MARKET OVERVIEW
NEAR-TERM OUTLOOK
The NY Gold Futures has continued to make new historical highs over the course of the rally from 2015 moving into 2024. However, this last portion of the rally has taken place over 9 years from the last important low formed during 2015. Distinctly, we have elected four Bullish Reversals to date.
This market remains in a positive position on the weekly to yearly levels of our indicating models. Pay attention to the Monthly level for any serious change in long-term trend ahead.
The perspective using the indicating ranges on the Daily level in the NY Gold Futures, this market remains moderately bullish currently with underlying support beginning at 23019.
On the weekly level, the last important high was established the week of April 1st at 23500, which was up 7 weeks from the low made back during the week of February 12th. So far, this week is trading within last week's range of 23500 to 22491. Nevertheless, the market is still trading upward more toward resistance than support. A closing beneath last week's low would be a technical signal for a correction to retest support.
When we look deeply into the underlying tone of this immediate market, we see it is currently still in a semi neutral posture despite declining from the previous high at 23500 made 0 week ago. This market has made a new historical high this past week reaching 23500. Here the market is trading positive gravitating more toward resistance than support. We have technical support lying at 22800 which we are still currently trading above for now.
Right now, the market is above momentum on our weekly models hinting this is still bullish for now as well as trend, long-term trend, and cyclical strength. Looking at this from a wider perspective, this market has been trading up for the past 7 weeks overall.
INTERMEDIATE-TERM OUTLOOK
YEARLY MOMENTUM MODEL INDICATOR
Our Momentum Models are declining at this time with the previous high made 2020 while the last low formed on 2023. However, this market has rallied in price with the last cyclical high formed on 2023 and thus we have a divergence warning that this market is starting to run out of strength on the upside.
Interestingly, the NY Gold Futures has been in a bullish phase for the past 16 months since the low established back in November 2022.
Critical support still underlies this market at 19860 and a break of that level on a monthly closing basis would warn that a sustainable decline ahead becomes possible. Nevertheless, the market is trading above last month's high showing some strength.
DiscoverGold
Gold Surge to New Record Highs
By: Bruce Powers | April 5, 2024
• Gold turns back up following earlier weakness on Friday, subsequently reaching new record highs.
Gold turns back up and reaches new record highs following a pullback earlier in Friday’s session. The initial pullback provided a weakening signal on a break below yesterday’s low of 2,280 before buyers took back control to drive prices to new highs. Gold continues to trade near the highs of the day and is on track to close at a new record closing high. At the time of this writing the high of the day was 2,230.
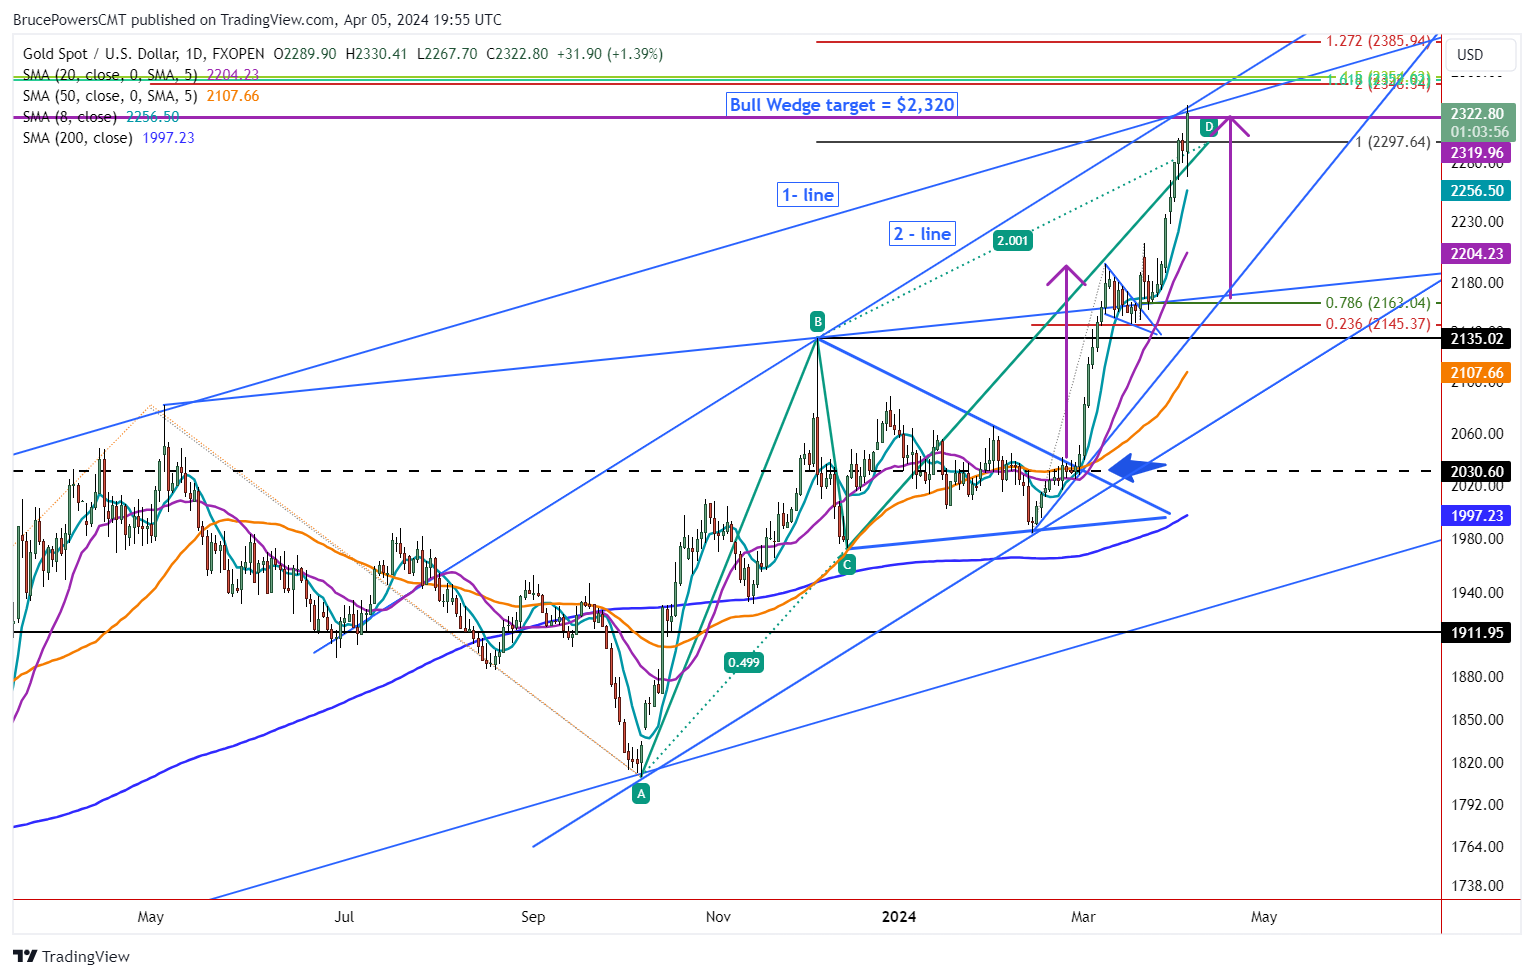
Bull Wedge Target Complete
Today’s advance reached the target from the bullish wedge breakout at 2,320. At that point gold entered a resistance zone that also includes two trendlines, each is a top channel line of a different rising parallel trend channel. So, there are two trendlines and the target from the wedge pattern culminating in the 2,320 to the 2,330-price zone, approximately.
Maybe gold busts right through the zone and keeps rising. However, it also increases the chance that gold is close to at least a temporary high. If weakness follows today’s high, then there is a chance that this resistance zone is stopping the ascent for now.
New Highs Next Week Could See Gold at 2,348
Also, a decisive breakout above today’s high and a continuation higher has gold possibly rising to the next higher target zone. That is at the confluence of several Fibonacci extension levels that identify a price range from 2,348 to 2,355. The range includes the 161.8% Fibonacci extension of the retracement from the full downswing that occurred from the March 2022 swing high, at 2,352.
Overdue for a Retracement, Yet Remains Strong
There is a solid argument that gold is extended and overdue for a retracement, yet it keeps on climbing. It is set to close strong for the week, near the highs, further confirming the strength of a long-term base breakout that triggered last month. It was a three-and-a-half-year base where gold traded within a large relatively sideways price range.
The close for the month was the highest monthly closing price ever. Several earlier attempts had failed to follow through. Certainly, the current breakout is showing no signs of failure so far. However, as noted above, it is in a decision zone that could lead to a pullback. It could get tricky though as a drop below today’s low of 2,268 would be needed for a weakening signal on the daily time frame.
Read Full Story »»»
DiscoverGold
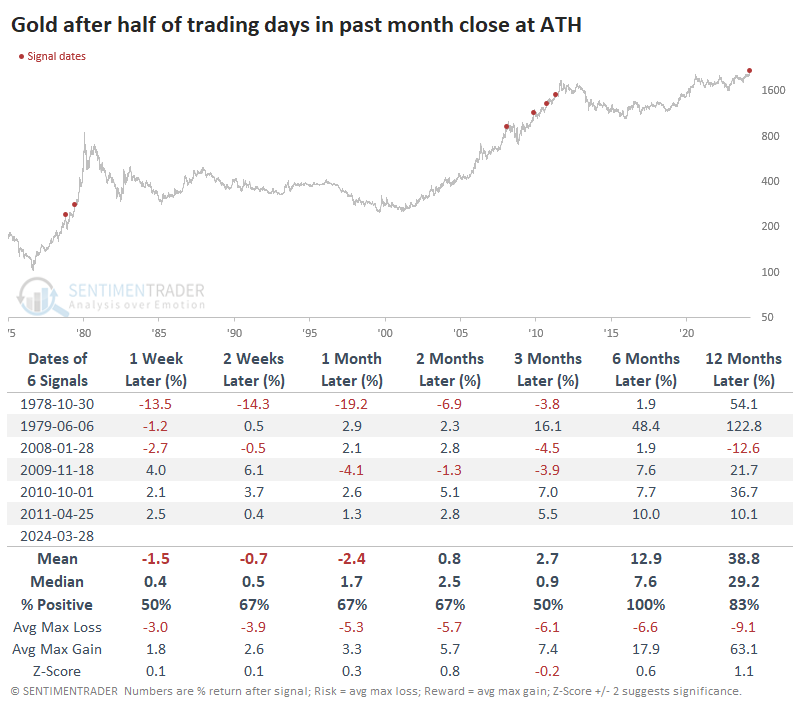
Gold closed at an all-time high on more than half of all trading days over the past month
By: Jason Goepfert | April 3, 2024
• Gold closed at an all-time high on more than half of all trading days over the past month.
None of its prior surges coincided with meaningful peaks. It was higher six months later each time.
Read Full Story »»»
DiscoverGold
Gold-Stock Upside Targets 2
By: Adam Hamilton | April 5, 2024
The gold miners’ stocks are building steam, enjoying mounting upside momentum with gold powering to nominal record highs. Speculators and investors alike are taking notice of this high-potential sector that has long been overlooked. Despite their recent surge, gold stocks remain very undervalued relative to the metal that drives their profits. Their technicals and fundamentals argue for much-higher stock prices ahead.
Over the past five weeks or so, gold has blasted higher in a magnificent breakout rally! It was born as March dawned when a top Fed official hinted at more quantitative-easing Treasury monetizations. Gold shot up 2.0% that day to its first nominal record close since late December, and has achieved a dozen more since. Midweek gold was challenging $2,300, and its total upleg since early October had grown to 26.3%!
Who could’ve seen this coming? Me. The very day after gold bottomed under $1,820, I wrote an essay on gold’s violent breakdown. My contrarian conclusion fighting universal bearishness was, “...gold’s latest plunge was driven by massive gold-futures selling, leaving speculators’ positioning exceedingly-bearish. These super-leveraged traders have probably about exhausted their capital firepower available for selling.”
“That guarantees huge mean-reversion short-covering buying is imminent, which will catapult gold sharply higher.” How high? While most other analysts were forecasting gold to keep grinding lower, I wrote “Yet gold can easily surge 20% to 25% out of excessively-bearish spec gold-futures positioning like today on stage-one and stage-two buying alone!” Those are respectively short-covering buying and long buying.
That’s exactly what happened, as I detailed in a late-February essay on gold futures being reloaded. But while gold has been the belle of the ball, gold stocks have acted like ugly stepsisters. At best since early October, the leading GDX gold-stock ETF has merely rallied 27.9%. That’s appalling, not even 1.1x upside leverage to gold! Normally GDX’s major gold miners tend to amplify material gold moves by 2x to 3x.
The gold stocks have languished and lagged their metal for a variety of reasons, which I explored in an early-March essay. The day before I wrote that one, GDX had plunged to $25.79 which was actually a little under its early-October low of $25.91! Major gold stocks had slumped 0.5% during a 4.8-month span where gold had surged 11.7% higher. While bearish market anomalies feel bad, they offer great opportunities.
Extreme disconnects never last long, soon mean reverting to restore normal relationships. Over the last five weeks or so, GDX has rallied a sizable 28.5% leveraging gold’s parallel surge by 2.2x. Naturally that is working wonders for sentiment, rekindling bullishness and attracting in more traders. As they chase these mounting gold-stock gains, this sector’s outperformance relative to its underlying metal will grow.
This chart looks at GDX technicals over the past few years or so. The last time I ran it in early March, this dominant sector benchmark was right at that anomalous pre-gold-upleg low. But gold stocks have started to surge with gold since, achieving some nice gains. Yet GDX is still only about halfway up into its secular uptrend, still having massive room to mean revert higher. Much bigger gold-stock gains are still coming.

Gold stocks remind me of a great Easter sermon my pastor just gave at church focusing on Thomas the Apostle. After Jesus was crucified, Thomas’s world came crashing down. He heard the impossible news of Jesus’s resurrection, but remained skeptical. John’s gospel records Thomas saying “Unless I see the nail marks in his hands and put my finger where the nails were, and put my hand into his side, I will not believe.”
Forever branded Doubting Thomas for that, he was more of a realist. He wanted some real evidence that Jesus had risen, and soon got it as Jesus visited and spoke with him. Right then Thomas believed, and went on to do many great works including spreading the gospel to India. Gold stocks have been out of favor so long they may as well be rising from the dead! So traders want hard evidence before believing this is real.
GDX surging nearly 30% in just over a month is starting to convince skeptics. The hardline bearishness on this sector that has festered for years is softening, with bullish green shoots sprouting up. In markets, buying begets buying. Traders lover chasing winners to ride their upside momentum. The higher and longer anything rallies, the more capital it attracts accelerating its gains. Doubt quickly transforms into belief.
Gold stocks’ violent upside potential has largely been forgotten in recent years. GDX has enjoyed some modest-to-decent uplegs since 2021, clocking in at +28.4%, +41.4%, +52.1%, and +34.4%. Those are alright, but nothing to write home about. Averaging 39.1% gains, they really weren’t compelling enough to overcome the challenges of contrarian trading. But go back just one more year, and everything changes...
* * *
Read Full Story »»»
DiscoverGold
Gold ABCD Pattern Completion and Potential Retracement
By: Bruce Powers | April 4, 2024
• Gold's rally pauses near 2,305, signaling potential pivot point and retracement ahead after completing ABCD pattern.
Gold stalled near trend highs today following a brief new record high of 2,305 reached earlier in Thursday’s trading session. It is on track to close in the red for the day but retains a series of higher daily highs and higher lows. Near-term support is at the day’s low of 2,283. If broken to the downside, a further retracement may be seen.
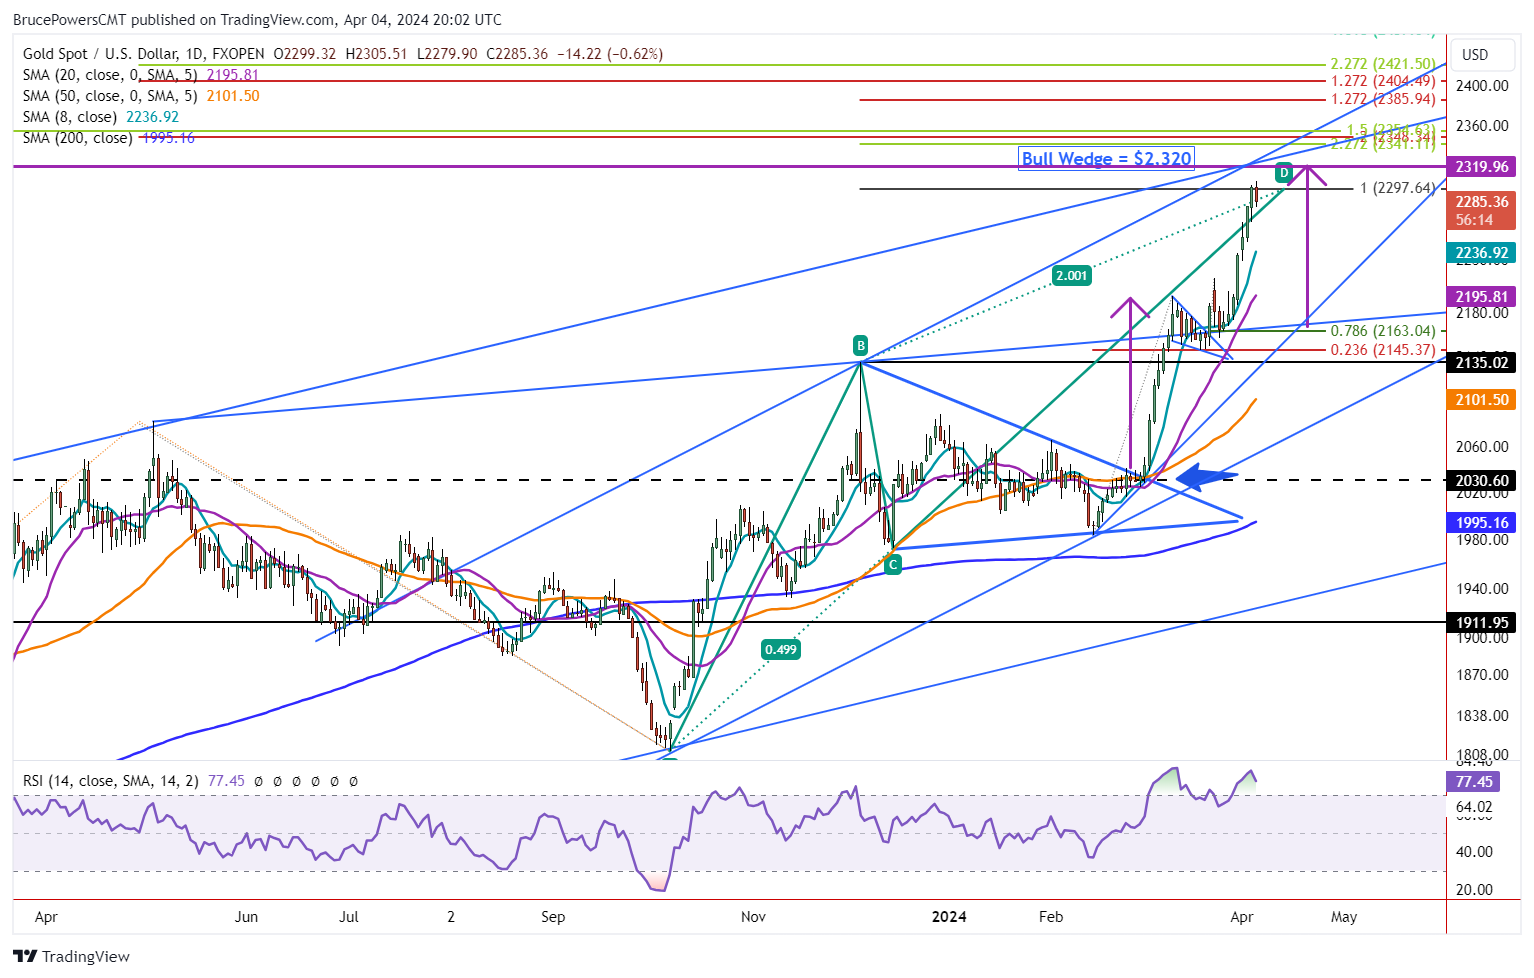
Pattern Target Reached
A key target of 2,298 was reached on Wednesday and today’s stall indicates the market seems to be aware of the price level. It completes the CD leg of a large rising ABCD pattern that reflects price symmetry with the AB leg of the pattern. The pattern begins from the swing low last October. As of today’s high, gold was up by 494 points or 27.3% from that low.
Also, it was up by 372 points or 13.6% from the recent symmetrical triangle breakout day low from February 29. Given the long-term nature of this pattern, gold has reached a potential pivot level that could lead to a retracement and end the current sharp advance, at least for the near-term. This doesn’t mean it will do that, just that it is at a decision point.
Next Higher Target is 2,320
Moreover, an advance above today’s high of 2,305, at the time of this writing, indicates the next higher target zone may be reached in the current advance. It comes in a little higher at 2,320. That target is identified as the initial target from the recent bullish falling wedge correction that ended with a minor swing low on March 18. It can be thought of as a measured move. The measured moves are marked with rising purple arrows.
Support Levels if Pullback Triggers
If a correction begins it could be a short term or longer retracement. Some potential support levels to watch include this week’s low at 2,228, followed by the most recent swing high and top of the wedge of 2,195. We may also see a similar pullback to what happened during the two-week correction that formed the falling wedge. It wouldn’t be surprising given the long-term base breakout that confirmed last week.
Read Full Story »»»
DiscoverGold
I’ll figure it out!!
What will Happen if a Squeeze Silver to $1000/oz & What will you do with all YOUR Silver?
Gold Set to Close at New High, Higher Targets in Sight
By: Bruce Powers | April 2, 2024
• Gold's rally continues, with prices set to close at new highs, indicating strong demand and potential for further upside.
Gold reached the 2,277-target zone today on a new trend high. This is the fifth day up for gold and it is set to close at a new record high again today, Tuesday. Momentum remains strong and although there might be a pause before prices move higher, demand should remain strong to help drive gold to higher targets.
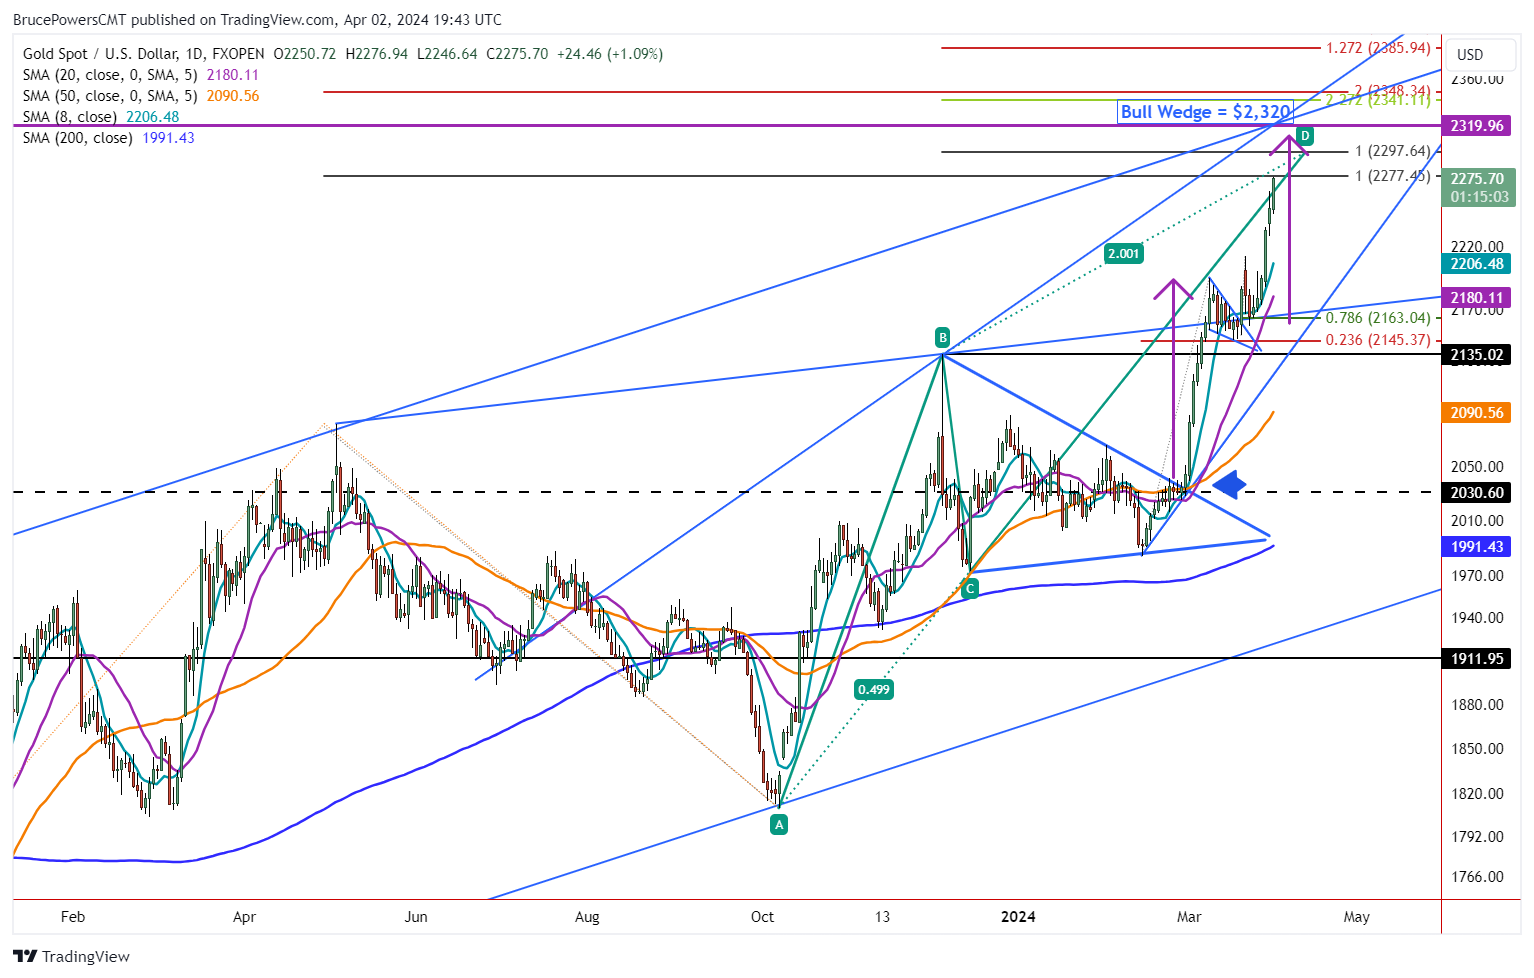
Strong Bullish Breakout Led the Way
Note that there was a strong rally of 167 points or 8.2% that occurred in a short seven-day period prior to the most recent correction. The correction took the form of a bullish falling wedge. Once the sharp advance began it triggered a breakout of a symmetrical triangle pattern. In addition to the bullish breakout of the triangle there were several other indications that the move may have greater power than might be expected.
Price Level that Began Base Shows Again at the End
Look at the dashed black line at the triangle breakout area. It marks the resistance level seen at a prior record high from August 2020 at 2,031. That was the beginning of a multi-year basing pattern. It was just completed last week as the breakout of that pattern was confirmed by a new monthly record closing high of 2,233.
The longer the base, the bigger the potential advance out of that base. Moreover, three moving averages converged around the breakout zone with the 50-Day MA being the most significant. You can see how the 50-Day line was almost an exact match for the downtrend line that defines the upper boundary of the triangle.
Wedge Target Shows 2,320
When calculating a measuring objective from the pattern as would be done with a bull flag or bull pennant, a potential target of around 2,320 is indicated. That looks to be where gold is currently heading before a longer and more significant correction or consolidation kicks in. Nevertheless, caution is always warranted as getting targets right is one of the more difficult components of analysis. A daily close above today’s high of 2,277 (currently) will provide the next confirmation of strength that could lead to a continuation higher.
Read Full Story »»»
DiscoverGold
$GLD up +7.86% YTD. The golden chalice breakout is off to a stellar start
By: TrendSpider | April 1, 2024
• The golden chalice breakout is off to a stellar start.
$GLD up +7.86% YTD.

Read Full Story »»»
DiscoverGold
Gold Forecast: Gold Cycles Higher, Key Peak Forming
By: Jim Curry | March 31, 2024
From my prior article from mid-March, Gold had broken out to the upside - but was in the midst of a smaller-degree dip, a move expected to end up as countertrend. This was the case, with the metal having broken on back to higher highs for the swing, as favored. While higher numbers should still be in the cards near-term, Gold is setting up for its next key price top.
Gold's 72-Day Cycle
The last low of significance came with our 72-day time cycle, which bottomed back in mid-February of this year. From that low, we were expecting a sharp rally to play out, which we are currently in. Here again is our 72-day cycle in the Gold market:
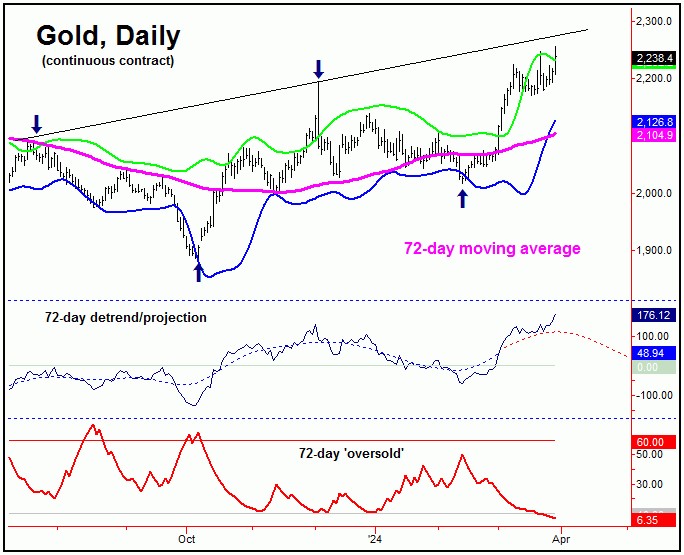
This 72-day cycle component was projected to bottom into the late-January to mid- February region - as shown by our 72-day detrend indicator, which is still pointing slightly higher at the present time.
In terms of time, the average rally phases with this 72-day cycle were noted as having taken 39 trading days before topping, which suggested the potential for higher highs into early-April or later. I mentioned then, the potential for a push up to the 2230-2260 region (for the April contract) - which the recent action has now satisfied.
With the price assumptions having already been met - and with the time assumptions drawing near - we will be on the lookout for the next peak for this cycle. Once this 72-day wave does top out, we should see a decent correction playing out in the weeks to follow, one which is something in the range of 8-10% off the highs - with the 72-day moving average providing a normal magnet.
In terms of price, we look to our downside 'reversal points' to tell us when this 72-day wave has topped. As of the current writing, the next downside reversal point figure has yet to materialize - but should soon develop - and will be posted in real-time in our thrice-weekly Gold Wave Trader market report.
Technical Considerations
With the recent break to higher highs in Gold, we like to look at any technical signs of a peak forming, with the first of these coming from our Gold Timing Index, shown on the middle pane of the chart below:
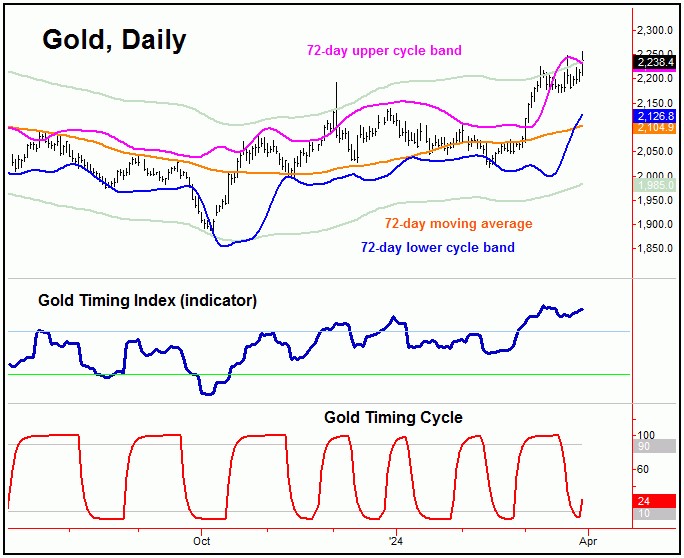
With the above, our Gold Timing Index is well above its upper reference line of 100, and is something we might expect to see at a peak with our 72-day wave. Having said that, it is too early for this wave to actually top out, and thus this will be more critical the further we move past the first week or so of April.
On the lower pane (in red) we have a new Gold cycle indicator. When this indicator drops below its lower reference line, we would expect the metal to be closer to a bottom - and thus a short-term 'buy' signal. This occurred on Monday of last week, with Gold closing that day at the 2198.20 figure (June, 2024 contract).
With the above said and noted, a push back above the upper reference line with our Gold cycle indicator - if seen in the days ahead - would be viewed as a short-term 'sell' signal for Gold, in light of the position of our (aforementioned) 72-day time cycle.
Gold's Bigger Picture
From the comments made in past articles, the overall assumption favored Gold to be in the midst of a 20%+ rally off the October, 2023 bottom, coming from our next larger wave, the 310-day component:
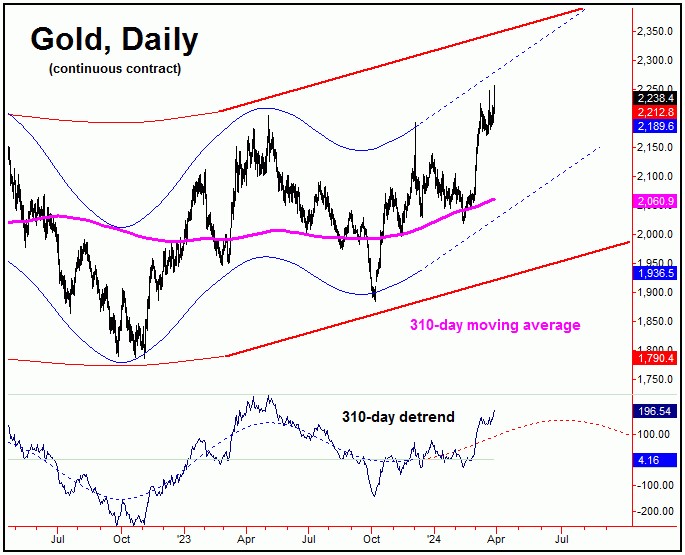
As mentioned, our 310-day cycle last bottomed back in October of 2023, and with that has been seen as pushing higher into late-Spring to early-Summer of this year. In terms of price, I have mentioned in past articles the potential for Gold to reach up to the 2270-2300 region, simply based upon the average (20%) rallies with this wave.
Stepping back then, a 72-day cycle top in April - if seen as noted - would be favored to give way to a countertrend correction in the weeks to follow, one that remains well above the February trough for this wave. If correct, what follows should be another sharp rally of some 10-14% playing out on the next 72-day cycle upward phase.
Read Full Story »»»
DiscoverGold
Jack Chan: Gold Price Exclusive Update
By: Jack Chan | March 30, 2024

Our proprietary cycle indicator is UP.
To public readers of our updates, our cycle indicator is one of the most effective timing tool for traders and investors. It is not perfect, because periodically the market can be more volatile and can result in short term whipsaws. But overall, the cycle indicator provides us with a clear direction how we should be speculating.
Investors
Accumulate positions during an up cycle and hold for the long term.
Traders
Enter the market at cycle bottoms and exit at cycle tops for short term profits.

GLD is on short term buy signal.

GDX is on short term buy signal.

XGD.to is on short term buy signal.

GDXJ is on short term buy signal.
Analysis

Our ratio is on a new buy signal.

Trend is UP for USD.

Trend is UP for gold stocks.
Trend is UP for gold.

A double bottom in this long term ratio between gold and gold stocks suggests that gold stocks may begin to outperform and play catch up soon.
Gold has broken out firmly and has no overhead resistance.
Summary
Gold sector cycle is up.
Trend is up for gold and gold stocks..
$$$ We are partially invested for the current up cycle.
Read Full Story »»»
DiscoverGold
Gold CoT: Peek Into Future Through Futures, How Hedge Funds Are Positioned
By: Hedgopia | March 30, 2024
• Following futures positions of non-commercials are as of March 26, 2024.
Gold: Currently net long 199.3k, down 2.3k.
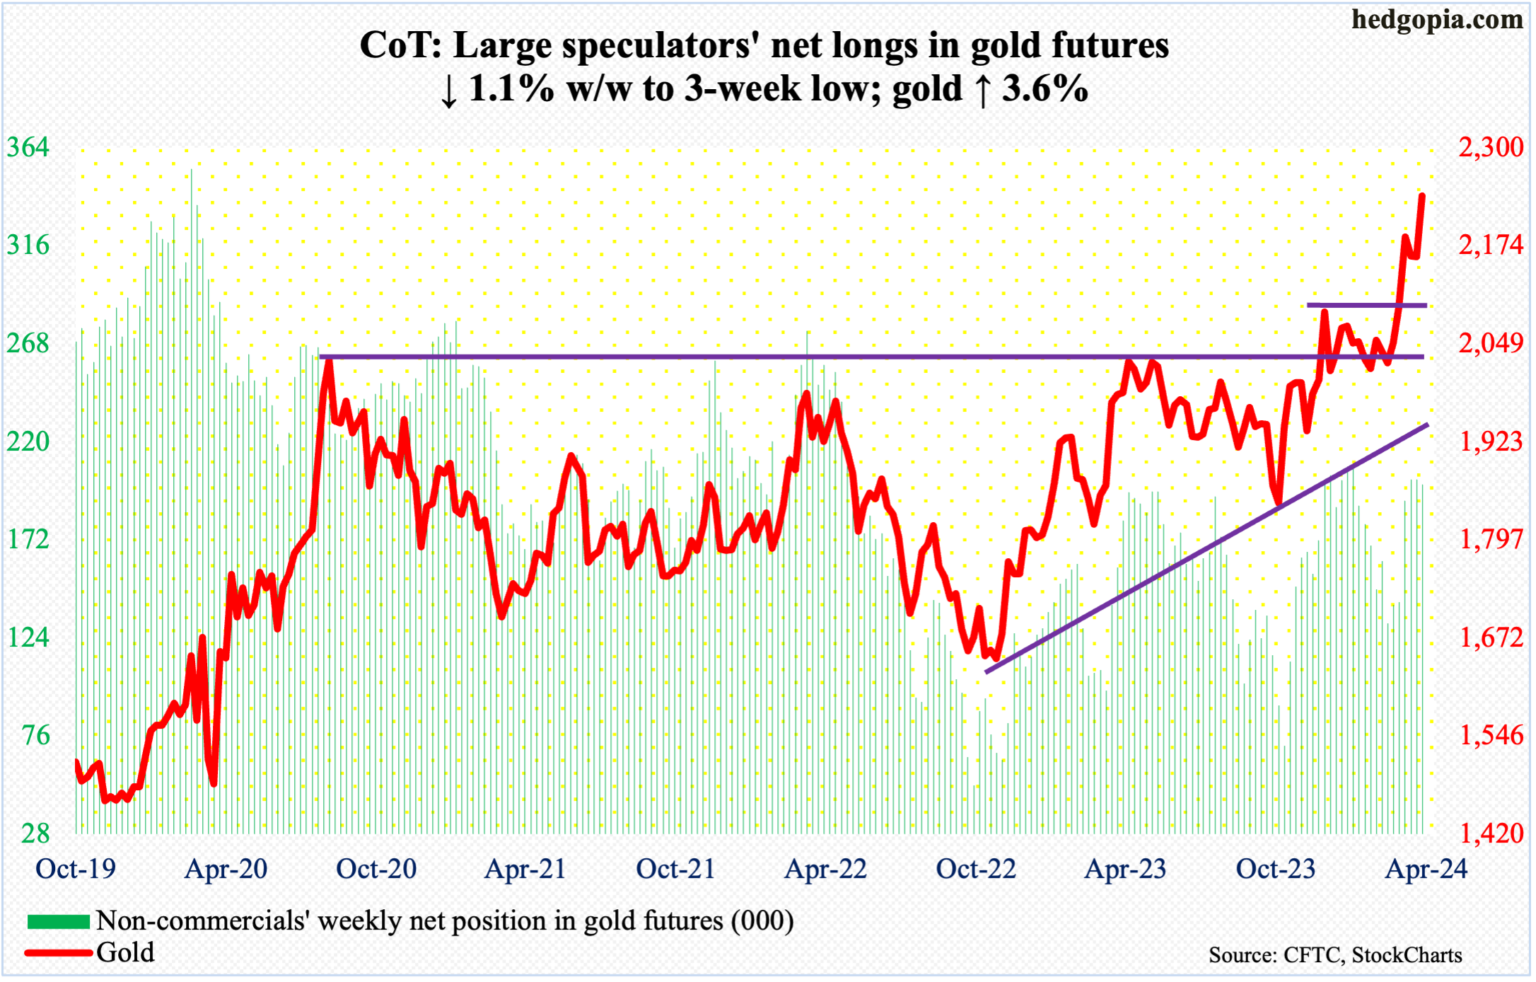
In a holiday-shortened week, gold rallied in all four sessions. By Friday, it surpassed the March 25th high of $2,225 to rally 3.6 percent for the week to $2,238, with the metal ticking $2,247/ounce. Last week’s potentially bearish gravestone doji has been negated.
Monday’s intraday low of $2,164 came just above horizontal support at $2,150s, which was the high from early December. The yellow metal has come a long way from last October when it bottomed at $1,824.
At some point, successful breakout retest at $2,080s is the path of least resistance – and probably healthy for gold bugs. Since August 2020, when $2,080s was hit the first time, rally attempts stopped at that price point several more times, including in March 2022 ($2,079), May last year ($2,085) and a few more times this year. The 50-day has now risen to $2,089.
Read Full Story »»»
DiscoverGold
NY Gold Futures »» Weekly Summary Analysis
By: Marty Armstrong | March 29, 2024
NY Gold Futures closed today at 22384 and is trading up about 8.04% for the year from last year's settlement of 20718. Up to now, this market has been rising for 2 years going into 2024 reflecting that this has been only still a bullish reactionary trend. As we stand right now, this market has made a new high exceeding the previous year's high reaching thus far 22569 while it is still trading above last year's high of 21523.
Up to now, we still have only a 2 month reaction decline from the high established during December 2023. We must exceed the 3 month mark in order to imply that a trend is developing.
MARKET OVERVIEW
NEAR-TERM OUTLOOK
The NY Gold Futures has continued to make new historical highs over the course of the rally from 2015 moving into 2024. However, this last portion of the rally has taken place over 9 years from the last important low formed during 2015. Clearly, we have elected four Bullish Reversals to date.
This market remains in a positive position on the weekly to yearly levels of our indicating models. Pay attention to the Monthly level for any serious change in long-term trend ahead.
Solely focusing on only the indicating ranges on the Daily level in the NY Gold Futures, this market remains in a bullish position at this time with the underlying support beginning at 22253.
On the weekly level, the last important high was established the week of March 18th at 22253, which was up 5 weeks from the low made back during the week of February 12th. So far, this week is has moved to the upside exceeding last week's high of 22253 reaching 22569. A closing above last week's high would be a technical signal that the advance is still in motion just yet. This makes the current rally 1 weeks to date. .
When we look deeply into the underlying tone of this immediate market, we see it is currently still in a semi neutral posture despite declining from the previous high at 22253 made 0 week ago. Still, this market is within our trading envelope which spans between 19857 and 21663. This market has made a new historical high this past week reaching 22253. We have exceeded that high suggesting the market is still pushing upwards.
Right now, the market is above momentum on our weekly models hinting this is still bullish for now as well as trend, long-term trend, and cyclical strength. Looking at this from a wider perspective, this market has been trading up for the past 5 weeks overall.
INTERMEDIATE-TERM OUTLOOK
Looking at the longer-term monthly level, we did see that the market made a high in December 2023 at 21523. After a thirteen month rally from the previous low of 19879, it made last high in December. Since this last high, the market has corrected for thirteen months. However, this market has held important support last month. So far here in March, this market has held above last month's low of 19964 reaching 20470.
Critical support still underlies this market at 19070 and a break of that level on a monthly closing basis would warn that a sustainable decline ahead becomes possible. Nevertheless, the market is trading above last month's high showing some strength.
DiscoverGold
Gold New Record High, Bullish Momentum Continues
By: Bruce Powers | March 28, 2024
• Gold's breakout above 2,212 record high sets the stage for further gains, with a measured move from a bullish wedge breakout targeting around 2,320.
Gold broke out to new record highs on Thursday as it triggered an inside day breakout followed by a rise above the previous record high of 2,212. This clears the way for gold to accelerate to the upside as the bullish wedge breakout follows through. In addition to the new high breakout gold is on track to close strong, in the upper quarter of the day’s range, setting the stage for a continuation of the advance. At the time of this writing the high for the day was 2,225.

Prior Sharp Rally Helps Sets the Stage for Higher Prices
An advance of 8.2% occurred prior to the recent retracement begun from the 2,195-swing high (first rising purple arrow). Momentum began to improve following the breakout of a large symmetrical triangle consolidation pattern. The retracement off the 2,195 high took the form of a falling wedge, which is a bullish pattern. A breakout triggered last week and was followed by a retracement from the previous 2,212 peak. Today, we get confirmation for the bull trend with a rally and likely close above the prior record high.
Initial Upside Target of 2,320
The rally prior to the wedge establishes a measured move that can be used to establish a price target from the wedge breakout. A similar swing (second rising purple arrow) from the wedge breakout would put gold around 2,320. Earlier targets include 2,298, which is the target from a large rising ABCD pattern that began from the October 2023 swing low (A). Given that these two targets are above the Fibonacci targets highlighted in red on the chart, it seems likely that they would be exceeded to the upside.
The Fibonacci levels are either projections or extensions of previous swings. Also, note that a top parallel channel line has been added to the chart by duplicating the lower rising trendline and placing it at the top of the December swing high (B). It may assist in assessing higher targets.
Strong Monthly Close to Confirm Long-term Strength
March is coming to an end and gold is set to finish the month at its highest monthly closing price ever. It will provide a new confirmation of strength for the multi-year breakout that is continuing to advance with enthusiasm. A new record monthly close will provide additional credibility to the current advance and should assist in improving demand as the word get out.
Read Full Story »»»
DiscoverGold
Gold Bullish Behavior Points to Continued Upside
By: Bruce Powers | March 27, 2024
• Gold's resilience and bullish behavior suggest further gains, with key support levels and potential upside targets identified.
Although gold closed relatively weak on Tuesday, it has again successfully tested the 8-Day MA today (Wednesday) as support and bounced. It has found support around the 8-Day line for four of the past five days. Currently, gold is trading inside day, and it is up from the open with a green candle.

Further Signs Retracement Complete
The recent retracement from the new 2,212 record high hit last week found support at a low of 2,157 last Friday. In addition to the area around the 8-Day line denoting support, the 2,157 low was also at the 78.6% Fibonacci retracement and a top trendline beginning from the swing high on May 1. The relationship with the top trend line shows the market recognizing the price zone represented by the line. This is bullish behavior in an uptrend as prior resistance is now being shown as support. The way should be clear for gold to continue its ascent.
Breakout Signal Above 2,200
Nevertheless, a signal is needed to confirm the bullish thesis. That will be provided on a decisive breakout above yesterday’s high of 2,200. A slightly earlier sign will be given on an advance above today’s high of 2,198.
Gold Remains Above Previous Record High
Gold continues to trade in new high territory above the prior record high of 2,135 from December 4. And it has remained strong enough to not fall back to test that price area as support. In the near-term, it is working on following through from the bullish breakout of a small wedge pattern. When taking into consideration the sharp advance that proceeded the wedge consolidation, a potential upside target can be calculated. The sharp advance began upon the breakout of a large symmetrical triangle pattern on February 29. Counting from that day’s low, a sharp 8.2% six-day advance followed. A similar rise following the wedge breakout would put gold up at 2,320.
Pullback Complete
The first pullback following the wedge breakout last Wednesday should now be complete. But, as noted above, there needs to be another bullish confirmation signal. Once that triggers gold should be heading into two initial potential target zones. The first begins at 2,235 and the second at 2,277. A large rising ABCD pattern completes at 2,298, and as noted above the wedge pattern target 2,320.
Read Full Story »»»
DiscoverGold
Gold $GLD - Poppin. Watching for a Qtrly B/Out of the 'Cup & Handle' Plot...
By: Sahara | March 27, 2024
• ... $GOLD $GLD - Poppin
Watching for a Qtrly B/Out of the 'Cup & Handle' Plot...

Read Full Story »»»
DiscoverGold
What a sham
They are manipulating gold so bad they’re afraid for it to get over $2220 they slam it down
Keep buying my friends
By physical gold
Gold Bullish Reversal Signals Potential Upside Breakout
By: Bruce Powers | March 26, 2024
• Technical analysis indicates a potential bullish breakout in gold, with initial targets at 2,235-2,246 and 2,277-2,298 based on Fibonacci confluence.
Gold triggers a bullish reversal today as it breaks out from the inside day established on Monday on a rise above 2,181. A daily close above that high is needed next to confirm the reversal. The reversal is a bullish continuation from the minor retracement low of 2,157 established last Friday. It follows a rally from a bullish wedge breakout that occurred last Wednesday. After two days up, however, resistance was seen at 2,212 leading to last week’s pullback low.

Near-term Support at 2,168
Near-term support is at today’s low of 2,168. If it is busted to the downside the chance for a deeper retracement from the 2,212 high increases. However, the 2,157 area may still offer support. If it does and leads to a bullish reversal, further upside may be forthcoming. Moreover, if the 2,157 level is busted to the downside, a deeper retracement is likely in the works and the bullish wedge is at risk of failure.
Upside Targets
Price behavior following the bullish wedge has not been as strong as it might be as upward momentum ended after less than two days. Nevertheless, strength starts to return, as noted above, upon a daily close above 2,181, and further still on a close above the three-day high of 2,186. Initial upside targets are highlighted on the chart and are defined by Fibonacci confluence. That is where two or more Fibonacci levels identify a similar price area. The first is from 2,235 to 2,246 and the second is from 2,277 to 2,298.
Further, the high end of the range at 2,298 is where a rising ABCD pattern reflects symmetry. That is where the price change in the CD leg of the advance reflects symmetry with the AB leg. It marks a potential pivot level.
Wedge Targets 2,320
A higher and more significant target is derived from the measuring objective of the bullish wedge. Notice that prior to the wedge forming off the March 8 high gold advanced by 211 points or 10.6% in 17 trading days. However, momentum truly ramped up starting from February 29. When using that low to high measure the advance comes in at 167 points or 8.2%. That calculation presents a 2,320 target.
Read Full Story »»»
DiscoverGold
Gold Continues to See Upward Pressure Overall
By: Christopher Lewis | March 25, 2024
• The gold markets continue to see a lot of upward momentum, as we have seen a lot of concern around the world.
Gold Markets Technical Analysis
You can see that we rallied a little bit during the early hours on Monday, as traders continue to consolidate in the same region. We are sitting right around 2175, which is an area that a lot of people are paying close attention to as we just simply work off a lot of froth from the previous shot higher.
All things being equal, this is a market that I think continues to go higher and allow the market to challenge this shooting star from last week on Thursday. That being said, I do think that this is going to continue to be a significant amount of noise in this market right around the $2,145 level, where we have significant support. So, breaking that would probably have me step away from the market and see if we can drop down towards the 50 day EMA, where I would be very interested in buying.
Pay attention to the interest rate market that will have a lot to do with where we go. If US interest rates continue to drop, that will send gold higher. On the other hand, if they start to rise, that works against gold. Ultimately, this is also a function of the geopolitical concerns that we have around the world right now. And the fact that central banks around the world are massive buyers of gold certainly gives it a little bit of a lift as well. In general, I remain a buy on the dip trader, looking for a bigger breakout eventually.
I don’t know how long it’s going to take, but I do know I want to be involved. In general, this is a situation where the market is just simply doing everything it can to push to the upside, but we may need to bring in a few more traders.
Read Full Story »»»
DiscoverGold
Gold’s Fresh Highs; Fed’s Cred Demise?
By: Mark Mead Baillie | March 24, 2024
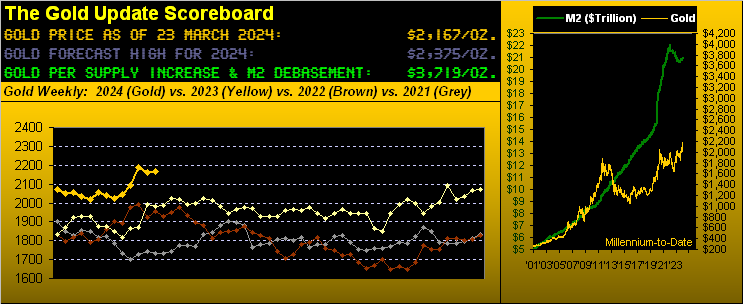
Gold recorded another series of fresh All-Time Highs this past week in eclipsing the 2203 level (from 08 March) in a swift run up to 2225 on Thursday before coming off (as we’ve written “expectedly”) in settling yesterday (Friday) at 2167. Still, given Gold’s momentum with but a week to go in Q1 of 2024, our forecasted year’s high at 2375 remains rightly reasonable.
But let us again head with the Fed, indeed query if ’tis losing its cred. Clearly that which we herein penned a week ago “…Obviously the FOMC shall unanimously vote to do nothing with its Bank’s Funds Rate…” is exactly what occurred per the Open Market Committee’s Policy Statement issued on Wednesday. Our takeaway these many years — rather than watch all the FinMedia bilge — comes from simply reading the Statement, in which for 20 March are these three key sentences:
• “The Committee seeks to achieve maximum employment and inflation at the rate of 2 percent over the longer run.”
• “The Committee does not expect it will be appropriate to reduce the target range until it has gained greater confidence that inflation is moving sustainably toward 2 percent.”
• “The Committee is strongly committed to returning inflation to its 2 percent objective.”
Yet even as inflation is ticking higher — above and beyond 2% — three FedFunds rate cuts remain on the table for the balance of 2024? What? “Curiouser and curiouser!” cried Alice…
To be sure, you’ve already seen the inflation tables we’ve presented in recent missives. So this time, let’s get graphic(!) Thus from 12 months ago-to-date (March ’23 through February ’24), below are the headline and core charts for the Consumer Price Index (CPI-retail inflation), Producer Price Index (PPI-wholesale inflation), and Personal Consumption Expenditures (PCE-Fed-favoured inflation). Note: the PCE February data points are the consensus estimates as the report is not due until next Friday, 29 March (the markets actually being closed that day). Therein: each data point is annualized per that month’s reading; each inflation track is accompanied by its dashed trendline; each panel is identically scaled; and the Federal Reserve’s 2% target level is in red. And again we say: “We’re going the wrong way”. Still, Bloomy ran this past week with “The Great Inflation Scare is Fading.” Clearly they don’t have these charts:
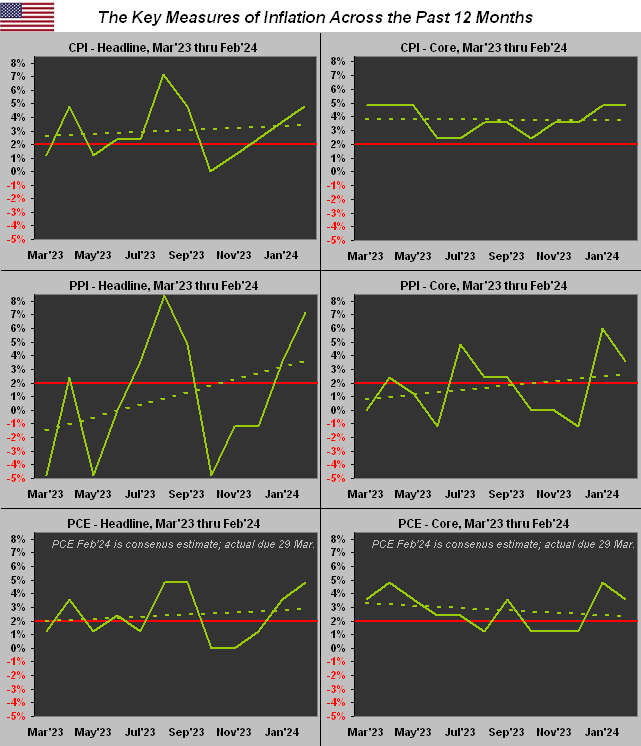
Demonstrably, the rightmost datapoint (February ’24) in every case is above the Fed’s 2% target. Moreover: most of the dashed trendlines are rising up and away from that target, the notable exception ironically being the “Fed-favoured” inflation measure of “PCE – Core”, the trend for which is admittedly nearing said 2% target. But really: three rate cuts? How about a rate hike? (Perhaps we ought apply to be on the FOMC, but the pay cut would be too dear…)
Hardly dear is dear old Gold. Its present 2167 price is -42% beneath our opening Gold Scoreboard’s Dollar-debasement valuation of 3719. So to Gold’s weekly bars we go, the rightmost blue-dotted parabolic Long trend now a young three weeks in duration in this year-over-year view:
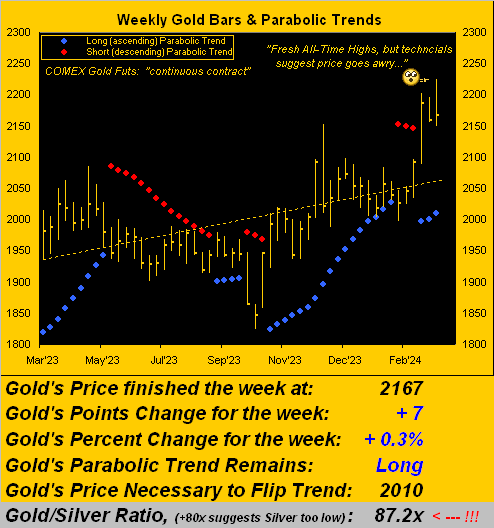
However, let us temper the rejoicing of Gold Going Great with some present technical negatives, courtesy of the “Party Pooper Dept.”, albeit with this caveat as penned a week ago: “…they’re clearly stretched to the upside, however great bull markets (or the resumption thereof) do breakout as such…” That for you WestPalmBeachers down there means Gold when technically overbought might actually be considered a good thing.
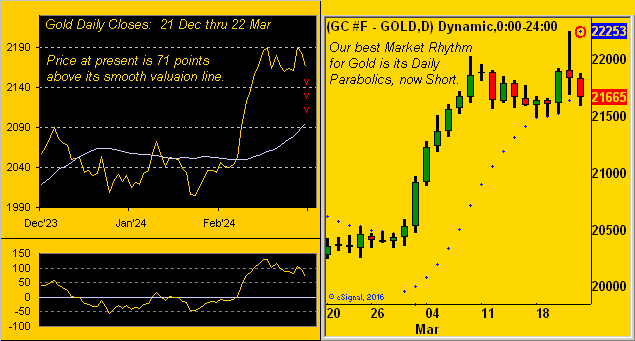
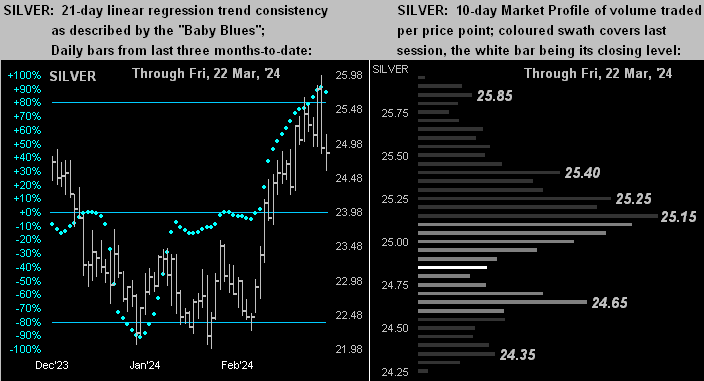
Either way, we’ve the following two-panel graphic. On the left again is Gold vis-à-vis its smooth valuation line from three months ago-to-date. Price at present is +71 points above the smooth line, the red down arrows suggestive of the eventual meeting of price with value, (that line itself on the rise; the points difference between price and value is at the foot of the panel). On the right are Gold’s daily candles across the past 21 trading days (one month) along with the Parabolics study that currently is our leading Market Rhythm for Gold: note the rightmost red-encircled dot which heralds the start of a Short trend. (Too, we’ll later see Gold’s “Baby Blues” of trend consistency suggesting lower price levels ahead). Here’s the graphic:
“So, mmb, the question becomes ‘How low is low’, eh?“
So ’tis, Squire, (barring the technicals instead catching up to price, which again in a bullish breakout is mathematically natural). Regardless, in looking above at the right-hand panel of Gold since a month ago, “The Big Move” in round numbers was +100 points from 2050 to 2150. Thus by structural support, that latter number ideally would be as low as Gold goes near-term. But with three technical negatives all simultaneously in play (price above value, Short daily parabolic trend, and as noted we’ll see, a breakdown in Gold’s “Baby Blues”), we sense 2150 shall bust, (this past week’s low having already touched 2149, but ’twas prior to Thursday’s 2225 All-Time High).
Nonetheless, does all that mean a full retracement back down to 2050 is warranted? ‘Tis dependent on buyside enthusiasm: through the 57 trading days year-to-date, Gold’s average daily COMEX contract volume is 208,633; yet for these past five days, the average is +15% higher at 240,638. We can therefore say that “Gold is in play”: however, Friday’s down day (high-to-low from 2188-to-2158) sported Gold’s largest one-day contract volume this year at 391,750, such “mo-mo suggesting more low” should dip buyers wait out more downside show. ‘Course, broadly on balance, Gold continues to look good to go with eventually higher levels to bestow.
Meanwhile, bestowed upon a needy, stagflative Economic Barometer this past week was improved data for housing. The National Association of Home Builders Index gained ground in March as did February’s readings for Housing Starts, Building Permits, and Existing Home Sales. In an otherwise light week for incoming data, the only “negative” metric was a slowing in March’s Philly Fed Index: but its result (3.2) was positive for just the fourth time in the past 22 months: “Fly, Eagles Fly”[Borrelli/Courtland, ’55]. Here’s the Baro:
Yet does stagflation still lurk for the economy? Next week for the Econ Baro we’ve 14 metrics, just seven of which are expected to show period-over-period improvement. And again, the aforementioned February PCE, along with that month’s Personal Income/Spending, are to be released on next Friday’s holiday, meaning they can’t be traded upon until Monday, April Fools Day … oh baby.
As for the Casino 500, ’tis “nuthin’ but new highs” as the stock market continues to “price in” the same news over-and-over-and-over again. Week-after-week we read of the market rising day-after-day because of “Breaking News: The Fed Will Cuts Rates Three Times This Year!” The S&P is now “textbook overbought” to the tune of 45 consecutive trading days: going all the way back to the year 1980, that streak ranks in the 98th percentile of such overbought condition. Indeed yesterday, Janus’ Bill Gross characterized today’s investing climate as “excessive exuberance”. ‘Course, Smart Alec shan’t sell his shares until he (along with everyone else) is scared, the broker then crediting his account with IOUs when the money isn’t there*. (“Pssst: Got Gold?”)
* As of 22 March ’24: S&P 500 market cap: $45.7T; U.S. liquid money supply (M2): $21.0T.
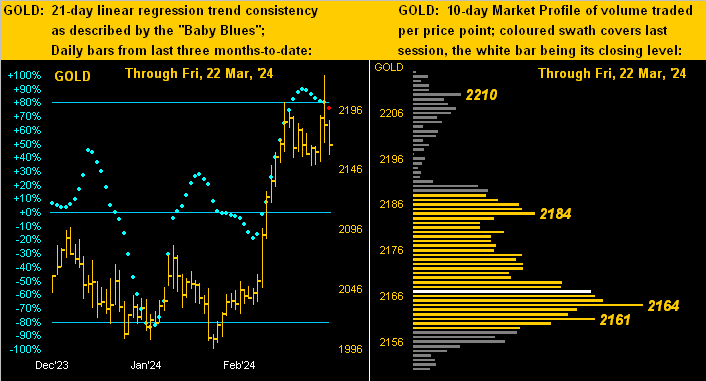
Next we’ve got more of Gold, and Silver too. Beginning with the yellow metal is our two-panel display of Gold’s daily bars from three months ago-to-date at left and 10-day Market Profile at right. Note the “Baby Blues” which depict trend consistency: we’ve actually coloured the rightmost one in red given its having dropped below the key +80 axis level. That generally leads to lower Gold levels near-term. For example: from one year ago-to-date, such “Baby Blues” slip phenomena has occurred on three occasions, the downside price movement within 21 trading days (one month) ranging from -10 points to -49 points, (i.e. were that to pan out in this case from today’s 2167 level, Gold would head down into a range between 2157 to 2118, just in case you’re scoring at home). As for the Profile, Gold is now sitting just above the trading support labeled as 2164:
For the white metal, Sister Silver’s resent sweet ascent is now being met with some dissent. With the like drill as shown for Gold, her “Baby Blues” (below left) have just kinked down, and Profile support (below right) shows at 24.65. Should Silver sustain a bit of a hit, the high 23s would likely seem fit:
To close, we’ve these few quick quips.
This past Tuesday we awoke to read that Kazuo Ueda and his mates at Nippon Ginko — for the first time in 17 years — put positive the bank’s overnight lending rate in raising it from -0.1% to a sought range of 0.0% to 0.1%. Still, it all seems rather wee, but as goes the saying: “Saké to me, Saké to me, Saké to me…”
This past Thursday with Swiss precision at 09:00 CET, Tommy Jordan and his lads at Schweizerische Nationalbank cut — without scheduled notice — both their key lending and deposit rates to 1.50%. This in turn elicited the Swiss Franc’s largest single session high-to-low drop (-1.69%) versus the Dollar in better than a year. Or how would Emmental Robin put: “Holy cheese, Batman!”
And from the “You Can’t Make This BS Up Dept.”, hardly complete would be the week without having learned from “ABC News!” that according to The World Happiness Report, the Good Old USA no longer ranks amongst the Top 20 Happiest Countries. Aw shucks. But when your nation averages some 45 murders per day (per the Kaman Law Firm), ’tis hard to be happy. Indeed, that’s America, babe: “Death and Taxes!”
Read Full Story »»»
DiscoverGold
Jack Chan: Gold Price Exclusive Update
By: Jack Chan | March 23, 2024

Our proprietary cycle indicator is UP.
To public readers of our updates, our cycle indicator is one of the most effective timing tool for traders and investors. It is not perfect, because periodically the market can be more volatile and can result in short term whipsaws. But overall, the cycle indicator provides us with a clear direction how we should be speculating.
Investors
Accumulate positions during an up cycle and hold for the long term.
Traders
Enter the market at cycle bottoms and exit at cycle tops for short term profits.

GLD is on short term buy signal.

GDX is on short term buy signal.

XGD.to is on short term buy signal.

GDXJ is on short term buy signal.
Analysis

Current data suggests a pullback/consolidation is imminent.

Current data supports an overall higher dollar.

Our ratio is on a new buy signal.

Trend is UP for USD.

Trend is DOWN for gold stocks.

Trend is UP for gold.

A similar candlestick suggests a pullback/consolidation is imminent.

A new high in gold and a lower high in gold stocks results in a divergence.

What is more alarming is that gold prices have been rallying higher since 2022 while gold stocks are struggling with lower highs.
Summary
Gold sector cycle is up.
Trend is up for USD and down gold stocks.
$$$ We are partially invested for the current up cycle.
Read Full Story »»»
DiscoverGold
Gold CoT: Peek Into Future Through Futures, How Hedge Funds Are Positioned
By: Hedgopia | March 23, 2024
• Following futures positions of non-commercials are as of March 19, 2024.
Gold: Currently net long 201.6k, unchanged.
Gold was down 0.1 percent to $2,160/ounce, but that belies the intra-week volatility. Intraday Thursday, the metal rallied as high as $2,225 to surpass the March 8th high of $2,203, but only to reverse to close at $2,185, forming a spinning top. For the week, a gravestone doji developed.
Thus far, gold bugs have defended $2,150s, which was the high from early December. Odds favor this support gives way in the sessions ahead. In an ideal scenario for the bulls, gold then heads toward $2,080s for a successful breakout retest, laying the foundation for the next leg higher.
Since August 2020, when $2,080s was hit the first time, rally attempts stopped at that price point several more times, including in March 2022 ($2,079), May last year ($2,085) and a few more times this year. The 50-day at $2,075 is rising toward that level.
The yellow metal has come a long way from last October when it bottomed at $1,824 and is itching to unwind the overbought condition it is in.
Read Full Story »»»
DiscoverGold
NY Gold Futures »» Weekly Summary Analysis
By: Marty Armstrong | March 23, 2024
NY Gold Futures closed today at 21600 and is trading up about 4.25% for the year from last year's settlement of 20718. This price action here in March is reflecting that this has been still a bearish reactionary trend on the monthly level. As we stand right now, this market has made a new high exceeding the previous month's high reaching thus far 22253 intraday and is still trading above that high of 20832.
Up to now, we still have only a 2 month reaction decline from the high established during December 2023. We must exceed the 3 month mark in order to imply that a trend is developing.
ECONOMIC CONFIDENCE MODEL CORRELATION
Here in NY Gold Futures, we do find that this particular market has correlated with our Economic Confidence Model in the past. The Last turning point on the ECM cycle low to line up with this market was 2022 and 2015. The Last turning point on the ECM cycle high to line up with this market was 2020 and 2011 and 1996.
MARKET OVERVIEW
NEAR-TERM OUTLOOK
The NY Gold Futures has continued to make new historical highs over the course of the rally from 2015 moving into 2024. However, this last portion of the rally has taken place over 9 years from the last important low formed during 2015. Prominently, we have elected four Bullish Reversals to date.
This market remains in a positive position on the weekly to yearly levels of our indicating models. Pay attention to the Monthly level for any serious change in long-term trend ahead.
Solely focusing on only the indicating ranges on the Daily level in the NY Gold Futures, this market remains moderately bullish currently with underlying support beginning at 21587 and overhead resistance forming above at 21663. The market is trading closer to the support level at this time. An opening below this level in the next session will imply a decline is unfolding.
On the weekly level, the last important high was established the week of March 18th at 22253, which was up 5 weeks from the low made back during the week of February 12th. So far, this week is trading within last week's range of 22253 to 21492. Nevertheless, the market is still trading downward more toward support than resistance. A closing beneath last week's low would be a technical signal for a correction to retest support.
When we look deeply into the underlying tone of this immediate market, we see it is currently still in a semi neutral posture despite declining from the previous high at 22253 made 0 week ago. Still, this market is within our trading envelope which spans between 19857 and 21663. This market has made a new historical high this past week reaching 22253. Here the market is trading weak gravitating more toward support than resistance. We have technical support lying at 21878 which we are currently trading below implying the market is very weak. This infers that this level will now be resistance. Our Major Channel Support lies at 20256 and a break of that level would be a bearish indication for this market.
Right now, the market is above momentum on our weekly models hinting this is still bullish for now as well as trend, long-term trend, and cyclical strength. Looking at this from a wider perspective, this market has been trading up for the past 5 weeks overall.
INTERMEDIATE-TERM OUTLOOK
YEARLY MOMENTUM MODEL INDICATOR
Our Momentum Models are declining at this time with the previous high made 2020 while the last low formed on 2023. However, this market has rallied in price with the last cyclical high formed on 2023 and thus we have a divergence warning that this market is starting to run out of strength on the upside.
Looking at the longer-term monthly level, we did see that the market made a high in December 2023 at 21523. After a thirteen month rally from the previous low of 19879, it made last high in December. Since this last high, the market has corrected for thirteen months. However, this market has held important support last month. So far here in March, this market has held above last month's low of 19964 reaching 20470.
Critical support still underlies this market at 19070 and a break of that level on a monthly closing basis would warn that a sustainable decline ahead becomes possible. Nevertheless, the market is trading above last month's high showing some strength.
DiscoverGold
Gold Price Retreats, but Bullish Wedge Breakout Holds Promise
By: Bruce Powers | March 22, 2024
• Weekly chart signals potential bearish position for gold, but daily chart shows bullish reversal signal on rally above 2,186, with targets at 2,320 and 2,298.
Gold pulled back further on Friday from Thursday’s low, before finding support around the 78.6% retracement level. The low for the day was 2,157, at the time of this writing. Nonetheless, the breakout of a bullish wedge price pattern earlier in the week remains valid. And the potential for a strong bullish continuation rally remains. That outlook would change on a drop below the bottom of the flag pattern at 2,146, which is usually the maximum stop trigger used by traders, at least when using price patterns.

Wedge Breakout Still Valid
Granted, the retracement following the wedge breakout high at 2,212 yesterday has been more aggressive than we might like to see, as it didn’t go far before hitting strong resistance. Nevertheless, what happens next will be key. A 78.6% Fibonacci level is generally a maximum retracement expected before signs of failure. And when the chance for a continuation of the retracement beyond the prior swing low increases.
Weekly Chart is a Concern
Of concern is the weekly chart. Natural gas is on track to end the week in a bearish position. It will form a bearish shooting star candlestick pattern this week, barring an end of day rally. For next week it will provide a bearish setup in that time frame. A drop below this week’s low 2,212 triggers the setup. Of course, if that happens the bull wedge breakout on the daily chart will have failed to follow through.
On the Upside
On the upside, a bullish reversal signal is provided on the daily chart on a rally above today’s high of 2,186. There is a chance for a sharp rally given the rapid price advance that was seen prior to the wedge formation. The current advance would match the prior at a minimum of 2,320. Note that only the high momentum portion of the previous move is being used, starting from the March 1 daily low. Also of interest is the slightly lower target from a rising ABCD pattern. Symmetry between the CD and AB legs of the trend pattern occurs at a target of 2,298.
Read Full Story »»»
DiscoverGold
Gold $GLD - Latest: After fulfilling all my targets from that 'Coil' I am looking to the 12/20 MA's for Spprt so we can carry on up to my next Targets...
By: Sahara | March 22, 2024
• $GOLD $GLD - Latest
After fulfilling all my targets from that 'Coil' I am looking to the 12/20 MA's for Spprt so we can carry on up to my next Targets...

Read Full Story »»»
DiscoverGold
Gold: Bull Wedge Breakout and Price Targets
By: Bruce Powers | March 21, 2024
• Gold's breakout from a bull wedge formation signals potential for a rally, with an upside target of 2,320, supported by a rising ABCD pattern.
Today’s bullish follow through in gold is not too convincing for the long side short term. Gold had a decisive breakout of a bull wedge yesterday and it closed near the high of a long-range green candle. More than 61.8% of yesterday’s advance was retraced today before support was seen at the 8-Day MA with a day’s low of 2,166, leading to an intraday rally. A new record high of 2,212 was reached earlier in the day but the close will likely complete below the open thereby generating a red candle.

Target from Wedge is 2,320
Nevertheless, yesterday’s breakout was strong and the first day of a new swing. We can calculate a measuring objective to help determine a target from the bull wedge formation. In this case we’re going to consider the sharp rally (pole) before the wedge formed as a measured move. The idea being that a similar rally may occur following the breakout of the wedge, like when there is a bull pennant or flag. The low of 2,039 from March 1 starts the pole and it ends at the recent swing high at 2,195. Just because there is a target, however, doesn’t mean it is reached in a direct fashion, although it could be.
Support Seen at 8-Day Moving Average
The measure for the pole starts at a low on February 29, which is when a breakout triggered, and bullish momentum kicked in. It gives us an upside target of 2,320. Finding support today at the 8-Day MA is bullish and should end the retracement before higher prices. If it does not and there is a deeper retracement before new highs or there is a daily close below that price level, the near-term bullish outlook can be maintained till 2,146 at the lowest. That is the bottom of the wedge and if gold drops below there it shows a failure of the pattern to follow through on the breakout.
ABCD Pattern Target is 2,298
In addition to the target from the wedge pattern there is a large rising ABCD pattern progressing that hits the first target at 2,298. That is at the high end of the Fibonacci price zones highlighted on the chart. Since both the wedge and ABCD pattern point to the top of the second Fibonacci price zone, it would indicate that there may only be temporary resistance seen around those price zones.
Read Full Story »»»
DiscoverGold
Gold $GLD - Will want to see the B/Out hold on a Mthly Close...
By: Sahara | March 21, 2024
• $GOLD $GLD - Will want to see the B/Out hold on a Mthly Close...

Read Full Story »»»
DiscoverGold
Channeling Gold --- Gold has adhered to the confines of multiple parallel channels. Just an observation
By: Nautilus Research | March 21, 2024
• Channeling Gold --- Gold has adhered to the confines of multiple parallel channels. Just an observation.

Read Full Story »»»
DiscoverGold
Gold Price Forecast: Wedge Breakout Points to Higher Prices
By: Bruce Powers | March 20, 2024
• Gold's breakout from a bull wedge signals a potential rally to higher targets, with buyers showing enthusiasm for further gains.
Gold broke out of a small bull wedge on Wednesday following the U.S. Fed decision on rates. It was a decisive breakout with gold looking like it is ready to head to higher targets. Given the sharp 7.7% rally prior to the wedge formation, a similar level of enthusiasm from buyers may be seen again. Now that the consolidation phase is complete, today’s bullish price action is indicating such a scenario.

Current Leg Up Potential to 2,320
It is possible to see some degree of symmetry between the new leg of the uptrend that started today, and the rapid advance that started before the consolidation wedge formed. This can be one way to estimate a potential target. Since there is no prior price action to consider, key price levels to watch need to be determined by other methods. Symmetry occurs when the price distance in the second leg up relative to the wedge pattern matches the distance in the first leg. Also, when there is a Fibonacci relationship seen in the second leg relative to the first.
The first leg is being measured from the beginning of the sharp move. A price of 2,039 was used in this case. It results in a potential target of 2,320. That target is higher than two earlier Fibonacci confluence zones. However, those two price zones are identified by only two Fibonacci measurements. More confluence would produce a price zone with greater significance. The first Fibonacci zone is from around 2,235 to 2,246, and the second from 2,277 to 2,298.
Signs of Strength
As noted previously, the existing breakout into new highs for gold that began last week has just started. This could be the beginning of a multi-year advance, if not a multi-month advance. That means that market participants will likely need to get aggressive and stay aggressive if they want to participate in these early stages of the advance. Entry setups may not last for long before price moves again. Gold is on track to end this March with its highest monthly closing price on record, which will provide a new confirmation of strength, and on a long-time frame chart.
Read Full Story »»»
DiscoverGold
Gold Continues to Look Upwards
By: Christopher Lewis | March 20, 2024
• Gold markets continue to see a lot of overall upward pressure, but at this point in time there is a lot to worry about – not the least of which will be the Federal Reserve meeting later on Wednesday.
Gold Markets Technical Analysis
Gold markets fell slightly during the trading session in the early hours on Wednesday, but at this point in time it’s all about waiting on the Federal Reserve and whether or not they are going to move the markets. Ultimately, I do think that this is a market that you need to pay close attention to one specific level underneath.
That’s assuming you get a pullback and that would be the $2075 level. If we pull back to this area, I’m an instant buyer. On the other hand, we could just go a little bit higher and try to reach the highs again, which wouldn’t be overly surprising. We are in the midst of a huge run to the upside. That being said, this is a scenario where I think you will see traders continue to look for value.
And you can even make an argument that we are in the midst of forming some type of bullish pennant. That of course is a strong sign. If we can take out the highs from a couple of weeks ago, then it looks like the market will almost certainly go running towards the $2,250 level. There are plenty of reasons to think that gold will eventually go higher, not the least of which of course is going to be central bank buying, but we also have to wonder how long it’s going to be before the central banks start to cut rates again.
At this point, it certainly looks like we are going to get those rate cuts later in the year, and if that is the case, it should continue to drive this market to the upside. I like the idea of buying any bits and pieces of value that we get the opportunity to do so.
Read Full Story »»»
DiscoverGold
Gold: Potential for Breakout of Bull Wedge
By: Bruce Powers | March 19, 2024
• Gold's recent retreat could be short-lived as bullish patterns emerge. A falling wedge and Fibonacci analysis suggest a potential rally towards new record highs above 2,195.
Gold enters its seventh day of a pullback following the new record high of 2,195 hit last week. Nevertheless, the retracement so far has been mild indicating remaining buying pressure for the precious metal. Yesterday gold completed a minor 23.6% Fibonacci retracement with a low of 2,146. That ratio is not used as frequently in Fibonacci analysis as deeper retracements that lead to reversals in the direction of the prevailing trend occur more frequently. Bullish reversals from earlier Fibonacci levels show stronger demand than bullish reversals that follow deeper retracements.
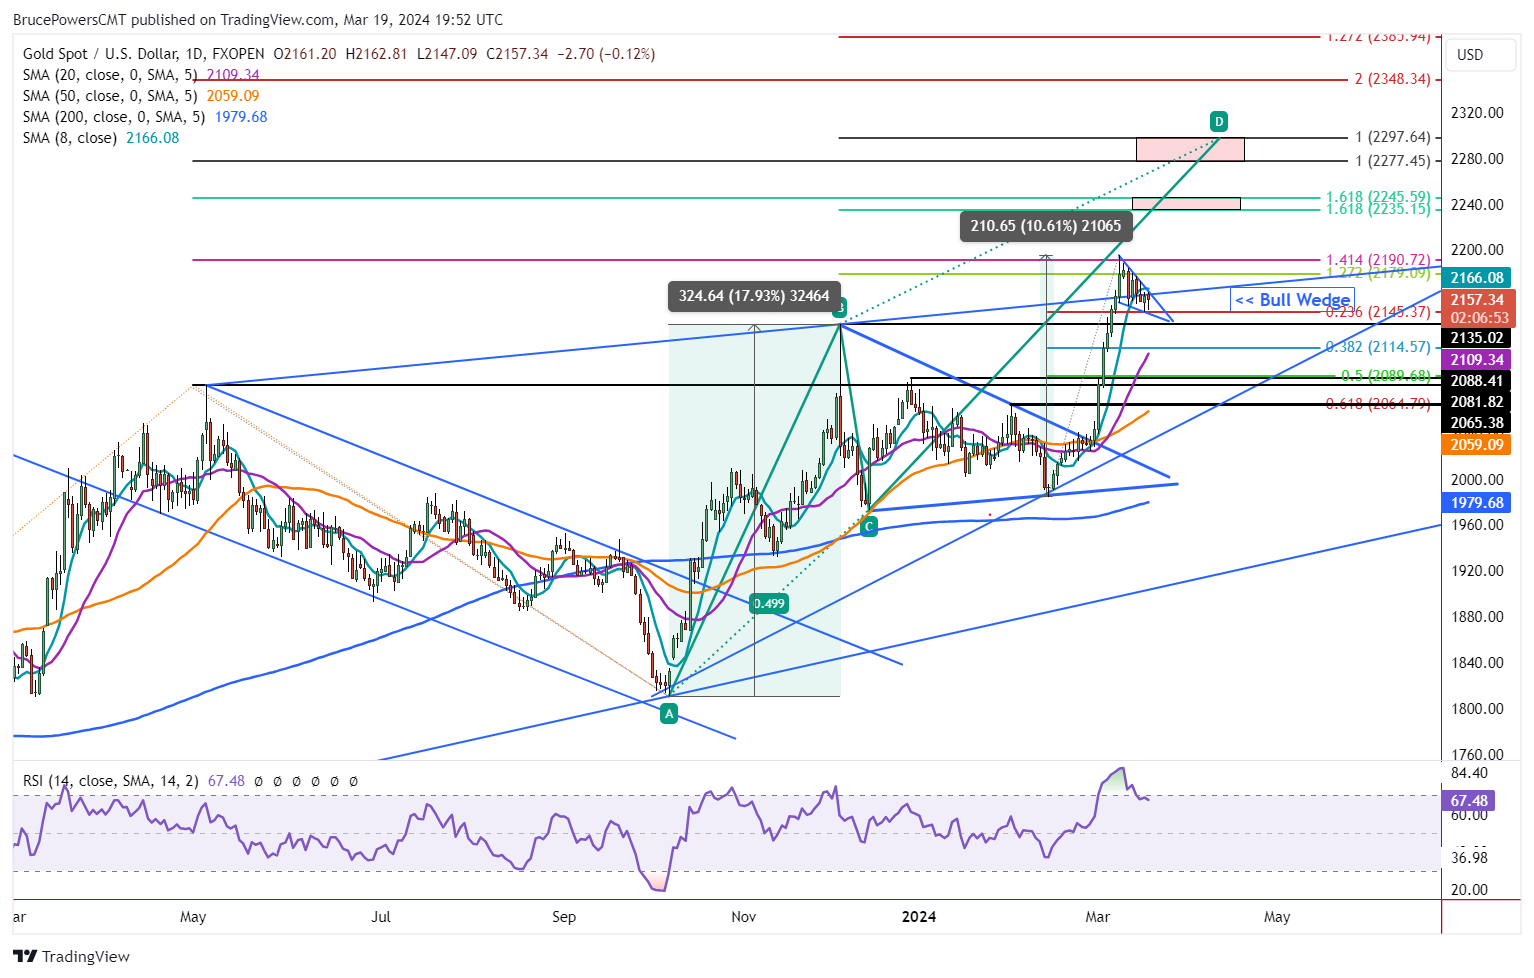
Support Seen at Minimum 23.6% Fibonacci Level
Support around the 23.6% retracement was tested successfully again today leading to an intraday bounce. Gold is on track to complete Tuesday with an inside day. Although the market has not yet closed at the time of this writing, it is looking like a bullish hammer candlestick may complete. If so, an upside breakout above today’s high of 2,163 shows strength, while a breakout above yesterday’s high of 2,164 offers greater confidence that the advance may be sustainable.
Bullish Falling Wedge Forms
Upon further investigation of recent price action, a small falling bullish wedge comes into view. It is a trend continuation pattern. Although the wedge may still need more time to form, or it can morph into a different pattern, a rise above yesterday’s 2,164 high triggers an upside breakout. That could be the beginning of the next move that takes gold above the 2,195-record high. Further signs of strength will then be needed, starting with a rally above the four-day high of 2,177. A Fibonacci target zone is up at 2,235 to 2,246, followed by a higher price zone from 2,277 to 2,298.
We can assess the wedge like a bull pennant by taking the previous sharp advance from before the wedge formed and then adding that distance to the breakout area to arrive at an approximate target. The low from March 1 is being used in this analysis for the bottom of the pole. It provides a potential target of 2,320.
Combined Analysis Points to 2,298 to 2,340 Target Zone
Also, a rising ABCD pattern, discussed previously and shown on the chart, targets 2,298. The measured move advance prior to the early-December previous record high (B) was 325 points or 17.9%. A similar move for the current advance would put gold at 2,309 when looking at the price difference. Calculated on a percentage basis, the target would be around 2,340. In summary, the analysis in this paragraph points to a target zone from approximately 2,298 to 2,340.
Read Full Story »»»
DiscoverGold
The GLD ETF borrowing fee for shorting shares just hit a new high for the year
By: Bob Coleman | March 19, 2024
• ***GLD ETF Alert***
The GLD ETF borrowing fee for shorting shares just hit a new high for the year.

Read Full Story »»»
DiscoverGold
|
Followers
|
191
|
Posters
|
|
|
Posts (Today)
|
2
|
Posts (Total)
|
8596
|
|
Created
|
11/18/04
|
Type
|
Free
|
| Moderators DiscoverGold | |||
| Volume | |
| Day Range: | |
| Bid Price | |
| Ask Price | |
| Last Trade Time: |


