News
News  Market Data
  Discover
Support: 888-992-3836
Copyright © 2023 InvestorsHub Inc.


Register for free to join our community of investors and share your ideas. You will also get access to streaming quotes, interactive charts, trades, portfolio, live options flow and more tools.
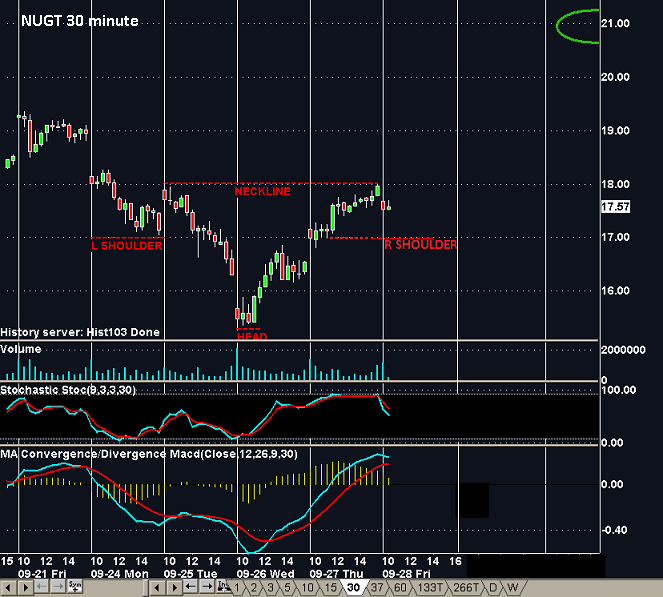
TNA - The pattern works for Intra-day trades too.
Click links below to view some other intra-day Inverted H & S charts from my blog...
INDU
Double H & S on SDS
could have been played using SSO
There are two large charts imbedded below -
smaller versions will be posted on my blog on the Trade Anatomy page when I create it


Inv H&S resolved/ DJI has retraced 50% of the
drop since the October high.


Some newworking stocks...
Link to Finviz screener
$NWX...
Chart from Tom Bowley | InvestEd Central

ERX bullish 5 wave wedge...
WE'LL SEE IF THE H&S or THE WEDGE PLAYS OUT...

Updating
ERX H+S update..Brach Zone fibonacci target

Updating:
The Finviz chart "auto-anotation" has the S-H-S marks on it albeit the pattern is not very symmetrical...
You're right about the double bottom - it also broke out of a decending wedge which I posted on
FLAGS, TRIANGLE, WEDGES board. I will add it to the DB board too...THX
Why do you think it is a IH&S and not a double bottom?
What the HEK
Chart from March 2 by jlbaker5 on StockTwits Continued upward despite market stumble this week.

AGQ is tearing upwards and could gap thru the September down-gaps

UPDATING:
RLOC...V-bottom or Inv. H&S
erjan said on StockTwits "Possible head and shoulders bottom along with
reversal on the macd back in aug,could be a big move"
Feb. 26 at 4:01PM | Bullish > Bullish Unassigned

updating:
APA Inverse H&S
Chart by itz_stock_chartz on CHART.LY.com

updating:
MSCI consolidating under the neckline


updating:
MCP is breaking a bullish wedge at the right shoulder of a nice
Inverted H&S pattern...
Thanks go to Contrarius on StockTwits CHART.LY.com

Delayed chart below, but it will update...to see how the above call turns out.
CCE - a couple of pattern measured move possibilities.

Wow...thanks for finviz, I didn't know about that. Looks like a great screener!
I might add boards - you could do it too, iHub allows users to create new boards.
Its almost as easy as posting a message.
________________________________________________________________
________________________________________________________________

________________________________________________________________
________________________________________________________________
Meanwhile use Finvis.com to screen for chart patterns....
_______________________________________________________________
_______________________________________________________________

Thanks for the heads up, are you going to make any boards for any other type of chart pattern?
EEM has broken the neckline...53 target.

Regions Financial Corp. RF is approaching resistance and its I-H&S measured move...breaking out of the channel formed from Oct's bottom.

IWM...iShares Russell 2000 Index...target 90

Phoenix...you have been marked by me already... some time ago.. GLTY on your investments and have a great new year.
Joshfm re: FXI and CVX patterns ...thanks for your comments and welcome aboard.
FXI has potential to run. Its chart is included in the intro message for the board (3rd chart)
and hopefully will update.
The chart below will update...

Static FXI
I don't see the pattern on the CVX daily, looks more like a DOUBLE BOTTOM pattern (another new board)
although there is a W pattern on their charts.
Since inv. H&S patterns and double bottoms are reversal patterns, there has to be a previous down trend
to be reversed IMO,... Though CVX looks strong, I dont see either pattern on CVX.


Awesome idea for a board, I'm following. Check out CVX and FXI for IH&S patterns just under their necklines.
Buy pullbacks...DE...perhaps the MAR 82.50 or 85 strike
calls may look like a reasonable speculation if price
pulls back to the trend line.

MOO has been turned away at the neckline resistance around 52.50 and the indicators
are not especially favorable for an entry at this time...

DOV ...pattern looks good but may need to consolidate the recent push. If your outlook is bullish, buy pullbacks.
Static chart:

Updating chart:
I'll be the first to post. Congratulation on your new board. Board mark and person mark for the mod! Good Luck!!
|
Followers
|
4
|
Posters
|
|
|
Posts (Today)
|
0
|
Posts (Total)
|
91
|
|
Created
|
01/31/12
|
Type
|
Free
|
| Moderator sharpshorts | |||
| Assistants | |||

Posting comments, opinions, questions and charts are welcomed... including both a static chart and an updating chart
is prefered as viewers can see how your ID'ed pattern does over time...but this is not a requirement.
Also visit my other boards here on iHub...
|
|
| Volume | |
| Day Range: | |
| Bid Price | |
| Ask Price | |
| Last Trade Time: |