News
News  Market Data
  Discover
Support: 888-992-3836
Copyright © 2023 InvestorsHub Inc.


Register for free to join our community of investors and share your ideas. You will also get access to streaming quotes, interactive charts, trades, portfolio, live options flow and more tools.
It's called a Bat-Wing because like the animal in flight
you can't tell which way it will go.

The elusive Bat-Wing -- a consolidation pattern ...
It's sort of shaped like a double bottom but it happens after a run up.
It doesn't suggest any directional bias but it does create a support & resistance channel.
It's a mixed signals chop machine that you usually can't recognize until the last leg.

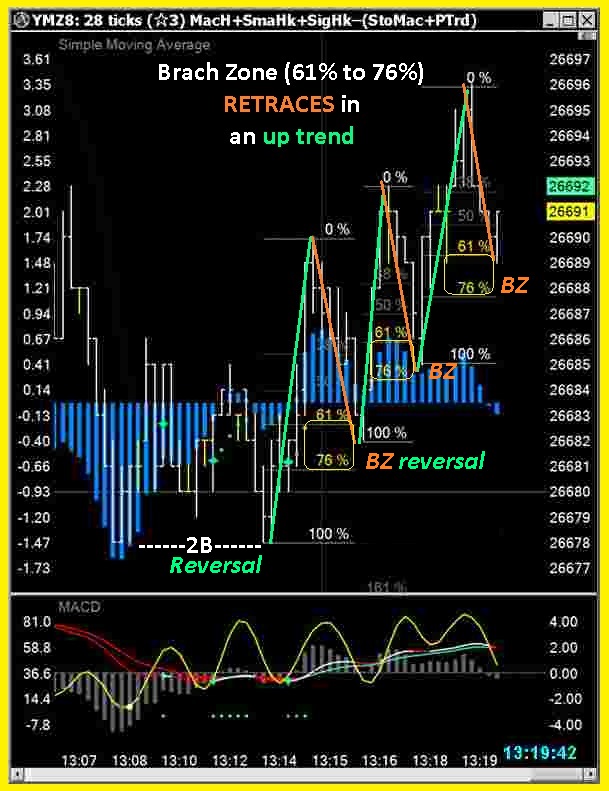
A couple more 2Bs

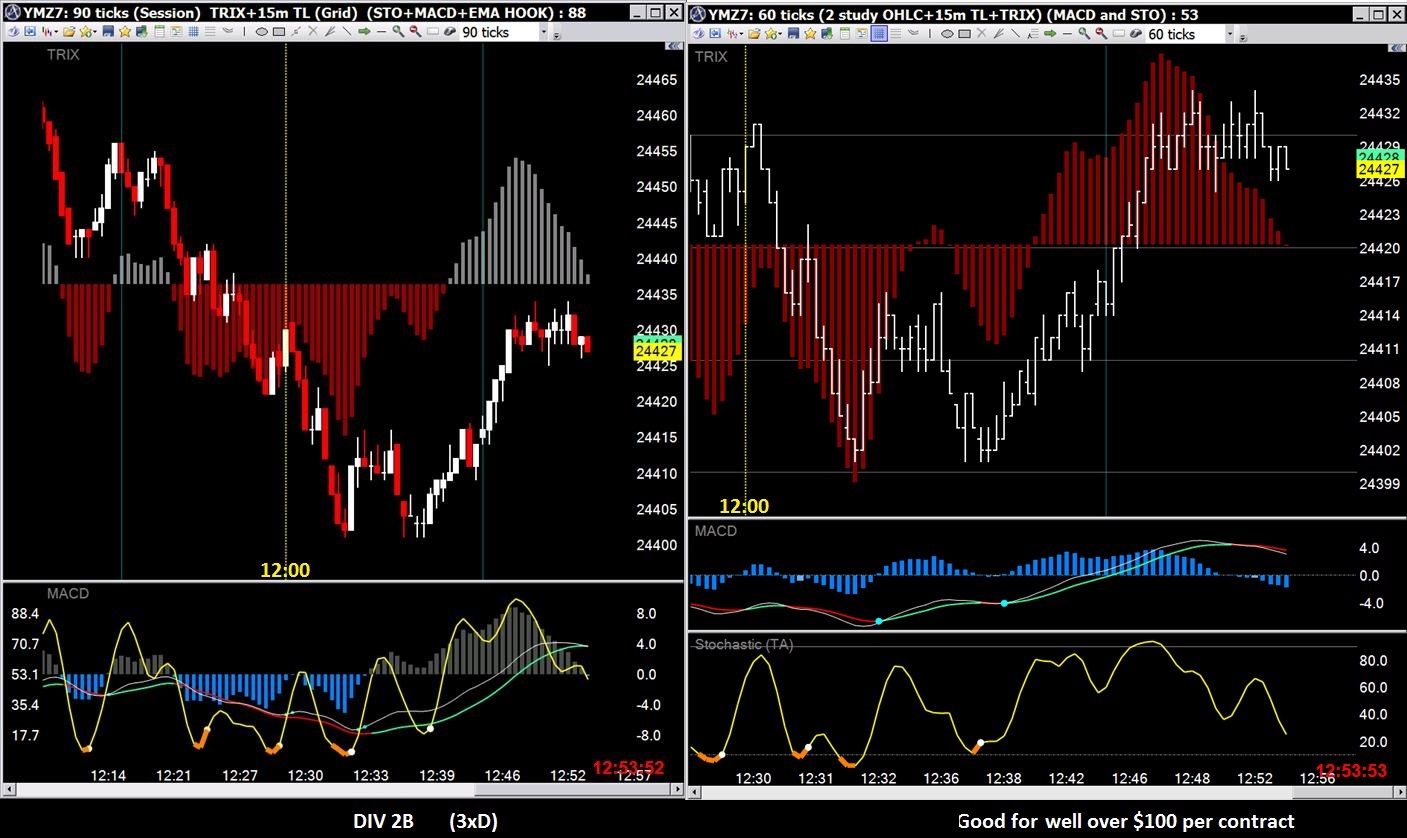
Divergence calling the reversal with a 2B 2-boot

High...err...hello
Trending nicely with larger volume since Jan's bottom. Currently absorbing Mar's run up.
Price is @ the 50 sma with Stochastic heading O/S... probably a good time to enter.
Looks like when it runs, it does so strong for a week or so...(see the 2 rallies in Jan and then again in Mar)

Good evening
ACB
Mix signals your thoughts
PRICE ACTION 2B pattern and INDICATOR pattern
...don't neglect trend line breaks - they often foreshadow direction changes...

Another 2B bottom followed by an MT SLING... Good for $150...

A 2B bottom followed by an MT SLING ...Good for $50...

Bear in mind I'm almost always a bull (in my T/A bias)
Positives -
I see an inverted H&S price action pattern (Dec into Jan) since Dec's drop...
Price was 1st stopped by the 200 MA then supported (somewhat) by the 50 but now is above both...
The RSI has since stayed above 40-line and the MACD EMAs have crossed upwards...
Price is at resistance here - I'd be in on pullbacks, expecting support in the area between
the two MAs and look for a breakout, then look for the MA golden cross...

IMO, the Wall Street economy is now following the Main Street economy and I think
the majors have a lot more room to go as more positive news comes out...
I use the e-mini futures as proxies for the major markets:

The evening hours...same as the major market hours just slower

Breakout - exemplified.
E-mini futures almost never gap

You decide - is this a continuation gap or an exhaustion gap...

Never look away while in a position ...
not even for a second...Manage your trades...You must be there to raise your stops!!! Every little extra loss hurts.

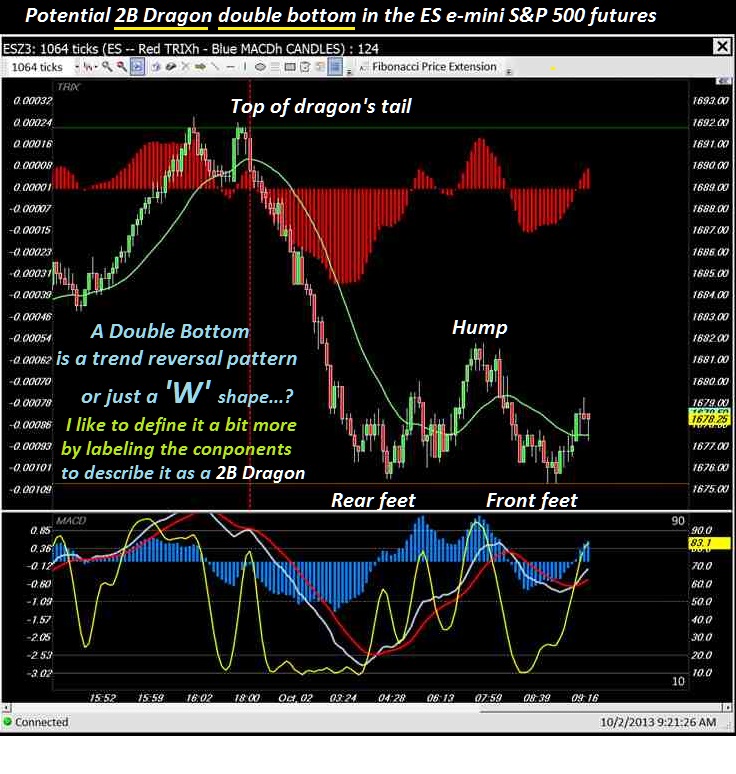
A double bottom... not quite a 2B Dragon but still trade-able.
An equal or lower low was only 'almost' there so divergence wasn't really a factor...
The "longer term" rising MACD EMA signals (MacTrend) was the deciding factor
along with the stochastic slingshots -- MTSLING --
20 points or $100 per contract is not too shabby for Sunday night.

Always play by the rules
Simple Rules and Simple Charts

Study price action patterns and indicator patterns combined with multiple time frame charts.
The idea is to give yourself better odds of success when choosing long entries.
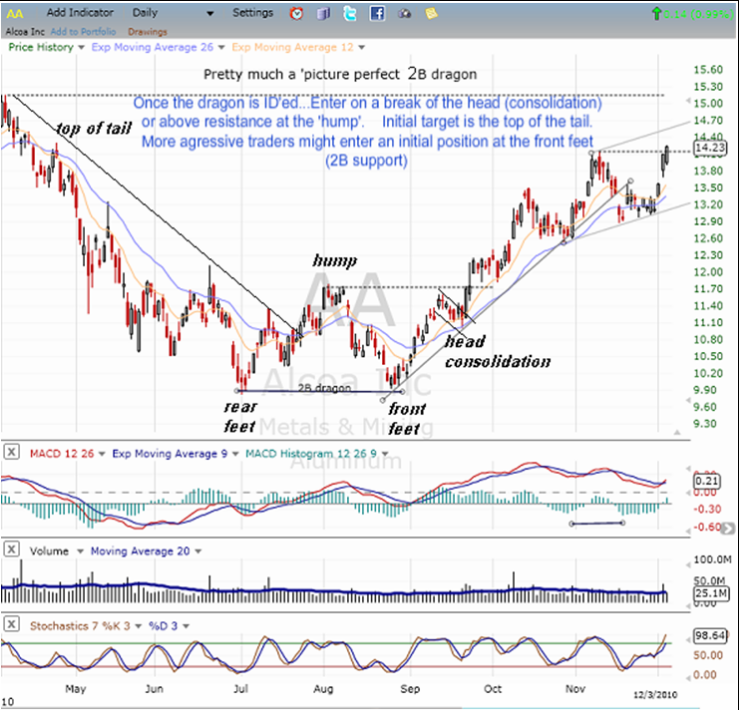
--->How it's done<---

Combining Price action patterns for profits
Why use automatically generated TARGET+STOP-LOSS bracket orders?
Because extremely fast markets can happen at any time - -
by the time you can react to them, you can lose your shirt.
Got a good fill expecting a 2B...
Price then moved up which gave me time to raise my Stop-Loss ...
Then out of no where price dropped 10 points within 1 second...
...this example saved me $50...

A short-time later another divergent 2B was anticipated ...

...price action RE-ACTION to divergence is often delayed....often works without a "perfect" 2B forming.

Divergent 2Bs...Extrapolate - consider what might happen

Trade them

May not seem like much but they happen often enough to make up for little bits-and-pieces trades

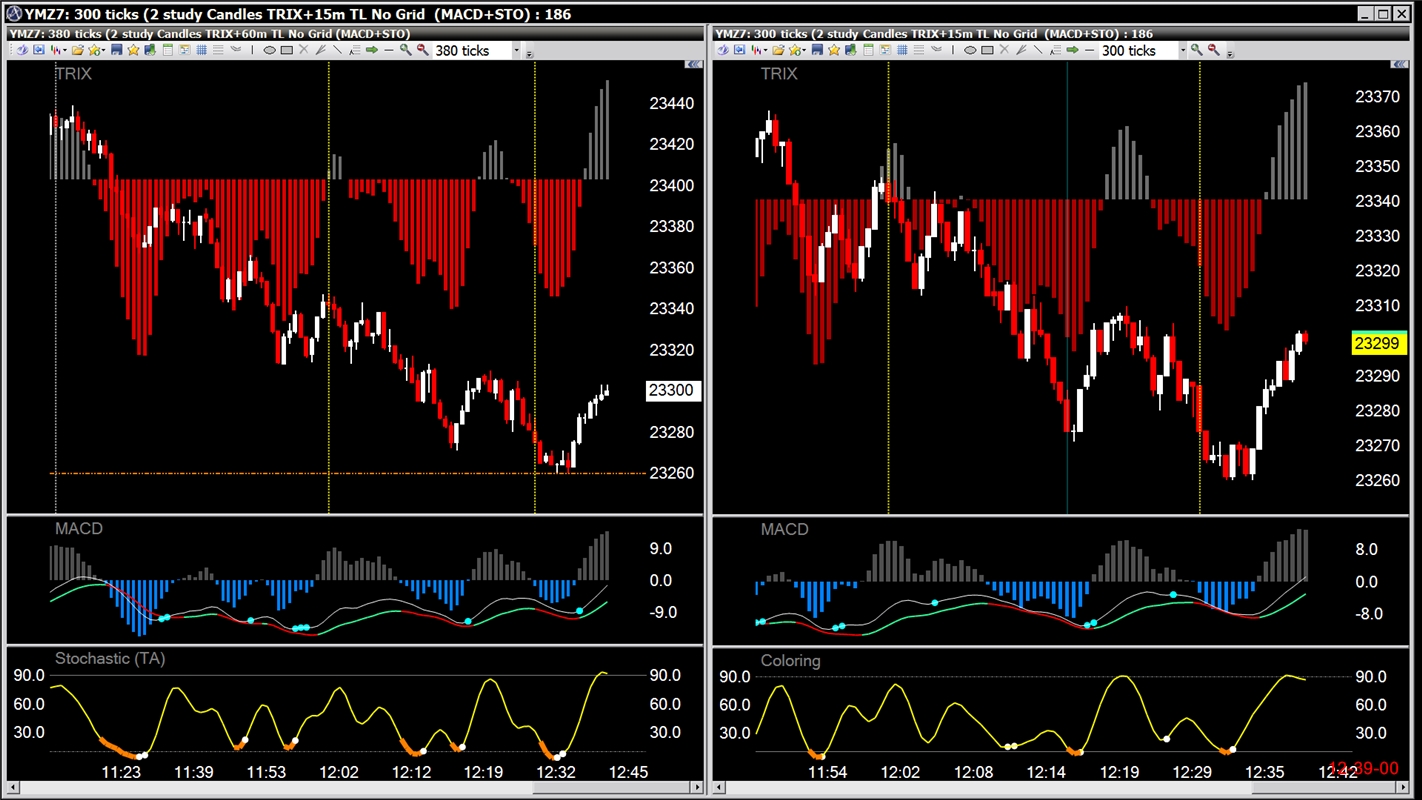
The longer term charts afterwards...

...just notice when 2Bs are happening . . . some days more often than others

Of coarse 2B Dragons don't always work ...


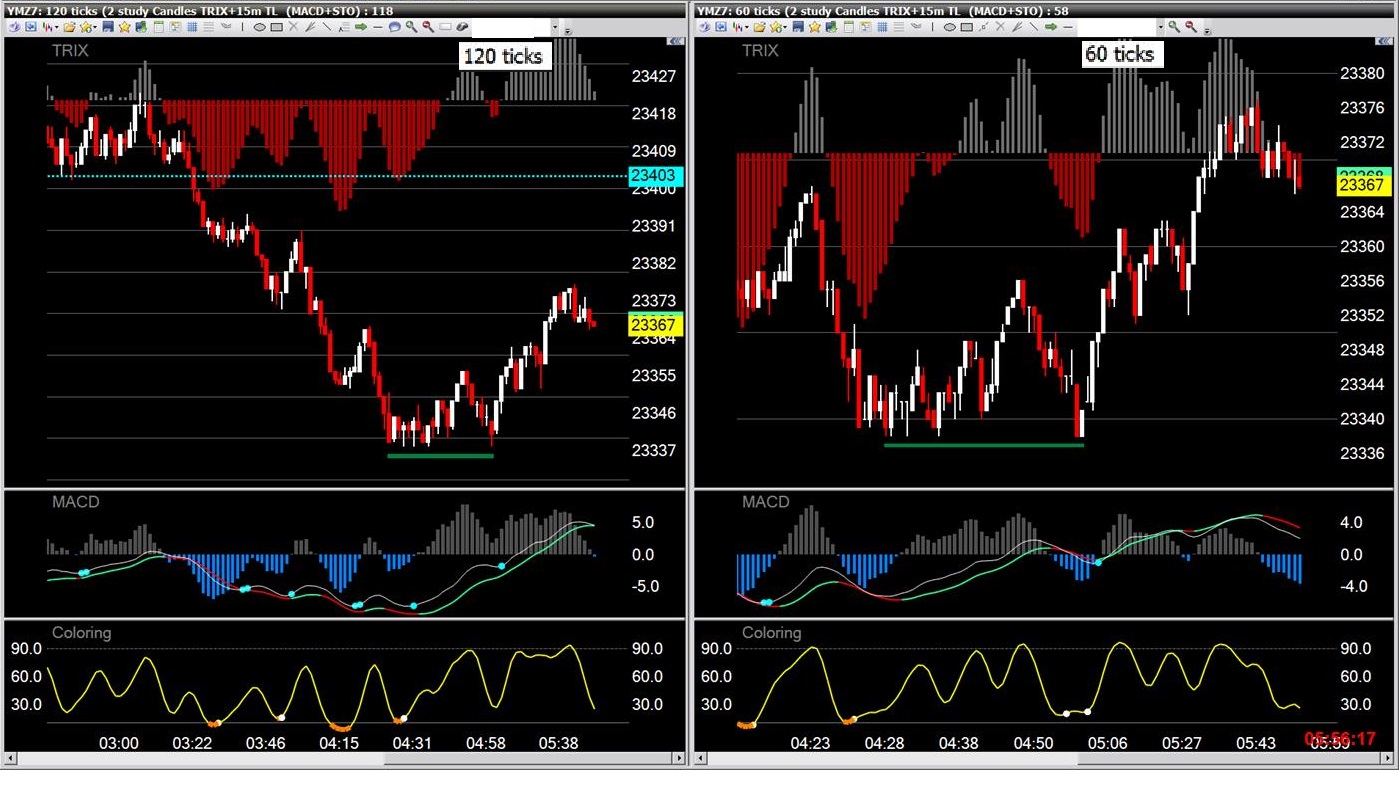
Early morning 2B... price action remains the same across all time frames
but the indicators will show differences.
Stochastic and Mac Histos react much quicker to changes in price than the MacEMAs.
The longer time frames produce entry signals a bit later than the shorter time frames but the "longer the stonger"...


Some days perfect 2Bs are more prevalent ...


2B Price Action reversal pattern

Slingshot & MT SLING Indicator patterns

...the patterns don't need to be perfect...

and the survey said::::


Topping or bottoming?
A head and shoulders on the longer term ... a 2B Dragon on the shorter.
Could be either or both...depends on how long you want'a hold your position(s)

Another 2B on the longer and intermediate term

And so it goes...2B reversal with historam divergence

Reversal potential...I'm always looking for bullish rationals ...

Sometimes it's worth waiting for 'em . . .

The 2B bottom reversal PRICE ACTION pattern ...
Look for what the chart can tell you ... even on this 2500 tick-per-bar snapshot you can see clues
to a potential reversal very early in its development.
The white arrows were added in MS Paint. they were added AFTER the 2nd leg of the double bottom printed.
They align with INDICATOR-to-PRICE divergences (DIV):
Multiple divergence signals printed WHILE the 2nd leg formed.
-- in the price pane -- DIV on the LSMA histogram
-- in the study pane -- MACD histogram DIV, MACD EMA DIV and Stochastic DIV
Suppose you bought a single contract @2713-2714 and sold it @2718...
The resulting profit would be at least 4 points (or 16 ticks)
-- in cash terms that equates to $200 (less commission).
Consider that only $500 is required to be in your account in order to make this trade.
But you are not necessarily risking the entire $500 to get the $200 return...
You can stipulate a stop-loss below your entry price of any amount, for example:
-- If you stipulate a 2 point (or 8 tick) stop then you are risking $100
for the $200 return.
Which would be a 2-to-1 reward-to-risk or a 100% gain.

Not a perfect 2B reversal but still powerful.
Nice mixture of divergences on these two time frames showing too.

2B with divergence and other signals ...

2B just after the majors open


Another 2B overnight...what goes down, must go up
Turned out to be a nice little run ... (Text on chart should be +$300)

Another 2B before lunchtime. Usually there are several times through-out each session that they print.
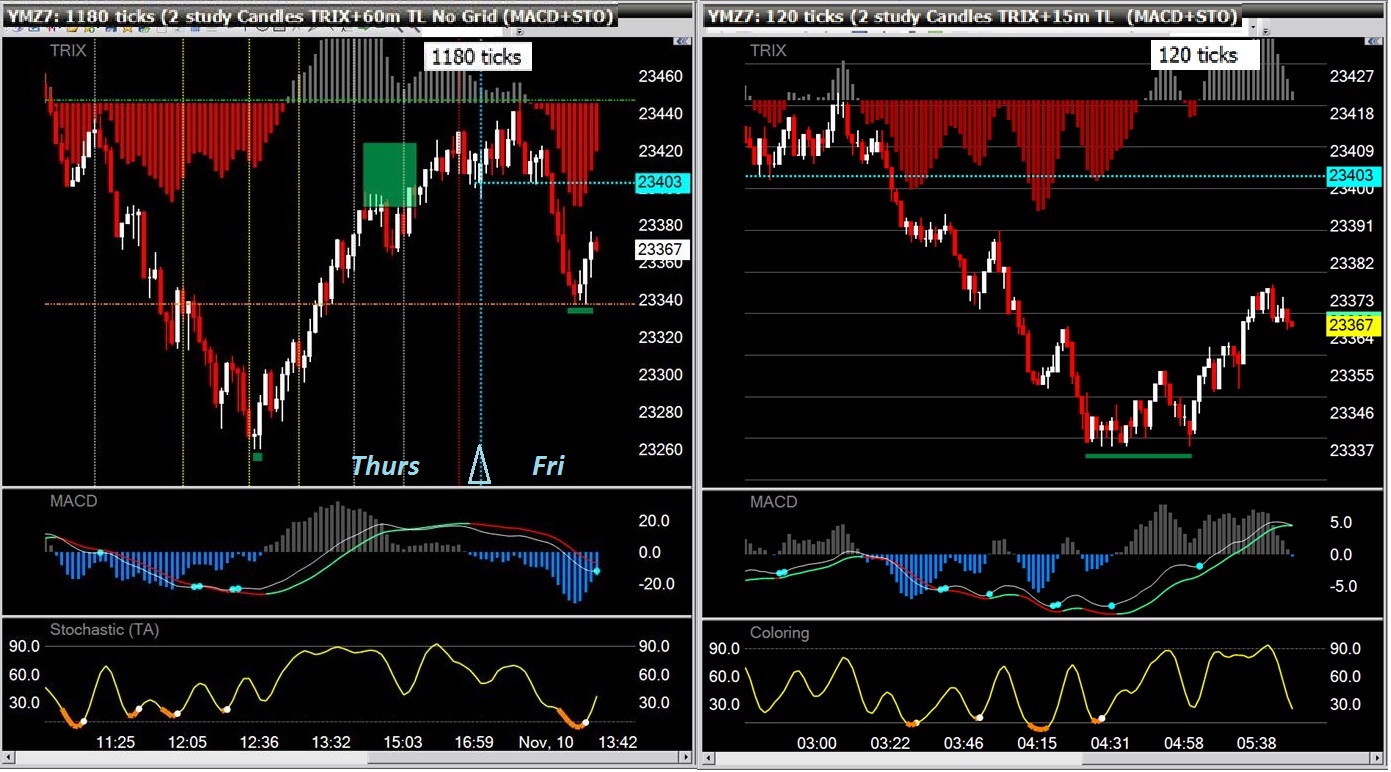
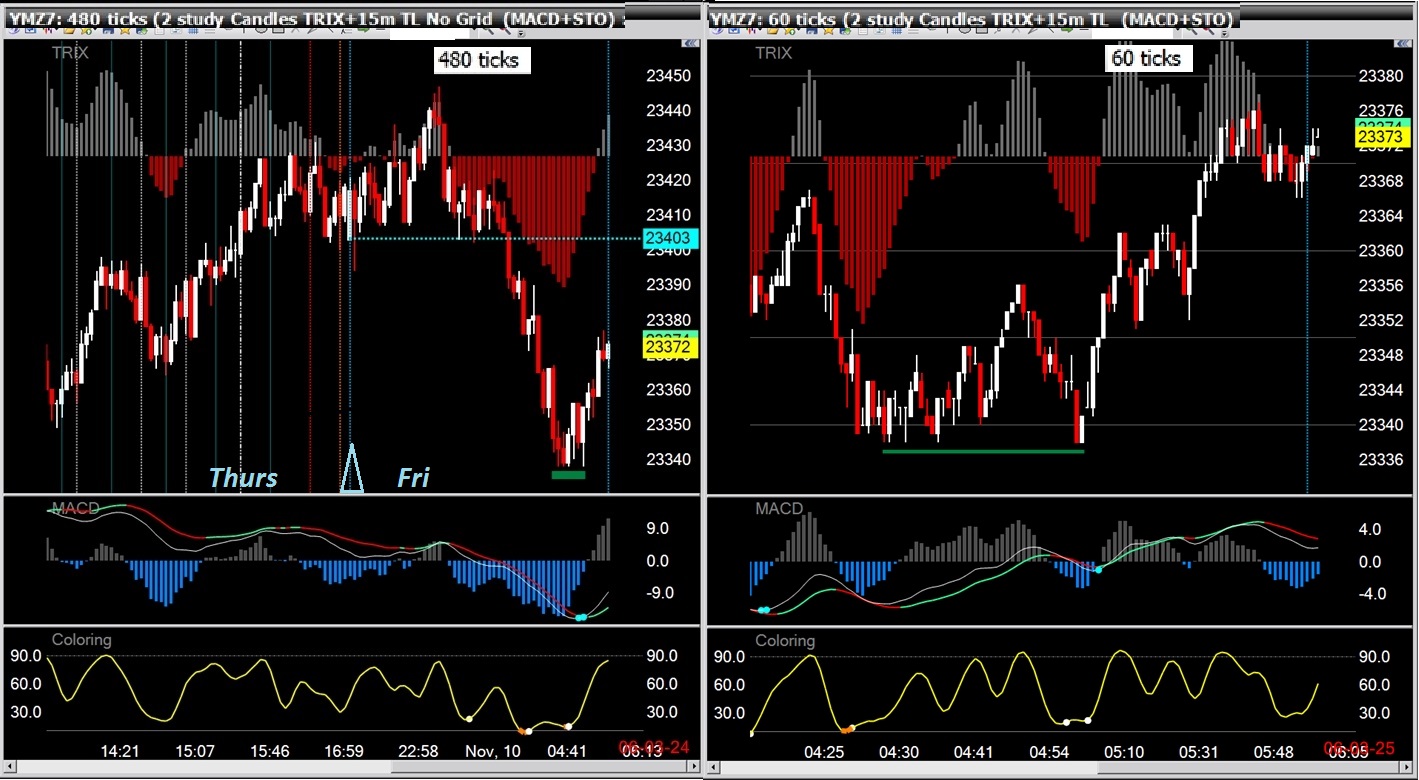
Here's a look at this one across 4 time frames:

Persistent P/A pattern -- the 2B
Sometimes they may not be apparent on your entry chart:
Sold a trade before the 2B formed, was not "with it" enough to take the 2nd offering...

Often 2B patterns are more apparent on higher time frames, allowing for relatively low risk trades...
These charts also show indicator divergences at the Dragon's front legs.

2Bs continuing to form


2Bs in the morning...

and how to trade them:
|
Followers
|
9
|
Posters
|
|
|
Posts (Today)
|
0
|
Posts (Total)
|
353
|
|
Created
|
01/31/12
|
Type
|
Free
|
| Moderator sharpshorts | |||
| Assistants | |||
|
|

| Volume | |
| Day Range: | |
| Bid Price | |
| Ask Price | |
| Last Trade Time: |