 News
News  Market Data
  Discover
Support: 888-992-3836
Copyright © 2023 InvestorsHub Inc.


Register for free to join our community of investors and share your ideas. You will also get access to streaming quotes, interactive charts, trades, portfolio, live options flow and more tools.
CORRECTION... the numbers in the previous post were off by 25%

There was lots more...over $200 per contract in less than 1/2 hour.
Considering that only $500 was needed to put on the trade, a 40% return is not too shabby.
Note that you need not risk the entire $500 initial investment - you can use tight a stop to limit your downside - I use a 4 tick stop-loss ($20 plus commission) so what's the risk/reward here?
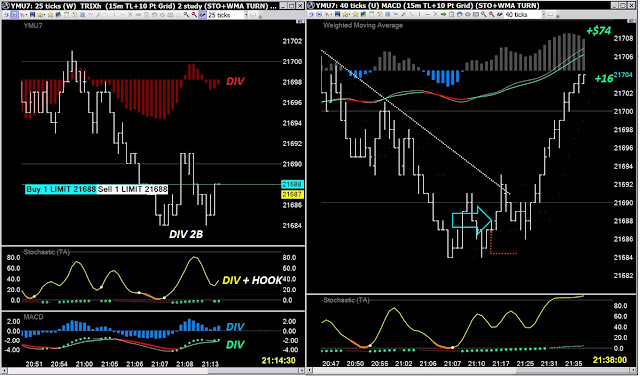
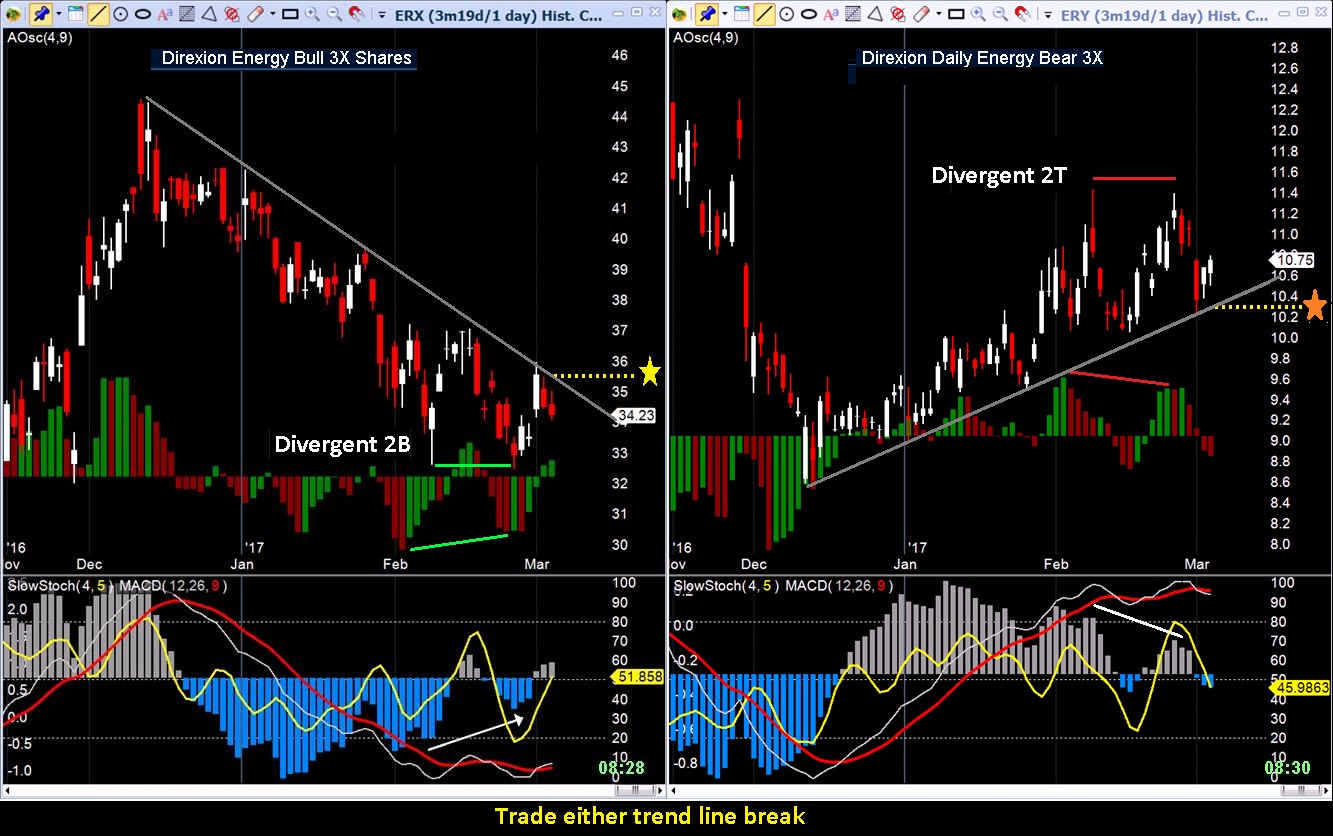
Divergent 2B - we'll see if this one works or whether this was all there was...
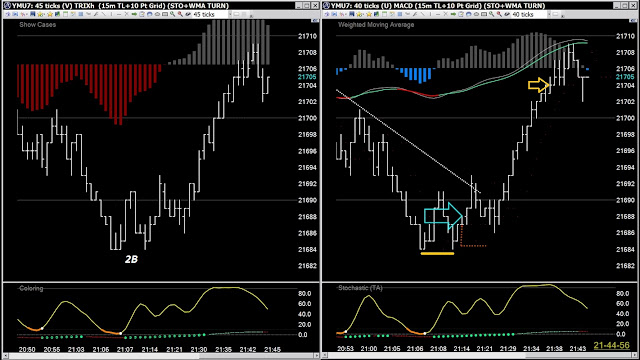
Another divergent 2B ... this one gets help from a Slingshot

Another day, another DIV 2B

DIVergent 2B

Never a Doubt !

DIVERGENCE on the MACD histogram, MACD EMAs and Stochastic told you
that the downward momentum that characterized the bottom at the rear legs
was waining by the time the front legs printed ...
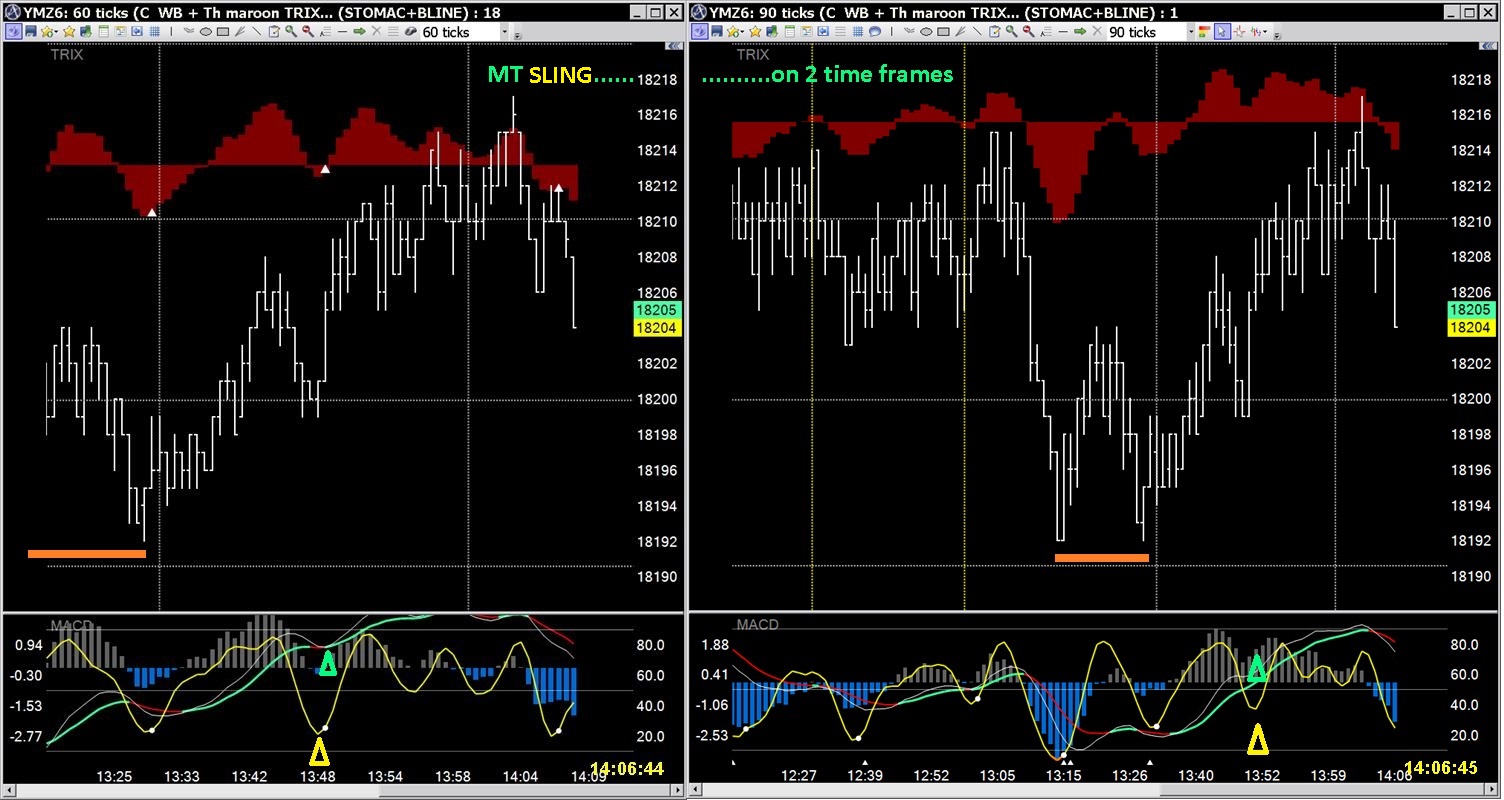
2B on multiple time frames...will it work?
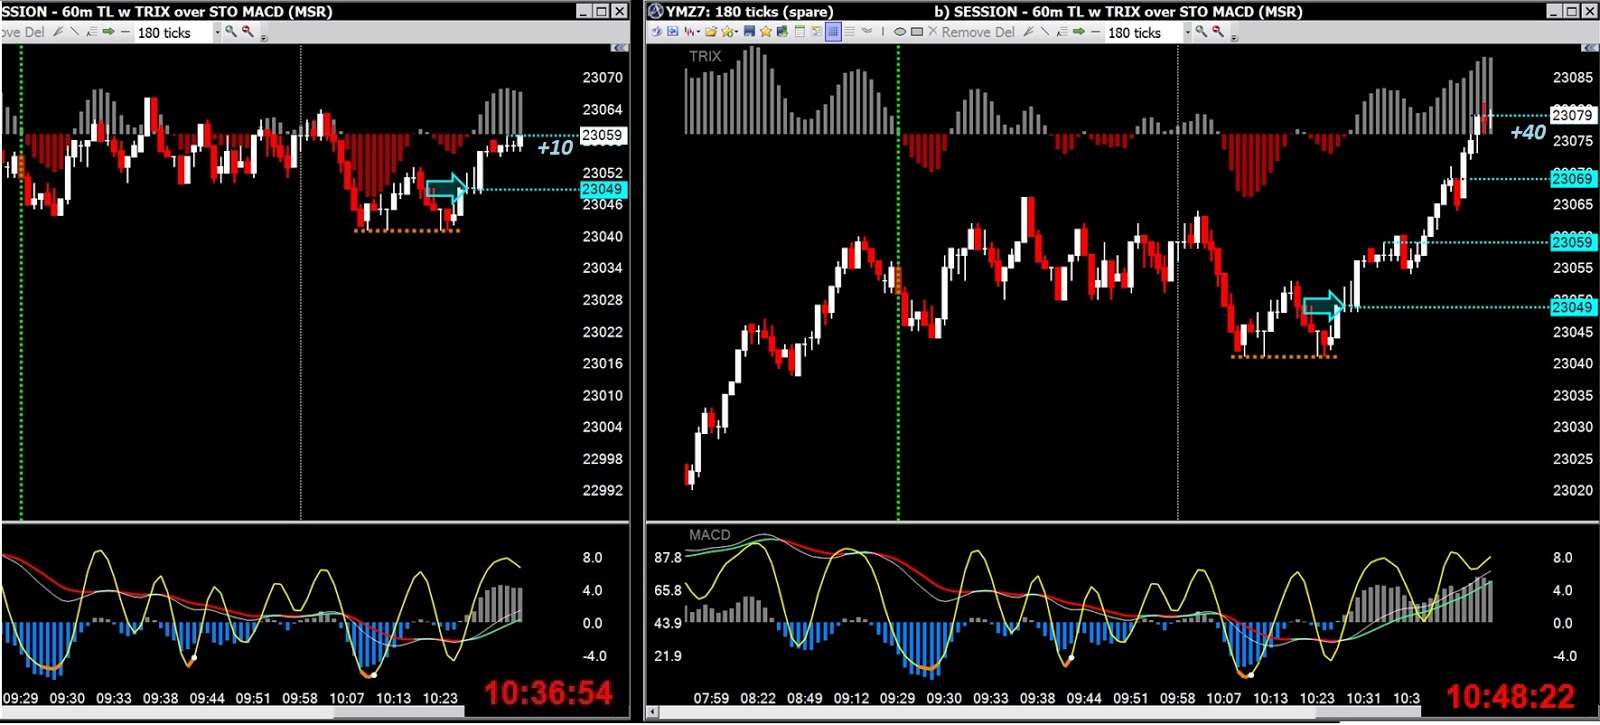
Entire session..................................Major Market so far..................................trading chart

2B Signal and Entry... on multiple Time Frames.
Notice the Price-to-Indicator divergences as well...


Other confirming Entry Signals -- Mac Trend Slingshot with Stochastic HOOK on the lower time frame
$ASTI Double Bottom
$URRE How Is Uranium Mining Conducted in the United States?
The old reliable 2B Dragon reversal...
Any time of the day or night
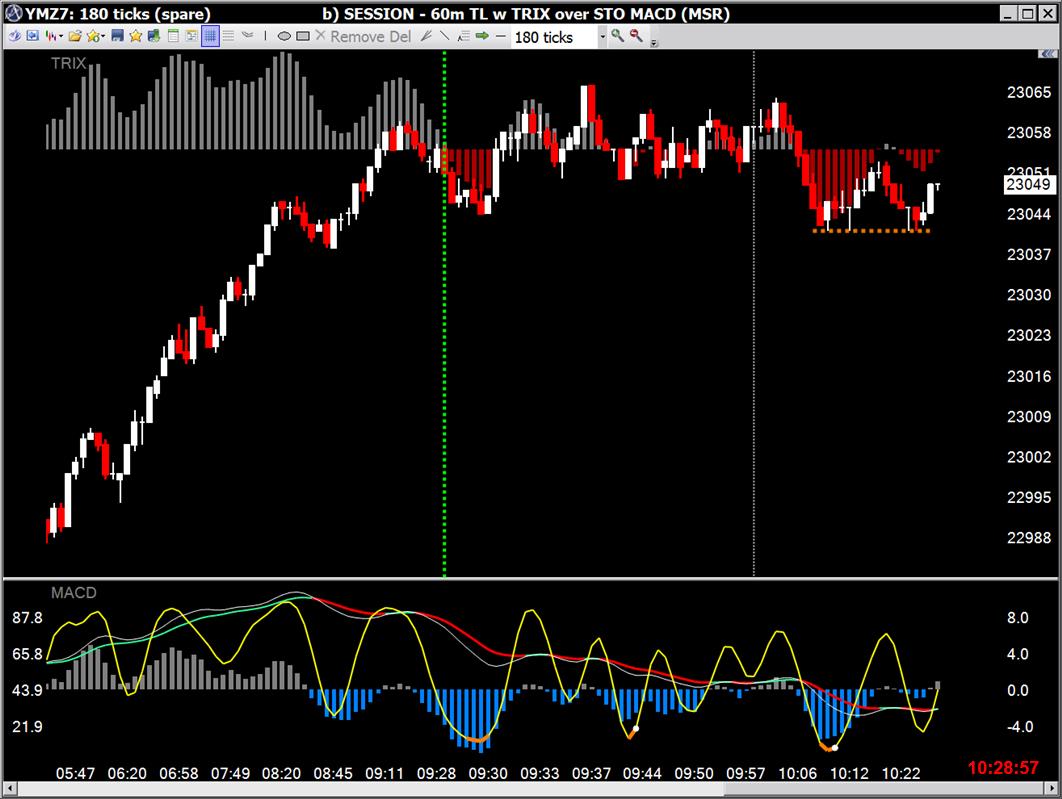
Here's what the higher time frame looked like, next to the exit chart...
and the higher time frames
The daily and the last 2 sessions including Friday's new session
X
United States Steel Corporation
https://investorshub.advfn.com/boards/board.aspx?board_id=11545
$ASTI **** GOLDEN CROSS *******
$UURAF THANKS FOR CHEAPIES...ADDING MORE!
$ASTI Double Bottom formation
On NGD I meant to say...it's currently Over/Bought
By now you should understand I'm basically a perma-bull, I almost always just 'see' bullish patterns and signals. I don't have a good feel for spotting the bearish stuff. My musings are based strictly on the technicals I get when looking at a chart.
I don't even know what NGD does.
I use the same technicals in my real trades. I trade only the e-mini index futures, I only take LONGs and on a VERY short term basis (in-and-out in less than 5 minutes usually)
With the above in mind, I no longer need to be concerned with fundamental analysis, i.e. what a company does or if they are any good at it..
I contend that chart patterns are the same whether you trade equities, futures or what-ever. They continually re-appear whether you look at weekly, daily or intra-day charts.
AND
they have been doing so ever since charting was invented.
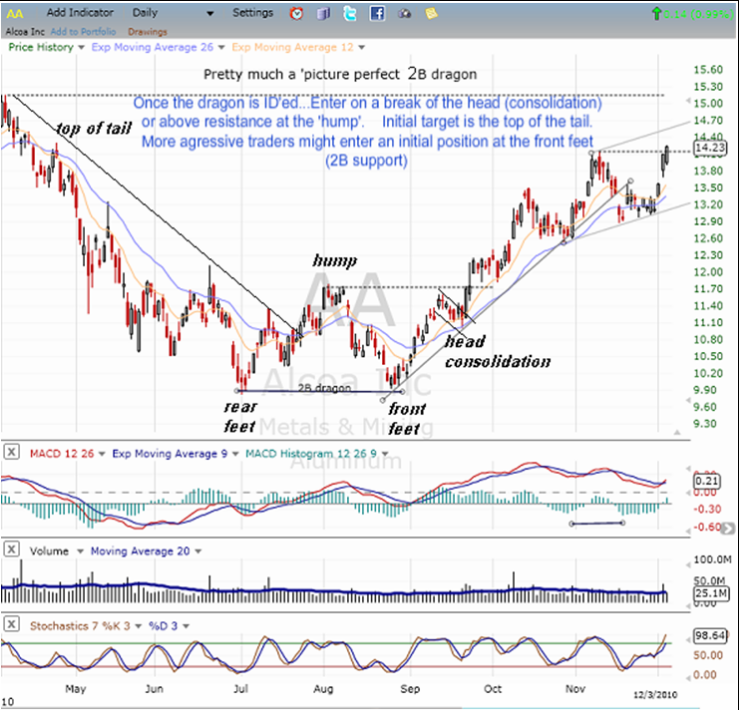
Hi kittycattt...nice looking chart, looks like a well-defined-bottoming process to me...
I'd call it an unconventional 2B Dragon pattern.
The drop from top at A to the bottom at B went like a hot knife thru butter...There's a lot of "free air" above C
which is about at the same level as where price is heading now -- the current down trend line.
Even though it's currently O/S, I'd enter now...might miss it you wait for a pullback...
(ie a Dragon's "Head" consolidation might form below the trend line...)
The recent up thrust looks strong so it may not give you that chance.
If it breaks-out:
The "HUMP" is the next target area, then the 200 EMA are natural resistance zones before the final run to the "Top of the Tail...


Aloha!!!
NGD
TRIPLE BOTTOM? Your thoughts
Double Bottom forming on $ASTI ?
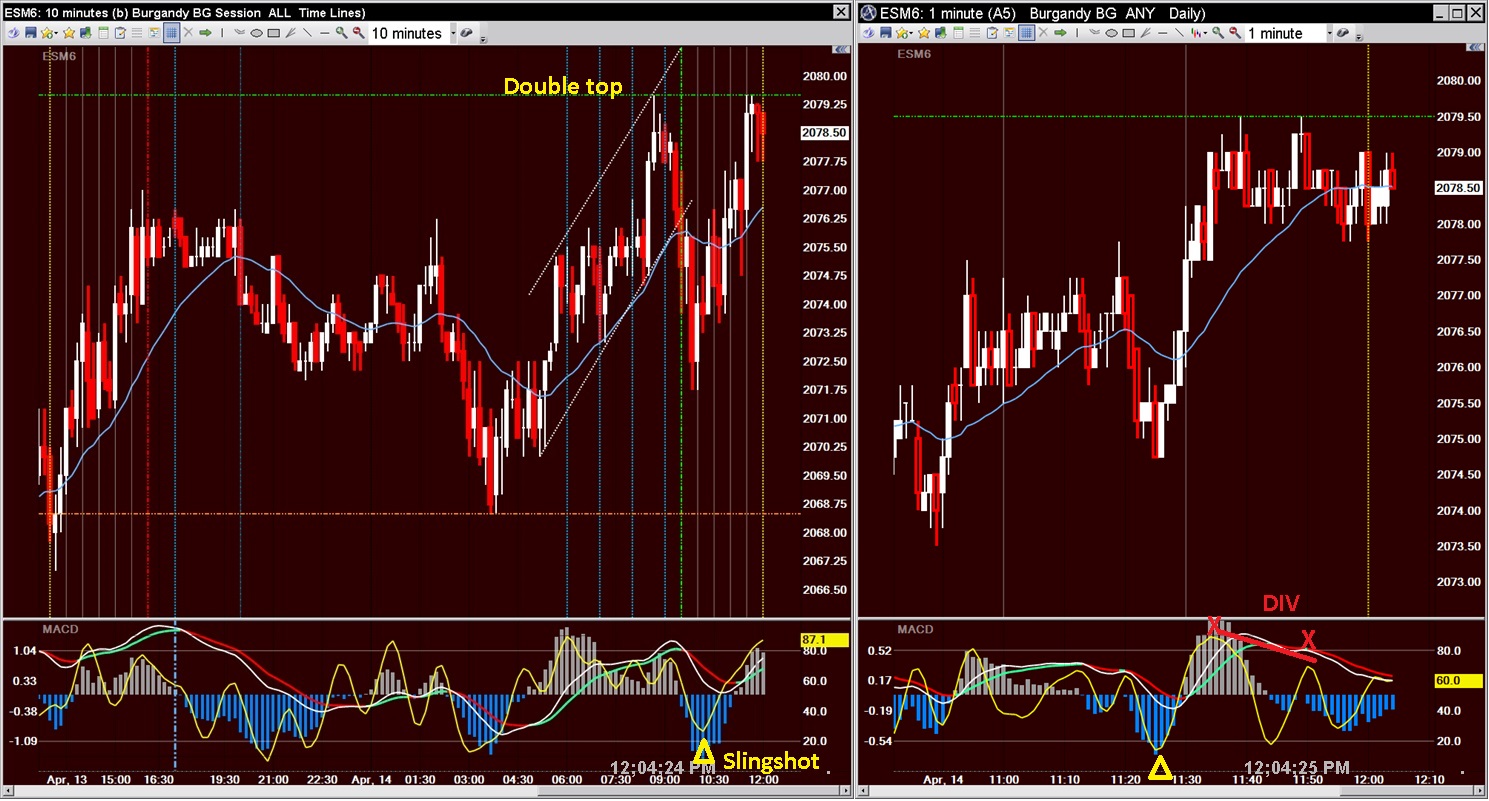
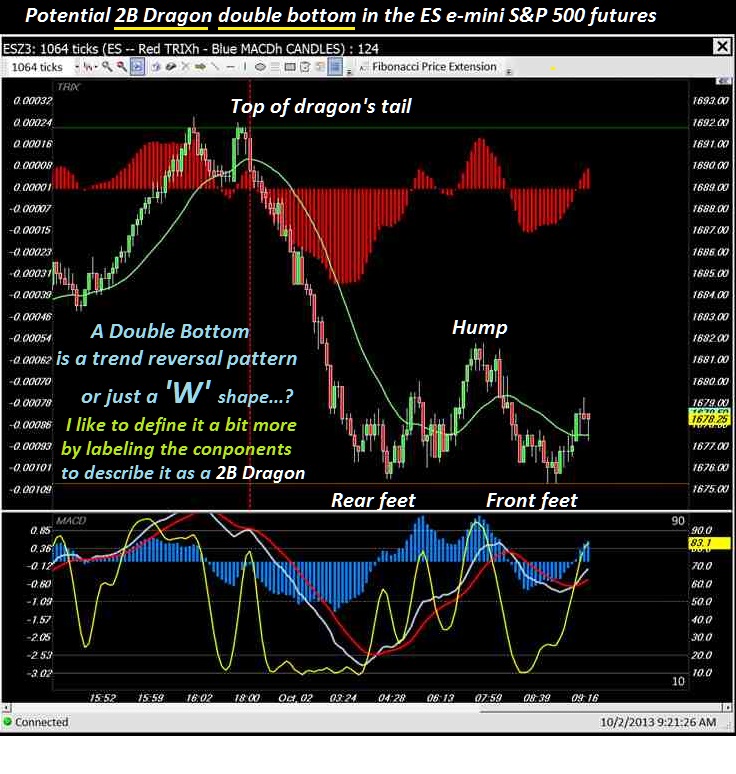
2B price action pattern with indicator divergences

2B Dragon bottoms are beautiful . . . on any time frame.

'Normally' associated with reversals at bottoms, 2Bs can be used as continuation patterns too.
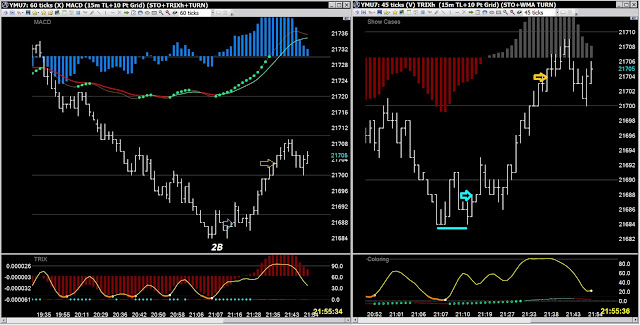
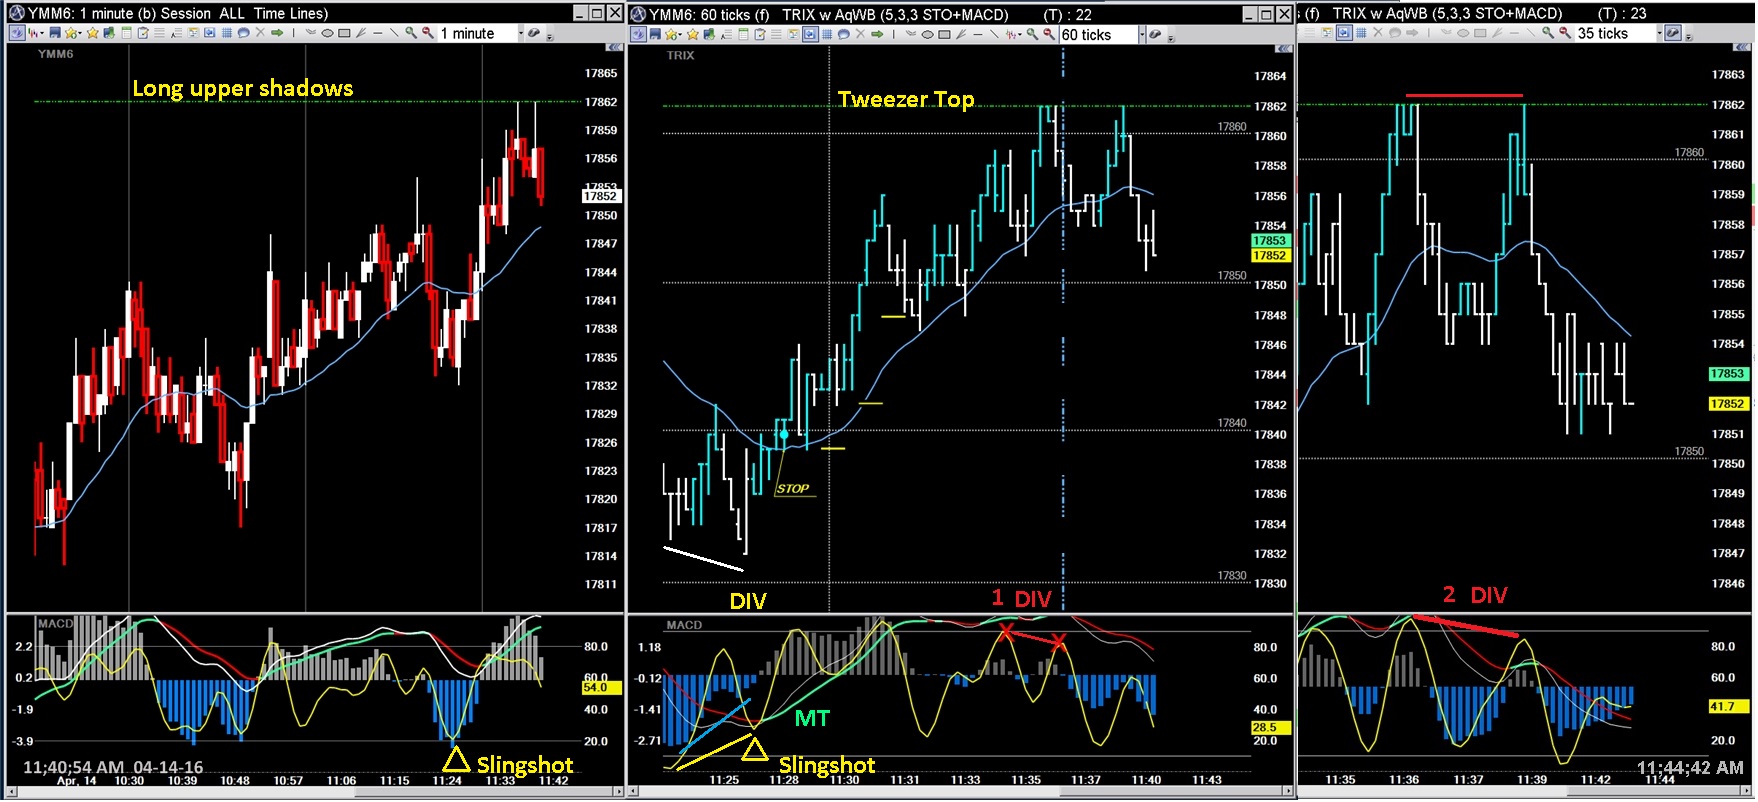
The 15 minute on the left shows nothing but up-trend from the MMO @9:30.
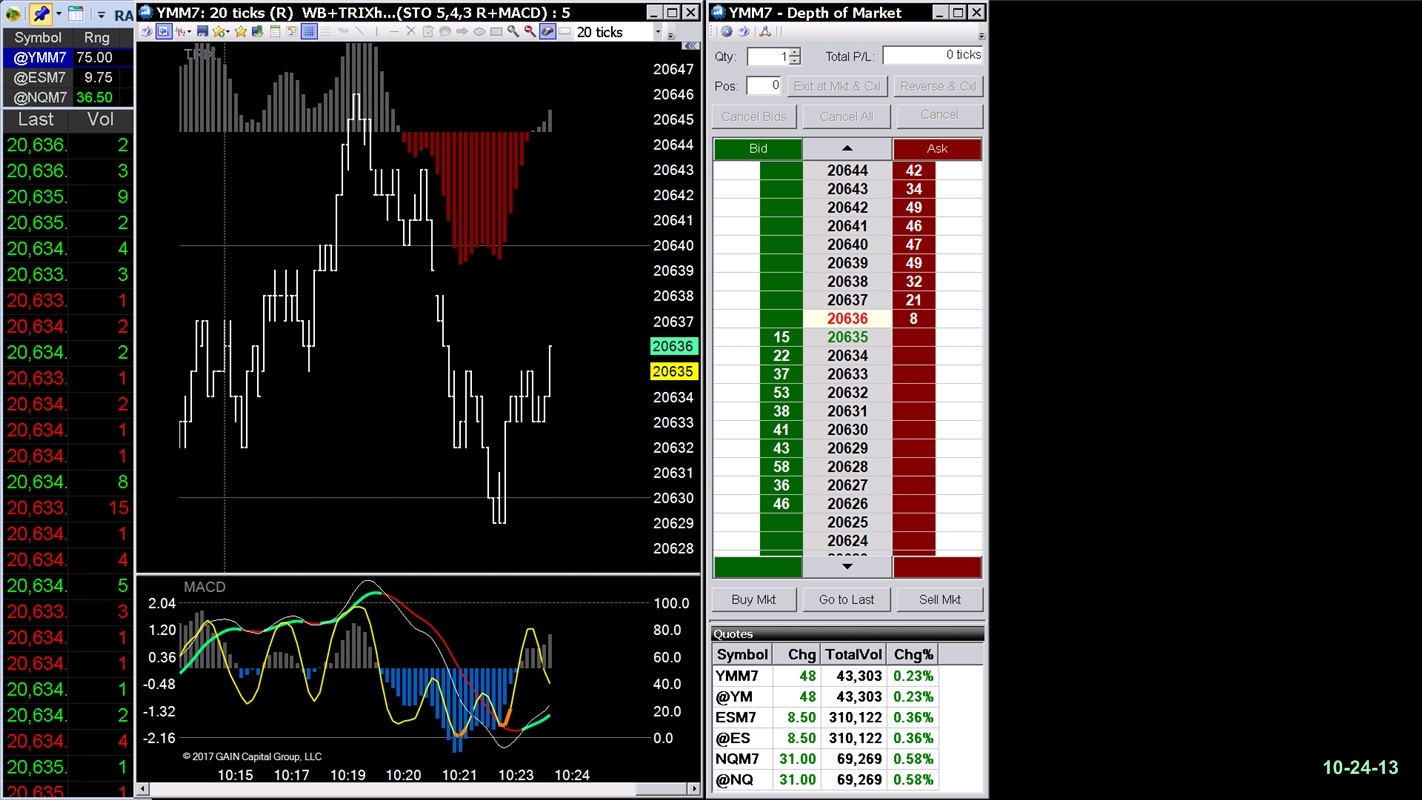
Zeroing in to the shorter term 60 tick shows a nice $150 per contract 2B run-up
that was not visible on the longer term minute based chart...

Tiny scalp using some favorite patterns and signals.
Also note the 3xDIV (histos, EMAs and stochastic) that was printing at the time of order entry (LH chart).
It helps to have multiple-monitors to spot opportunities
6 monitor chart layout:

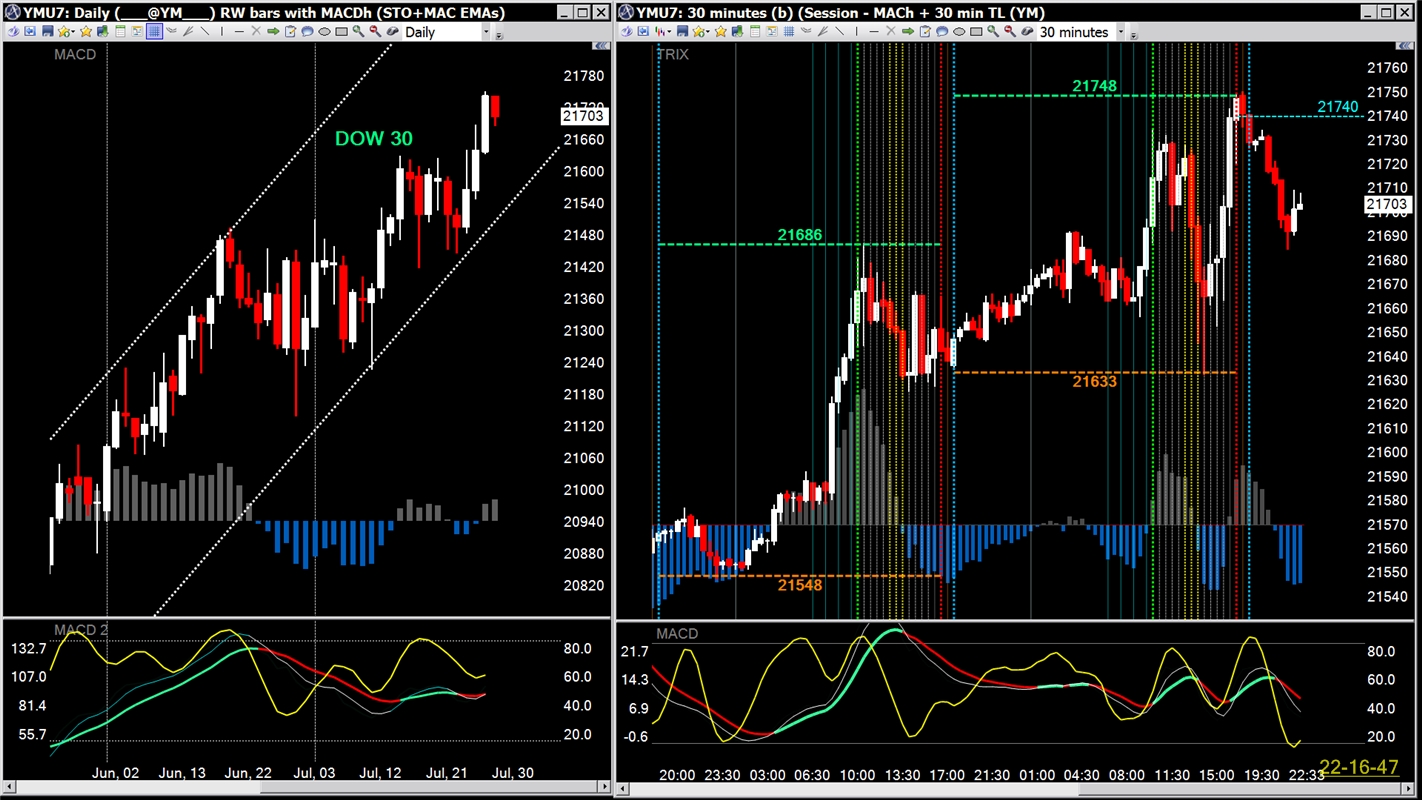
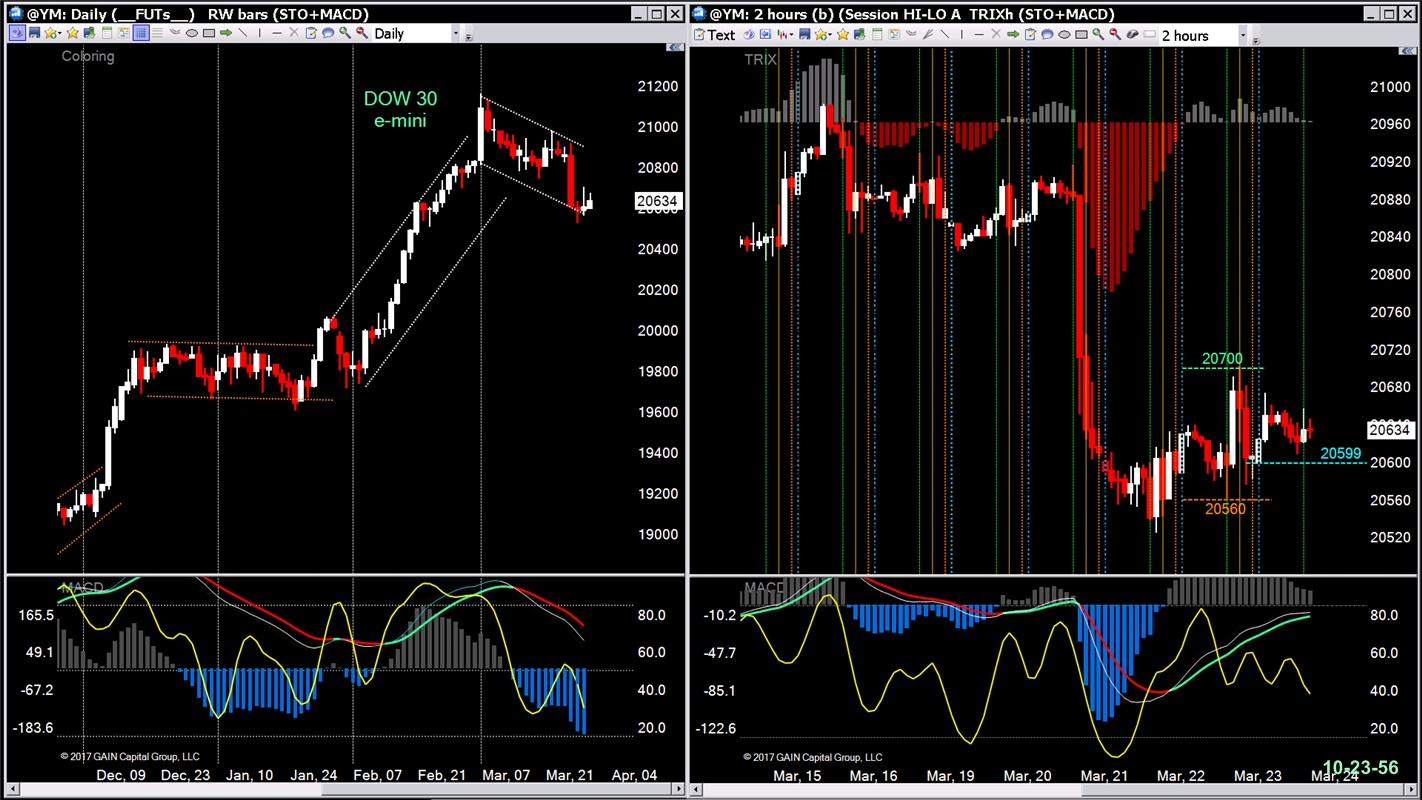
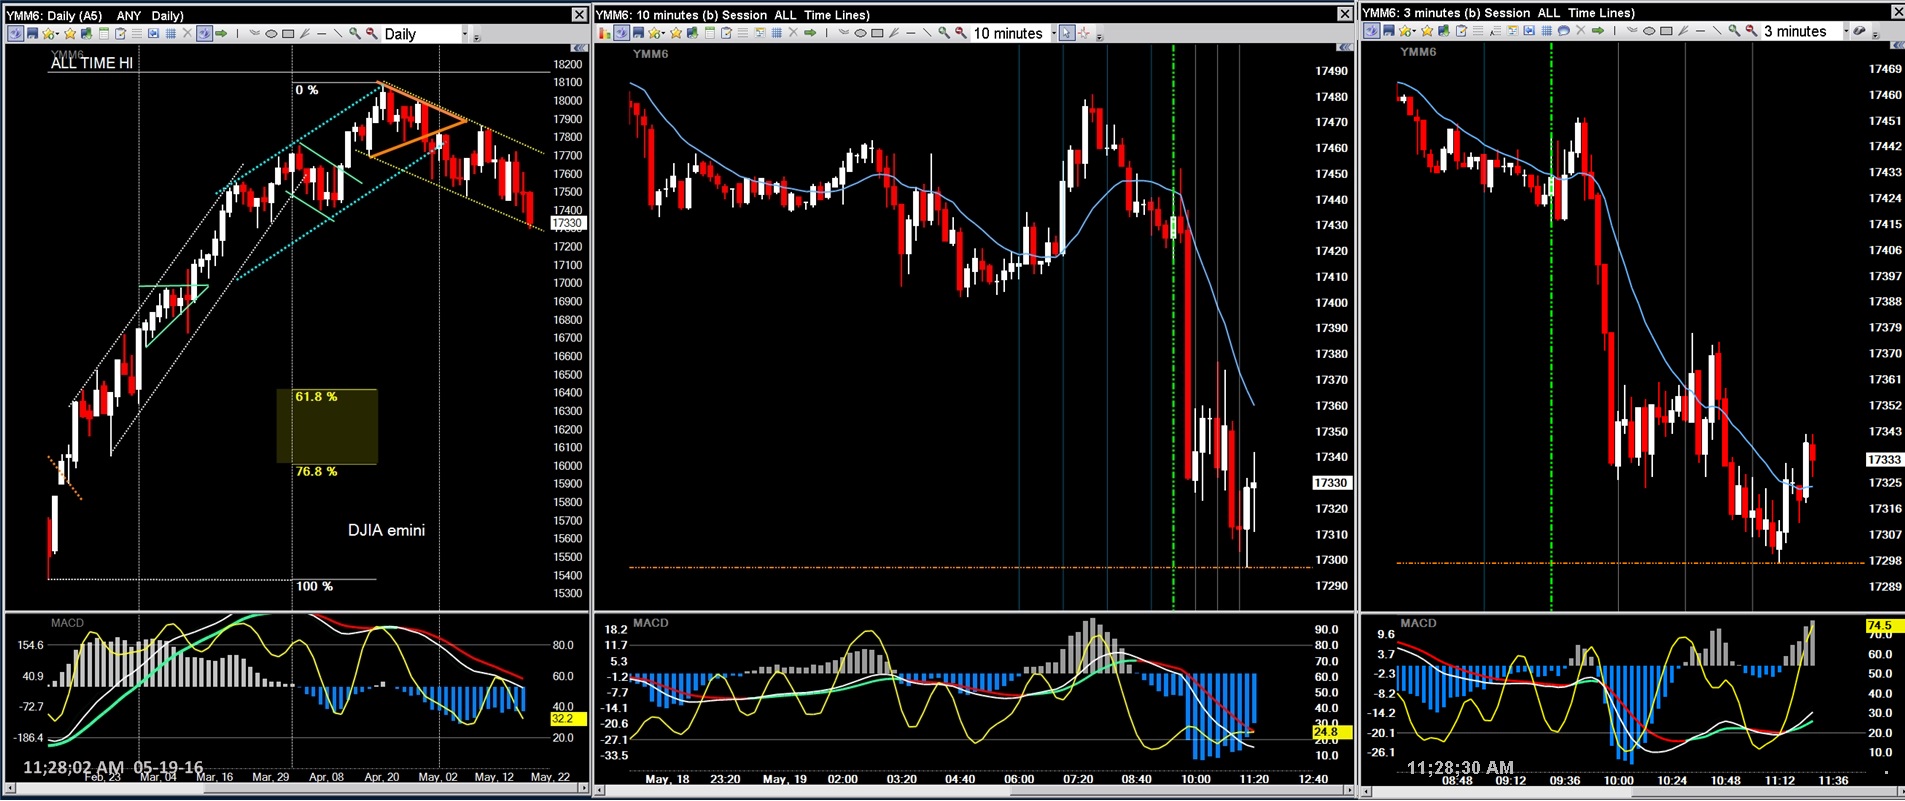
M 1 - Daily and 2 hour showing severals sessions or days:
M 2 - 1 hour, 2-3 sessions and 30 minute showing part of yesterday and today's session so far:

M 3 - 15 minute showing the major market current session from the open and 5 minute showing about 5 hours of the current session:

The lower monitors are for tick charts, each showing diminishing increments of the current session.
The two right hand charts are what I call T-Mode, for order entry...
M 4 - 60T

M 5 - 50T and 40T
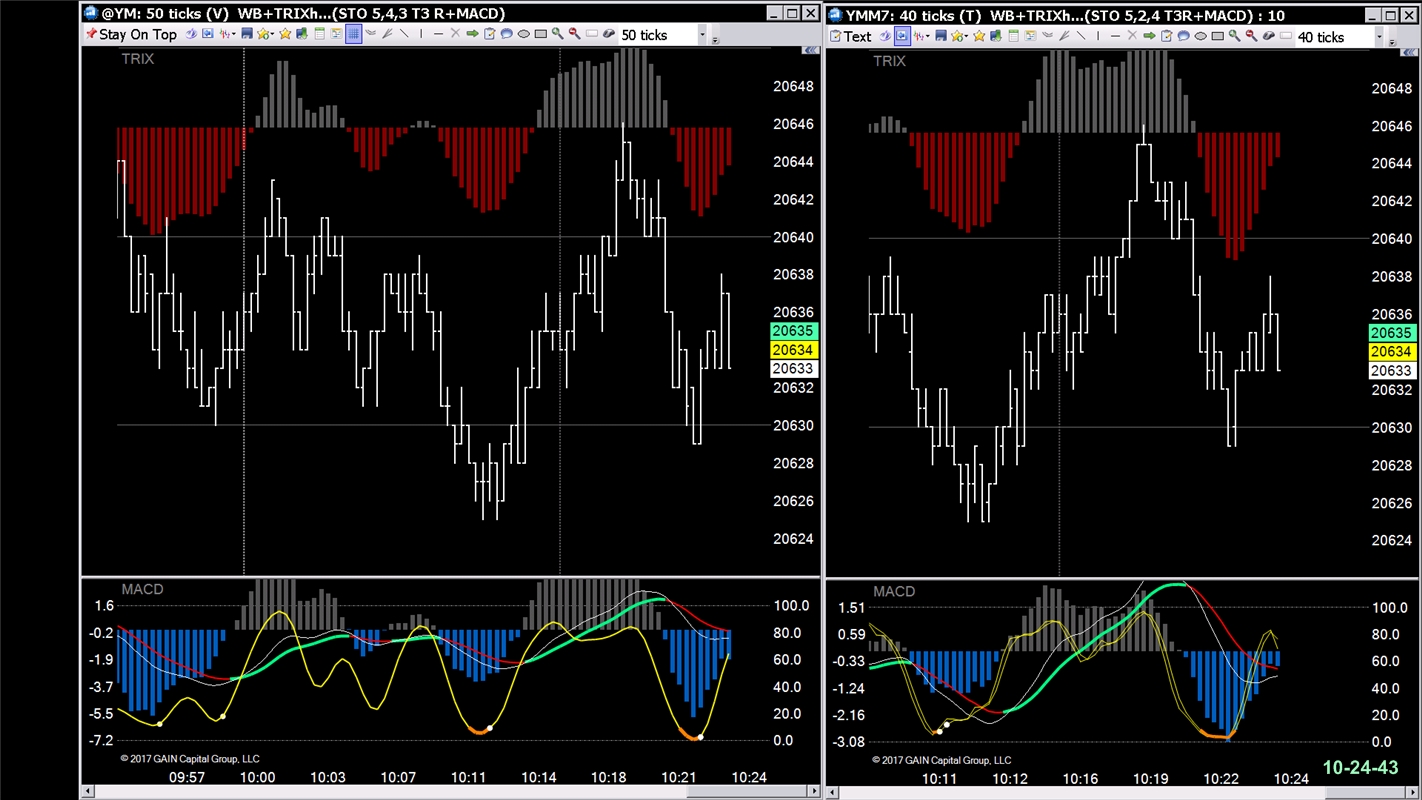
M 6 - Time & Sales, 30T (primary T-Mode chart) and DOM
You never can tell how far they'll run ...sometimes you can get a full meal...

Sometimes you just get a taste .../ 
2B Dragon patterns reverse down trends - - so this one should be called a Bat-Wing because it has formed in an uptrend.

Before the majors opened ... divergent 2B Dragon

ETFs - These things can go either way...
The 2B Dragon pattern
MJNA
Bought in @.1234
It's 2am Hawaii, I happen to be up thanks for the thoughts n' charts!!
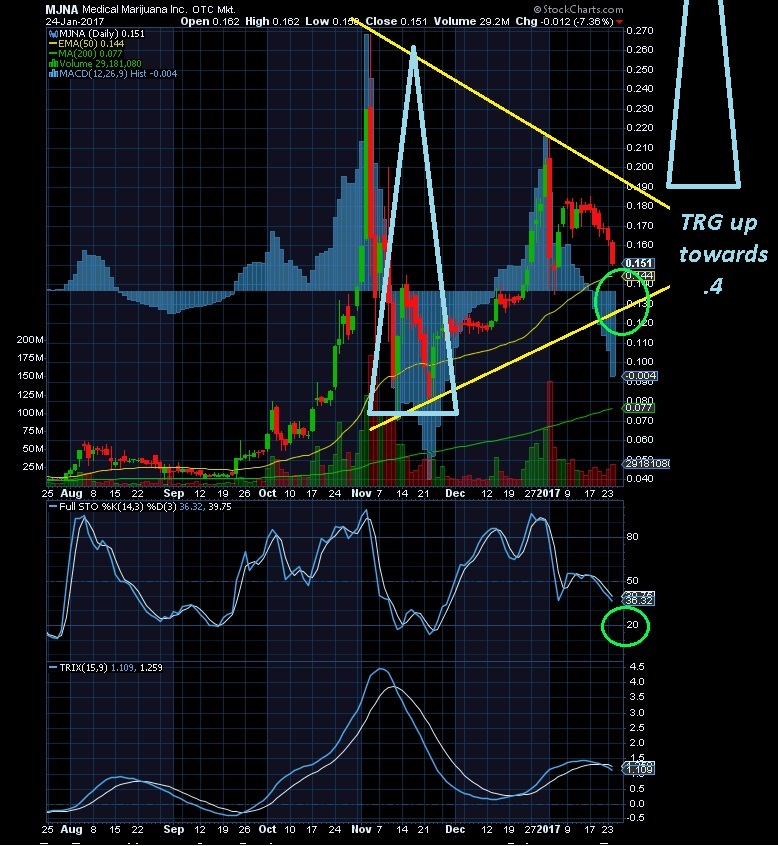
MJNA...big consolidation triangle formed...personally I tend to 'see' these patterns as bullish and expect the up trend to continue.
Could try an early entry, in the circled area as stochastic heads toward oversold (expecting the lower line to support price)
Or
Wait for the reversal of the current downtrend and enter after price action suggests it has indeed reversed and get on board for the breakout of the upper line...
I'd measure the potential breakout target to reach .4 ish
I stick with the idea of buying the dips...I first heard of this back in run up of the dot-com 'bubble'
(You probably are aware that my T/A bias is nearly always bullish - see the chart below for why )

Your gonna laugh at this one but....
MJNA
stairs with support, $.125-.15
Double bottom
Your chart and analysis would help
Following up with MT Slingshot continuation patterns
The 2B Dragon with 3xD on the indicators

BatWings are 2B patterns...just form at different places of trends

BAT-WINGs... not as reliable as 2B Dragon double bottoms

2B on the 15 minute & 5 minute reversed the session's trend.
_07-05-16.jpg)
_07-05-16.jpg)
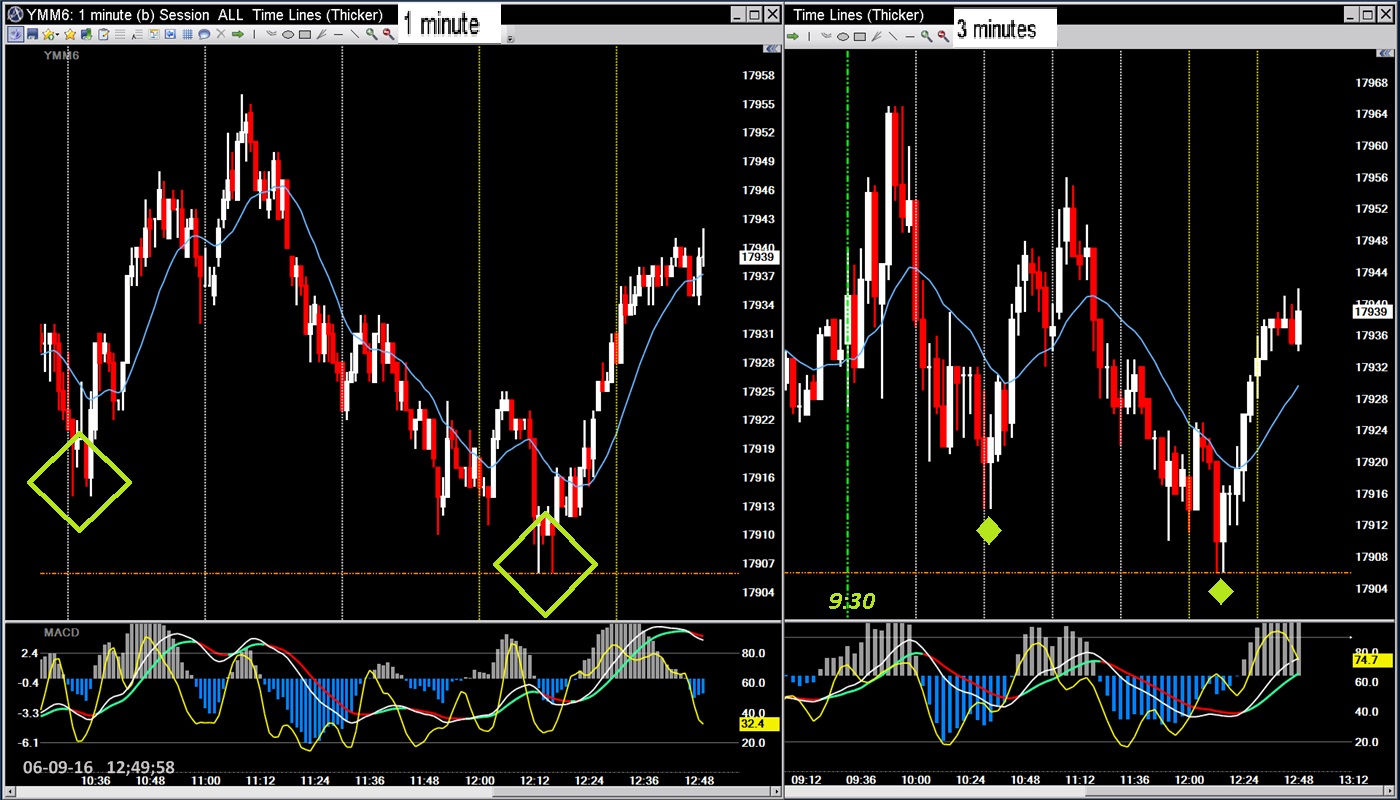
Another 'perfect' 2B Dragon with divergences on several different time frame charts...


Tweezers...calling them double bottoms may be stretching the description a bit.
That's why they have their own name.
Nice pairs of tweezers on the 1 & 3 minute charts.
2B patterns that work...perfectly

Time based vs Tick based - same price action pattern
but the Tick chart can get you in at a much better price...

2B patterns don't always work.
This is WHY STOPs are ALWAYs used...

Again, not a perfect 2B but good signals for a scalp
Double bottoms don't have to be 'perfect'
1 minute per bar..................................................90 ticks per bar

Beware Double Tops too...
|
Followers
|
9
|
Posters
|
|
|
Posts (Today)
|
0
|
Posts (Total)
|
353
|
|
Created
|
01/31/12
|
Type
|
Free
|
| Moderator sharpshorts | |||
| Assistants | |||
|
|

| Volume | |
| Day Range: | |
| Bid Price | |
| Ask Price | |
| Last Trade Time: |


