 News
News  Market Data
  Discover
Support: 888-992-3836
Copyright © 2023 InvestorsHub Inc.


Register for free to join our community of investors and share your ideas. You will also get access to streaming quotes, interactive charts, trades, portfolio, live options flow and more tools.
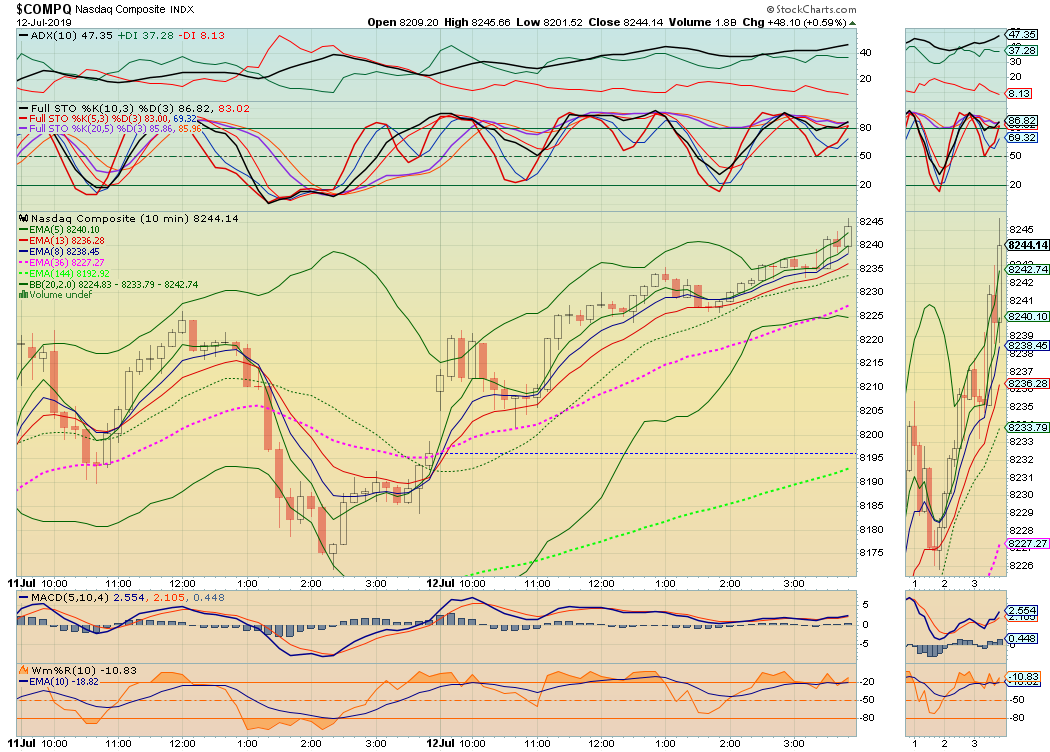
10 min chart settings
Pic saved in My Computer/Pictures/Screen shots
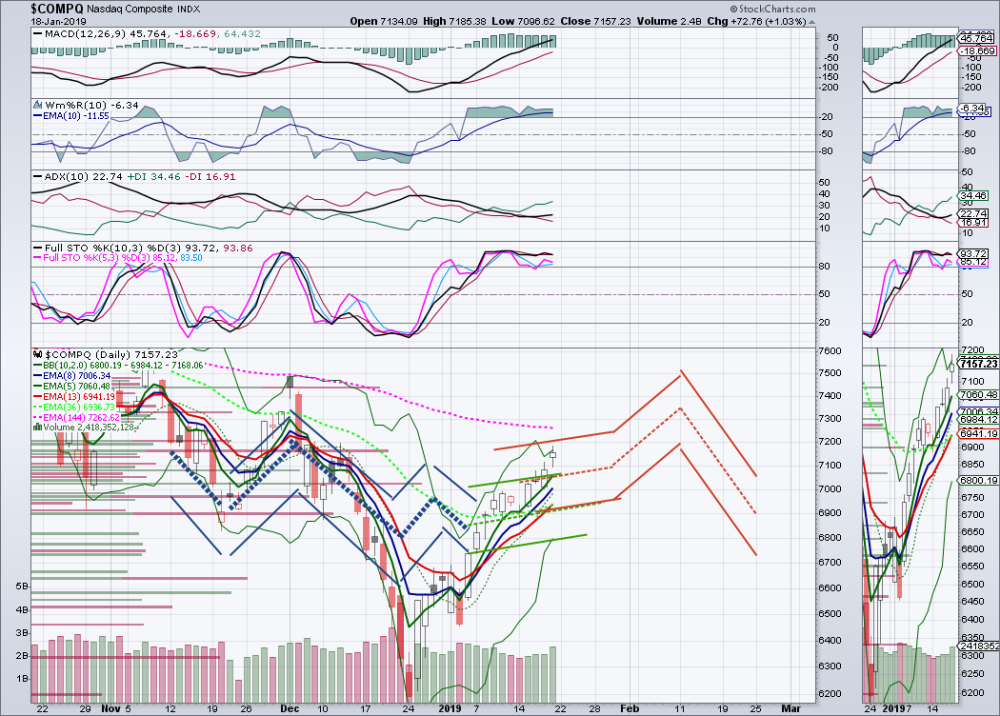
CompQ prediction ... I wasn't far off on my crystal ball vision ... I just added the red lines for where I think we go from here.
The Naz needs to get thru 7600 and I'll change my mind ... otherwise I see a brief channel between 7100 & 7500 on lower volume and then look out below.
Update ... After earnings the price to straddle on the NFLX monthly is $34.19 vs $53.55 last week so earnings costs an extra $19 .....
reply to:
TheFastOne Monday, 01/07/19 10:38:16 PM
Re: **D*A** post# 1290 0
Post # 1291 of 1300
Maybe I'll change the board name to We got no useful charts but we got a lot of useless information.
Trying to get a grasp on earnings effect on options. For comparison I'm using an in the money straddle.
NFLX has earnings on the 17th ...
Expiring on the 11th, a $315 call and a $320 put would cost $19.60
Expiring on the 18th, a $315 call and a $320 put would cost $40.65
Expiring on the 25th, a $315 call and a $320 put would cost $44.40
Expiring on the Feb 15th, a $315 call and a $320 put would cost $53.55
NFLX earnings ... Close on day before earnings .... Straddle would cost $30.75.
On morning after earniings, a straddle would cost $10.80 ... so the "premium" into earnings was roughly $20 to straddle.
That is still inflated ... last Friday a straddle would cost $7 on Friday AM.
Update-NFLX earnings this week
Here's another comparison ... using ask for in the money options ...
To straddle last week would have cost $16.15 (without earnings play)
This week it includes earnings so cost is $$34.90
Close on day before earnings .... Straddle would cost $30.75
This week NFLX is up $13 ... $340 calls were $15 on Fri close, now $21.20
That would be 40% gain Puts went from $14.75 to $7.50 roughly -50%.
Seems like the stock will need to move 10% on earnings to cover the cost of a straddle.
C reported today, I didn't look until mid-day.
The stock gapped down and rebounded strongly closing + $2.24.
A straddle would have made money if you knew to exit the puts at the open.
Before earnings ...
C @ 56.69 ... $55 monthly call @ $3.25 ... $57.50 put @ $3.40 Straddle = $6.65
Afterearnings ...
C @ 58.93 ... $55 monthly call @ $4.35 ... $57.50 put @ $1.30 Straddle = $5.65
So a marginal straddle if you exit right and cost of a monthly straddle dropped by $1.49 after earnings. (price for in the money call & put)
Before earnings ...
C @ 56.69 ... $56.50 WEEKLY call @ $1.64 ... $57.00 put @ $1.72 Straddle = $3.36
After earnings ...
C @ 58.93 ... $56.50 Weekly call @ $2.49 ... $57.50 put @ $.22 Straddle = $2.71
Still a marginal straddle if you exit right and cost of Weekly straddle dropped by $1.78 after earnings. (price for in the money call & put)
NFLX earnings this week
Here's another comparison ... using ask for in the money ...
To straddle last week would have cost $16.15 (without earnings play)
This week it includes earnings so cost is $$34.90
BBBY would have been a good straddle ... could have bought both sides for $1. They reported and the stock gapped up $2. The calls went to $3.30.
I think it is the exception, mostly because even going into earnings it was low premium.
C reports on the 14th ... it's a playable option, a little light on option volume but spread is low and return is better than most.
Right now C is at 55.50 so you could play at the money both ways for .76 each for the weekly, which expires on the 11th. And the monthly which expires on the 18th is 1.44c / 1.46p
Indicates it should be a cheap earnings play next week.
edit: the reason for lack of interest as an earnings play may be the fact they are within 5% of forecast in last 3 qtrs
I've only lost on straddles ... The interesting figure will be the Feb monthly ... the "earnings premium" should disappear. Right now the Feb monthly has to include the earnings premium and I believe it will disappear the day they release.
Based on info so far it seems NFLX would have to gap $16+ in order to break even.
I'll be tracking C, NFLX, INTC and FB as they release this month. I'm looking at the daytrade possibility on the day they release.
I like the idea. Please let us know how it turns out?
My experience in playing straddle/strangle spreads is mixed. It works really well when it works, but I usually find a way to screw it up. Either by taking profits too soon, or not soon enough on the winning positions.
I think if you get in early enough? You can avoid the premium jack up, but if the price moves out of the strangled position, it can lead to a big loss on one side. It could also lead to a big gain on the winner, but timing and execution of the sell is still critical.
Maybe I'll change the board name to We got no useful charts but we got a lot of useless information.
Trying to get a grasp on earnings effect on options. For comparison I'm using an in the money straddle.
NFLX has earnings on the 17th ...
Expiring on the 11th, a $315 call and a $320 put would cost $19.60
Expiring on the 18th, a $315 call and a $320 put would cost $40.65
Expiring on the 25th, a $315 call and a $320 put would cost $44.40
Expiring on the Feb 15th, a $315 call and a $320 put would cost $53.55
My assumption is playing earnings is expensive
No, Sir. I can't say that I've ever heard of firstrade?
I've had trouble opening my account with e options. They don't think I'm me, I can't figure out who the hell else would want to be me.
I'm looking into firstrade overall they seem pretty good with no fees at all for options. Know anything about them?
At one time, I would eliminate stocks and strategies that didn't work out. Eventually, I ran out of options. It's not necessarily what you trade. Any pos can be traded for a profit. Most importantly, it's WHEN you enter and sell the position that counts the most. GOOD LUCK! I can assure you, if it weren't for luck? I'd lose more than I already do.
You know the saying ... figures lie and liars figure.
I've always known that options pay more against the market, that is on an up day the puts will have a higher return and vice versa.
I think I can qauntify that. On a down day or an up day it will be close to 20% higher for opposite. On a day when it changes it will be a little under a 10% dif.
I can't quantify what happens on a flat day ... we ain't had any of those.
I used to lose money on that one all the time ... I looked at the numbers and it doesn't make the cut. None of the stocks that trade under 10 mil shares made the cut.
CAT daily - another highly liquid optionable stock that trades well.
There was an open gap! Amazing ... there's one more at 6400 level but I think the market turns up first and leaves that one open until next year
Been working on a 5 min chart ... I like these settings for the indicators
SPY is a good one. Plenty of volume and liquidity. Plays well by the chart.
Ever play SPY? Seems like everyone else does ... it's been added to my list as it seems better better index play than QQQ or VXX
CompQ ... an updated look
Click back for my original vision ... looks like I was a week off, below are same path moved back a week ... and my current vision.
Note ... there is an open gap at 6600
I thought the SPX would hold that trend line today but not tomorrow ... Now it looks like it has moved to the next channel down.
Hey buddy! was just looking at a few charts. I couldn't help but notice when looking at the 10 min chart you posted, the lows are higher.
$SPX&p=D&b=5&g=0&id=p95293579629&a=515502676&listNum=60" rel="nofollow noopener noreferrer ugc" aria-label="user uploaded image">$SPX&p=D&b=5&g=0&id=p95293579629&a=515502676&listNum=60">
Trying to hold the trend line ... I think it will for today but not tomorrow
Further observation on the 1 min volume by price bars.
I'm questioning the validity of it's existence. (Hell I question validity for my own existence) ... but
It's a real long bar in comparison to the other 99 bars and it comes from the trading between 3:39 and 3:45 pm. There are 3 or 4 candles at that price level. The total volume for those candles is about 200K and those candles are a bigger range than the price bar so some fraction of 200K is supposed to have generated that price/volume bar on a stock that traded 17m shares ... something is wrong with the picture
Something to watch on the one minute chart volume by price bars.
New toy so I'm still trying to figure out how to play with it. Appreciate any observations!
Volume by Price bars
Some thoughts on the new toy ... I like setting it for 80-100 on the parameter. As noted in the post I am replying to, they seem to be indicative of support and resistance. If you click back and look at the chart, the vol by price bars that were biggest are indicated by the blue dots, the green/red support lines are based upon ADX signals. I think the vol by price bars may serve as confirmation for other sources such as trend lines or those obvious pivot points in the past.
Now investigating their application on intraday. Only watched for one day but using a 1 day or two day 1 minute chart, they did show reversal points or channels for later in the day. Will keep watching for validity.
One observation is you need to mentally adjust for the number of times the stock travels thru the price ... meaning if the stock went up and down thru a price 4 times and made a long bar it is not as significant as the long bar traveling thru only once.
NVDA filled 3 of 4 open gaps from 2017 last month. A double bottom at 132.50 would be a good sign ... otherwise 105 for the 4th gap.
I try to avoid anything with reports coming ... they just screw up the charts for a few days.
I haven't looked at an earnings calendar in years ... since I'm adding NVDA and FB to my probable-play list I decided to look and then stumbled across AVGO.
Straddle plays on earnings don't work. The hidden dragon is the premium which is at a max before earnings and then a minimum after. To straddle you pay high premium on both sides and get none back. It takes a huge gain on one side to offset.
Something about guidance, and other things like that make a difference. I've even seen them sky rocket one direction, then take off the opposite.
All I know is, I'm not in it.
I've never heard of that one. I just googled it, and came across this. That sounds like a lot better advice than tying the two tails together and hanging them on a wire.
https://www.wikihow.com/Get-Your-Cat-to-Stop-Hissing
Even if I was following AVGO I wouldn't know ... too often I have seen good reports send a stock down and vice versa. And then there's the times a bad report sends it crashing and three days later it's up.
Earnings dates definitely affect the premium and reports definitely increase volatility.
If they have only been together for a few weeks, they may work it out. Just hissing is probably a good sign.
Cats seem to be strong Alpha or Beta and two Alphas will have trouble
There's a TV show "My cats from hell" by Jackson Galaxy, a cat whisperer. I used to watch it, I think he has advice on the subject.
Just noticed AVGO was trading at 242.48 in a/h. Does that mean they did okay on the e/r?
NVDA was one of my favorite trading vehicles, right before the last crash. It was at the $30 range, I liked it for the exact same reasons you mentioned.
Consider it done, and thanks for the recommendation.
Have you ever had a cat, got another one, and the two didn't get along?
Actually one does, the other just hisses. What do you do about it?
I think a definite yes ... NVDA is ranking at the top of my analysis based on daily range and return. That statement also holds true on the monthly's
Good to know, thanks for the heads up.
No, should it be?
[iIs NVDA on your playlist?]
Just noticed AVGO reports earnings tomorrow after the bell
BABA had that same last candle ... It replaced BIDU on my list
Is NVDA on your playlist?
|
Followers
|
3
|
Posters
|
|
|
Posts (Today)
|
0
|
Posts (Total)
|
1303
|
|
Created
|
01/13/12
|
Type
|
Free
|
| Moderator TheFastOne | |||
| Assistants **D*A** | |||
| Volume | |
| Day Range: | |
| Bid Price | |
| Ask Price | |
| Last Trade Time: |


