 News
News  Market Data
  Discover
Support: 888-992-3836
Copyright © 2023 InvestorsHub Inc.


Register for free to join our community of investors and share your ideas. You will also get access to streaming quotes, interactive charts, trades, portfolio, live options flow and more tools.
Hi, what is kensey website?
Trading Oil and the markets using HES
http://stockcharts.com/h-sc/ui?s=HES&p=D&b=5&g=0&id=p83288110377&listNum=51&a=296304227
Using HES as a market indicator
The oil and gas complany Hess (HES) works very well as a market indicator for both trading bonds (TMF, TMV) and the general market (SSO, SDS). Here is the daily chart. Open to weekly for a broader view and to the 2 hour for fine tuning entry and exit points.
http://stockcharts.com/h-sc/ui?s=HES&p=D&b=5&g=0&id=p23461881973&listNum=51&a=296290212
And Happy St. Patrick's Day to all those who may have been bitten by snakes and moved on to other boards.
Useful SPX 5 min RENKO with SSO SDS
http://stockcharts.com/h-sc/ui?s=$SPX&p=5&b=5&g=0&id=p62381071038&listNum=49&a=295516118
Great chart template for any stock/etf
in any tiime frame
http://stockcharts.com/h-sc/ui?s=$SPX&p=W&b=5&g=0&id=p12877272630&listNum=39&a=294859474
Another market update. Thanks Foot!
http://stockcharts.com/public/3421479
Todays market update.
http://stockcharts.com/public/3421479
RED ALERT!-----CBOE SPY EOD BIG 3/1 P/C----SPX BIG 2/1 PC---!!!!-----------GOOD CALL FOOT!---!!LOL!!
Anyone have any idea how this NYMO confirmation (or non-confirmation as in this case) indicator was created?
This was the attached caption:"NYMO crossed above lower BB last Friday, but it was unconfirmed by black line (as seen in red circle). Normally, the black line would reverse its direction when spx gains of > 10-pt within a day, but last Friday was one of those very few exceptions. So, bulls should be cautious because black line tends to be quite reliable to show the real movement of spx."

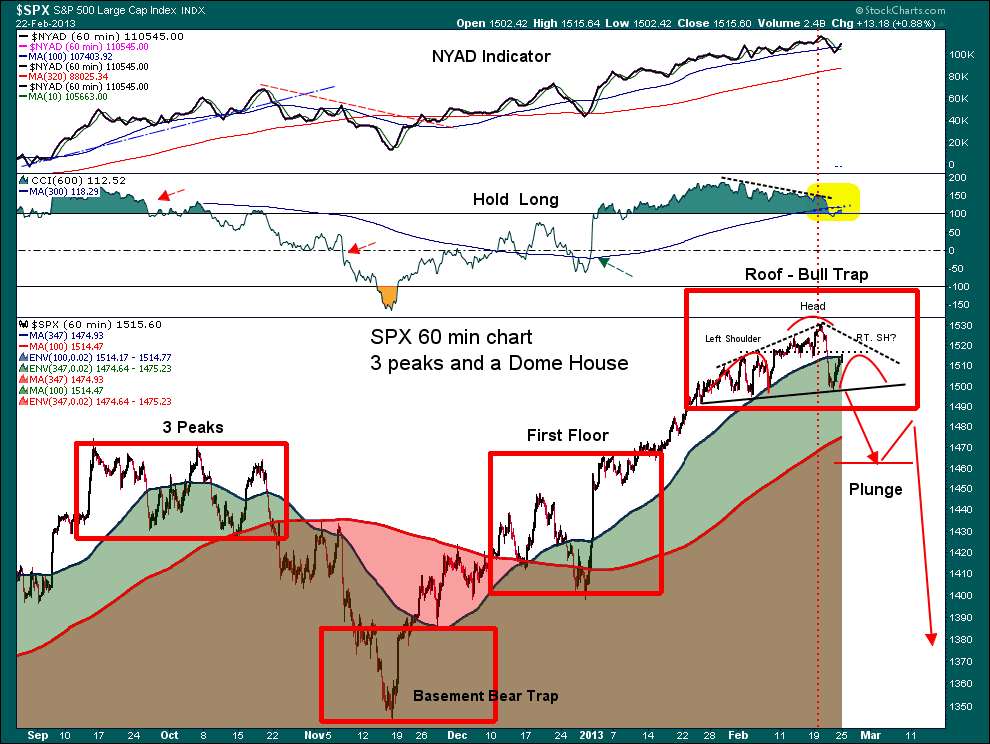
Feb 25th - Monday - Market Outlook - Possible 3 Peaks a Dome Top - Bull Trap - See the SPX chart on page 1 - rare occurance
The UK Bond Rating gets cut from AAA to Aa1 by Moody - 5 pm Friday - Good timing :) The Pound drops like a Rock
NEUTRAL SIGNAL - DISTRIBUTION PHASE - The markets did what they always do, take things to the limits in the Dow, SPX and Russell, with a nice bounce closing at resistance. The S&P 500 had a kiss of death at the close, as price kissed the back trend line. This last gasp up in my opinion is the professional shorting the market as price gets marked up. Volume on the Russell 2000 and the S&P 500 was pretty pathetic after huge price destruction on volume for 2 straight days. We are in the distribution phase so this is when it is generally a good time for day traders. The first chart on page 1 through the histogram illustrates the 9 month cycle low to cycle high which is coming up next week. The effect of downgrading the UK Bond Rating on the Pound vs. the $USD / EURO will be something to monitor. The EURO is sitting on major MA support and jumping the fence would cause a major rise in the US Dollar. The effect of a strong US Dollar has a negative effect on the Dow and stocks like AAPL who do a lot of business internationally. The US Dollar climbed 2 cents above the Nov. high at Friday's close, implying higher prices in the $USD. Friday's close of 1515 SPX makes a nice right shoulder of a Head and Shoulder formation. A break of Thursday's low will give us a target of 1464 See the chart on pg. 1. Another chart to look at is on pg. 2, the SPX Weekly chart and the relationship of the RSI 70 and tops. . The NASI indicator gave a major sell signal Thursday. The NAMO turned over Thursday and the Daily NYAD had a negative crossover. Leadership, which has been the banking sector, did some major distribution this past week, see the Banking chart on pg 2. I have put a few of the A-B & C-D charts along with the SPX Bearish Butterfly on Pg. 1 & 2. These have the projected down moves. Gold bounced a little today with the target met with the Symetrical Triange. This buying is likely the covering of shorts, and not real buying. Like the Indexes, anytime you have rapid price destruction, you generally have to wait for the moving averages to give support. The strong $USD effect on Gold is on page 2. If on Monday we spike higher with the $USD, Gold could break down hard. Take a look at the Unleaded chart on pg 2. The relationship between Tops in the market and unleaded gas tops are telling.
Euphoric stage: The AAII Sentiment Survey for Feb 21st Bulls 42% and Bears 32%. The Fund Managers Survey - NAAMI recorded an all time high two weeks ago with a 104%, net long response. Byron Wien from Blackstone said on 2/6 that he expects a 1st half correction of 200 points in the S&P 500 or 1300. Goldman downgraded its view on global equities over the next three months, to "neutral" from "overweight".
The leaders in the markets are the Russell 2000 and the Financial sector charts. I have these on page 1 showing buy and sell points using the SCTR indicator and what you should look for when you are buying or selling indexes like the Russell 2000 . Tops take a lot longer to form than bottoms, so this chart will help you trade. Financials have been leading since Ben announced the 85 Billion a month buy of MBS. To find the ratings click on "Free Charts Tab" and then click on SCTR on the right side of the page. The employment report and turn of month are next Friday.
The 1,5,15,30 minute charts are more for intraday trading only. Tradable Shorts or Long are not recommended to hold overnight.
DOW - Hold Short below 13957 - Tradable Long Above - Hold Long above13970
SPX - Hold Short below 1515 - Tradable Long Above - Hold Long above 1516 VIX - Euphoric
NASDAQ - Hold Short below 3166 - Tradable Long Above - Hold Long above 3180 NYUD - Sell Signal
QQQ - Hold Short below 67.24 - Tradable Long Above - Hold Long above 67.60 NYAD - Buy Signal
RUT - Hold Short below 917 - Tradable Long Above - Hold Long above 917 NAUD -Buy Signal
GLD - Hold Short below 153.01 Tradable Long Above - Hold Long above 157.38
Think Tank
Testing, testing.
Are you missing in action? Hope all is well as your daily updates are missed. Great call on the 20th, any follow through expected? TIA!
Good Call Foot!-------SPX 15 min fell right out of the channel!-----CBOE EOD----SPX P/C 2/1 Plus------SPY P/C 2/1 Plus!-----All in on break SPX 1492!---It begins!---!!LOL!!
Feb 20th- Wednesday - Market Outlook -
SPX SELL SIGNAL AT THE END OF THE DAY. SEE REASON BELOW ..... A-B C-D Charts SPX & Russell - Bearish Butterfly SPX Charts Pg. 1 and projected moves? GOLD Hits ABC Down Target Chart heading for symetrical triangle target on Pg. 2?
HOLD LONG IS THE SIGNAL IN ALL INDEXES - BUT WE HAD A SELL SIGNAL IN THE SPX - When the price in any equity or index goes over the upper BB on the daily chart and also over 70 on the RSI. -This rarely happens, but the same thing happened in the SPX in September and the reversal dropped 8.9%. (See the chart on pg. 2). - A move down of 8.9% would be a test of the 200 SMA at the 1395 ish level. The weekly chrrt is close to a RSI 70 reading which if you look at the chart on page 1 you willl see how that reading and major tops play hand in hand. The Fed minutes come out today, so that may be the stimulus for the down move in the markets. The VIX went to a yearly low of 12.18 and now there is a bullish triangle that has been fromed, so the stars are lining up. The Euro is set up to jump the trend line down, so that may be the event to take the markets down Wednesday, if this is truly a TOP. The Banking index is getting close to crossing the Bullish Percent, marking a possible TOP in the markets, (see Bank Chart SCTR on pg. 2). The Banking sector has led the markets up with the Fed buying of MBS. The new home sales have cooled off and with the rise in gas prices, consumer confidence and retail sales ex gas will like do the same See chart on pg 2. The Russell 2000 passed the required 1.618 number with contracting volume, so the AB CD is complete and this should be close to a TOP. I have put a few of the A-B & C-D charts along with the SPX Bearish Butterfly on Pg. 1 & 2. These have the projected down moves. The NYSI isn't moving higher with this upper consoldation and is getting closer to a MAJOR TREND CHANGE on a daily basis (see page 2). This lines up with the possible TOP in the SPX. The TLT 20 Yr Bond has a Bullish Triangle on the daily charts and looks like a major move up on Bonds will occur soon.
Euphoric stage: The AAII Sentiment Survey for Feb 14th Bulls 42% and Bears 29%. The Fund Managers Survey - NAAMI recorded an all time high two weeks ago with a 104%, net long response. Extreme levels on everyone of my top indicators, so you have to wonder if this will be a snow ball effect on the downside, with the lack of shorting and Bears, when the market retreat. Byron Wien from Blackstone said on 2/6 that he expects a 1st half correction of 200 points in the S&P 500 or 1300. Goldman downgraded its view on global equities over the next three months, to "neutral" from "overweight". Inflows into long term mutual funds dropped drastically the week of 2/6 down to 683 million after starting the year with over 7 billion. Much of the 7 billion was pulled out in December and then applied with the huge gap up at the begiinning of the year. If we should get into that gap, there is little support under gap support.
The leaders in the markets are the Russell 2000 and the Financial sector charts. I have these on page 1 showing buy and sell points using the SCTR indicator and what you should look for when you are buying or selling indexes like the Russell 2000 . Tops take a lot longer to form than bottoms, so this chart will help you trade. Financials have been leading since Ben announced the 85 Billion a month buy of MBS. To find the ratings click on "Free Charts Tab" and then click on SCTR on the right side of the page.
The 1,5,15,30 minute charts are more for intraday trading only. Tradable Shorts or Long are not recommended to hold overnight.
DOW - Hold Long above 13989 - Tradable Short Below - Hold short below 13973
SPX - Hold Long above 1522- Tradable Short Below - Hold short below 1515 VIX - Euphoric
NASDAQ - Hold Long above 3198- Tradable Short Below - Hold short below 3181 NYUD - Buy Signal
QQQ - Hold Long above 67.94 - Tradable Short Below - Hold short below 67.64 NYAD - Buy Signal
RUT - Hold Long above 924 - Tradable Short Below - Hold short below 915 NAUD -Buy Signal
GLD - Hold Short below 159.63 Tradable Long Above - Hold Long above 156.91
Top Call Think Tank
Hey Foot!------Fools following Fools!------Back with the living somewhat!-------Nice Bearish Butterfly patterns!----have seen big bucks made on those( da charts.com)----over the years!----metals getting crushed! Amazing!------Perhaps there leading the way down?-----Do you remember the Russian Blog on Stock Charts long long ago when they forcasted SPX TRIPLE TOP?----Who knew!--------I think we are going to view the big bang theory in action!---Watching SPY---SPX----for P/C-----they will give the signal------got to be getting close!----!!LOL!!
GS got caught with their hand in the cookie jar
POMO Tuesday through Friday- Dow Jones World which has over 3000 stocks is turning over... When the Battleship with the Dow Jones World turns those little cruisers with 30 Dow Stocks will have nothing left.... Dollar will rally, Gas prices soaring, gold prices collasping, so the world is turning upside down and don't think the Fed can get in the way of it... GS news may send the banks down that led us up... I had to laugh at Greenspans comments on Friday, talk about a talking head that know nothing LOL.. Anyway, had the flu once. Tough way to live for a couple of weeks.
NR5------Foot --Do you remember the rules on narrow range Days?-----Will coincide with your Max Bullish reading-----Probably with a fall!-----R3s still in play thru Tuesday!----Mom brought the flu home from school last Friday---its a bad one----first time sick like this 20 yrs----recouping well though-------was hoping for big put count to short going into weknd-----nada!-----will keep powder dry till nxt week!-----Have a nice weknd!---------!!LOL!!
re projected move 2 charts
NICE TOP CALL!!----SPOOS CLUES-----R3s Galore----CBOE EOD SPY--392kPUTS/92kCALLS------NDX--13kPUTS/3kCALLS-----SPX 500k Plus PUTS-----Will watch for some OEX PUT action for Friday!----Tally HO!-----LOL
LOTS of Insider selling being reported------SPX 1520P-----LOD 2.75------HOD 6.00!-----Getting some action!----TVIX LOD 4.44-----HOD 4.59----Mr Market getting Tired?-------On P/C watch---will report!-----R3s WERK!!-----TKS-----!!LOL!!
Top Call
It has to close under 1518 to verify
Beating the pesky UVXY
http://stockcharts.com/h-sc/ui?s=UVXY&p=30&b=5&g=0&id=p42951241392&listNum=48&a=291698110
Works for XIV too.
RE: Gartleys------Nice Gartleys-----should see more P/C verifications soon---R3s have 2 to 3 day window-----Big slim jim today----good werk! lol
HEY FOOT!!-----R-3s---CBOE EOD SPX 486kP/111C----OPTIONS CLEARING EOD NDX 5K/1K LOL
Weekly chart hitting top of trading channel
http://stockcharts.com/h-sc/ui?s=$SPX&p=W&b=5&g=0&id=p13879038914&listNum=45&a=292270643
See signals on chart.
Also, try as daily and monthly.
Thanks spdpro. I'll give it a try later.
image code, IMG code > Left click "copied"
put in post > Right click "paste", Left Click
DONE
How do I post from Photobucket?
* Posting Images (Photobucket.com)
When using photbucket.com, you need to use the second string of code from the top of the list, it's the one labeled:
URL Link
Copy the string of code starting after the "http://"
And beginning with the i as in: i###...
Now place this between the chart tags: [-chart]i###sample...[/chart-] (without the dashes)
... Gary
Jan 30th - Wednesday - Market Outlook - It's all about 14,000 Dow - Employment Friday - Nose Bleed RSI on all indexes - Mid to High 70's
TOM - Turn of Month influence, Bradley Major Turn Date Today - Consumer Confidence dropped 8 points - FED meeting Wed.
HOLD LONG IS THE SIGNAL IN ALL INDEXES - The same disclaimers with all the overbought and high RSI comments. Looks like the old charge to 14,000. The last time we hit that number there was great Fed involvement in July of 2007. At the time, we started from a low of Dow 13259 and ended at 14021 in 21 days. Deja Vu all over again as Yogi would say. The old rally into earning, hit the big number and then sell off??? The main difference was that the Banks broke their 50 day MA and the rest was history. We are on 19 straight days of the markets buying the highs (See the NYHGH indicator) and the NAHL indicator, which has consistancly hitting what is normally a Top in the markets. The S&P had a bullish ascending triangle on the 15 min charts and broke above 1503.28 and has a new target of of 1515 SPX. That would line up with Dow 14,000. The Euro ignored the previous bearish formaton and was up today. The US Dollar has basically gone no where this year, it is currently 10 cents below the beginning of the year and has had no effect on stocks at all. The Transportation index continues it's parabolic move with a RSI a on the daily chart at 86 and the Russell has a 77 RSI . The NYAD chart on page 2 RSI dropped to 79 today, showing gerneral weakness inspite of the Dow and SPX climb. . The amount of stocks over the 200 day MA are at 82%. Most Indexes are fairly parabolic so that generally marks a TOP in the market. Sounding like a broken record with the same commentary for a week now. :)
The Major Turn Date is today + or - 4 days. 1486 on the S&P 500 would be the first target on the downside. The next targets down would be 1474 and 1448 on the SPX. Gaps support may be the over all target. Bears need a close under 868 on the Russell and 1448 on the SPX, which is gap support.
The AAII Sentiment Survey for Jan. 24th Bulls 52% and Bears 23%. Extreme levels on everyone of my top indicators, so you have to wonder if this will be a snow ball effect on the downside, when the markets retreat.
Apple is now on it's way to 378 with the ABC Down. AMZN missed UP $20. Consumer confidence dropped hard with the 2% increase in taxes. Confidence dropped from 66 to 58% which the market blew off with it's move towards 14,000.
The 1,5,15,30 minute charts are more for intraday trading only. Tradable Shorts or Long are not recommended to hold overnight.
DOW - Hold Long above 13887 - Tradable Short Below - Hold short below 13690
SPX - Hold Long above 1501- Tradable Short Below - Hold short below 1487 VIX - Neutral Signal
COMP - Hold Long above 3148 - Tradable Short Below - Hold short below 3130 NYUD - Buy Signal
QQQ - Hold Long above 67.03 - Tradable Short Below - Hold short below 67.03 NYAD - Buy Signal
RUT - Hold Long above 904 - Tradable Short Below - Hold short below 893 NAUD -Buy Signal
GLD - Hold Long above 162.17 Tradable Short Below - Hold Short below 160.77
Think Tank Charts
Santelli Rant

north,
If you can remember the sixties, you weren't there.
To bad they didn't get stuck in the 70's, now those were the good old days.
da cheif, ur welcome, I was hopeing someone read that post.
Interesting Daily Kagi SPX chart
http://stockcharts.com/h-sc/ui?s=$SPX&p=D&yr=1&mn=0&dy=0&id=p13060701933&listNum=45&a=289818912
The Weekly View
Current weekly sell signal is a close below 1444. Also, see the %B sell signal line. One can use this same chart on shorter time frames. I like the 2 hour version.
http://stockcharts.com/h-sc/ui?s=$SPX&p=W&yr=1&mn=5&dy=0&id=p95329208000&listNum=43&a=289549775
Expect_MostAll_General_Indices_to_have_MajorMoves_within_Next_2_Trading_Days_(Friday_or_Monday).
per
ALERT_Both_McClellan_Oscillators_(NAMO_&_NYMO)_had_SmallChg_at_Close_today_Thursday.
Only exception to Today's Alert is if we have another McClellan Oscillator small change on Close either Friday or Monday.
No direction is given by these signals. You must discern which direction this MajorMove might occur.
================================================================
McClellan Oscillators and Summation Charts
================================================================
Below are Chi2's charts
McClellan Oscillators (NAMO & NYMO) Charts
http://investorshub.advfn.com/boards/read_msg.aspx?message_id=71113863
McClellan Summation Indices (NASI & NYSI) Charts rev09/15/2011
http://investorshub.advfn.com/boards/read_msg.aspx?message_id=671423
Thanks snoot. I could not replicate that chart. Appreciate it!
1474 is the 12 month high. This is either on heck of a distribution pattern and a whopping bull flag. I am leaning toward the later, but it sure is taking it's time.
E, That must be Foots chart I guess. Here it is with a wider timeframe that you can load up
http://stockcharts.com/h-sc/ui?s=$TICK&p=60&yr=2&mn=6&dy=0&id=p81270092098&a=239073236&listNum=1
I have been watching this chart and was looking for a pullback as such, but futures say bull flag will be broken to the upside.
OBV holding above the redline. 30 min oversold, 60 min not quite.
you are not alone.
that's 3 of us in TZA here, 12.24 in heavy load
E
I think that's a good move. I took a jab at some TZA also. I looked over my stuff and believe we're ready for some back filling.
Good Trading
Bought some SDS here.
Expect_MostAll_General_Indices_to_have_MajorMoves_within_Next_2_Trading_Days_(Friday_or_Monday).
Per
ALERT_McClellan_Oscillator_(NYMO)_had_SmallChg_at_Close_today_Thursday.
Only exception to Today's Alert is if we have another McClellan Oscillator small change on Close either Friday or Monday.
No direction is given by these signals. You must discern which direction this MajorMove might occur.
================================================================
McClellan Oscillators and Summation Charts
================================================================
Below are Chi2's charts
McClellan Oscillators (NAMO & NYMO) Charts
http://investorshub.advfn.com/boards/read_msg.aspx?message_id=71113863
McClellan Summation Indices (NASI & NYSI) Charts rev09/15/2011
http://investorshub.advfn.com/boards/read_msg.aspx?message_id=671423
| Volume | |
| Day Range: | |
| Bid Price | |
| Ask Price | |
| Last Trade Time: |


