Register for free to join our community of investors and share your ideas. You will also get access to streaming quotes, interactive charts, trades, portfolio, live options flow and more tools.
https://lucamining.com/2024/02/luca-mining-announces-final-commissioning-phase-at-the-tahuehueto-gold-mine-and-the-appointment-of-new-director/ love it ! “With the second mill commissioned, production will then progressively ramp-up to 35,000-40,000 oz gold equivalent per year” !!!
$Lucmf (Two operating mines) ! Awesome value at .23 soon to be a mid tier mining company! #Gold #Silver #Copper !
NYMEX gold/oil real time quotes
http://nymexdatardc.cme.com/
article on CB gold sales
http://www.resourceinvestor.com/pebble.asp?relid=31420
Blanchard analysis-Central Bank Gold Sales
Out of the office starting later this afternoon to begin the holidays and hope that everyone has a great vacation. We're going to have a few data points out on Friday that should move markets…on Monday. Markets across the globe except for the Treasury market that has some note auctions on Friday will all be closed.
So why's the precious metals market heading higher today on seemingly little bullish news?
For the same reason the market wasn't performing the last three weeks. The selling pressure from bank sales has abated and precious metals have become a more direct reflection of market circumstance we're currently seeing.
Been running some figures on the recent ECB sales and thought you'd like to see them, consider this the extended note before the vacation!
Since they announced their selling program with the CBGA II signing, the Bank of France has sold 380 tonnes of gold (using rough numbers total is actually 379.85). When they signed the agreement in 2004, they announced that over the 5 years of the 2nd agreement, they would sell 500-600 tonnes of gold.
By my calculations, they've got 120-220 tonnes of sales left to push out into the market over the next 28 months of the 2nd agreement to reach the low or high end of their announced sales. Broken out that's 4.2 to 7.8 tonnes of sales a month. Sales have averaged 26 tonnes a month in the latest CBGA II fiscal year. We believe that number is set to fall drastically.
Switzerland's done with their selling program, the Bank of England didn't even sign the 2nd agreement, Spain and Portugal seem to be finished selling after dumping millions of ounces on the market in the last two years, and the Netherlands are finished their announced sales as is the Bank of Denmark.
France is the only announced seller left out in the market of any size. Other banks are certainly selling a tonne here or a tonne there, but France is the only bank transacting in any volume. Germany has said they won't sell any gold reserves in 2007 and have yet to decide about 2008. Italy has made no announced plans to sell and has not sold one tonne of gold over the life of both agreements (I'd have to say knowing the little bit I do about their cash management acumen and fractured governmental system, any agreement on selling from them is remote).
So…what's it all mean?
In my mind, it means we've got one remaining seller left out in the market of any size who was more than likely behind the major sales in the last 3 weeks. We'll get an update on who sold the gold in a month. It also means that after purging over 11 million ounces from their reserves in two and a half years, the Bank of France is nearly done with their announced program and only have between 3.8 to 7 million ounce left to sell.
Unless Germany makes an announcement about 2008 or Italy changes their routine and begins selling, there are no more captive ECB banks who either have any gold sales announced or own enough gold in reserve to transact at the same levels that France has been selling in the last 3 years.
We're not only going to see CBGA II sales miss the mark this year by over 150 tonnes, we're going to see CBGA II sales for 2008 and 2009 miss the mark by 200-300 tonnes each. Supply side thoughts for further down the road, but one that is looming very large on the horizon. We're talking another 6-10% drop in both 2008 and 2009 in supply into the market.
We've seen significantly lower mine production in the last five years, we've watched 75 million ounces of gold get dehedged off of the market (with 40 million left to go), investment demand has picked up some(we still believe it will grow another 25-50% in the coming years), outside of the ECB captive banks, central banks made net additions to gold holdings in 2006…Seeing central bank sales dry up like this while so many other supply/demand factors are coming into play is a major, major bullish signal for the market. Central Bank activity (or lack thereof) and supply/demand factors are what will push gold past $800 this year and into the four digit range in the next several years. See the coming trend, understand it and prepare for it.
CPM Gold Forecast
CPM forecasts central bank gold sales to decline, increased gold supply and more fabrication demand
"Never before in history have so many investors, spread throughout a truly global array of geographic and demographic universe, spent so much money buying so much gold over such an extended period of time" - CPM
Author: Dorothy Kosich
Posted: Thursday , 15 Mar 2007
RENO, NV -
Precious metals and commodities consultants CPM said Thursday that the rush of new investors remains the single most important factor in determining gold prices.
In their 2007 Gold Yearbook released Thursday, CPM predicted that central bank gold sales will decrease this year. The New York based consultants also asserted that a gold rush of unprecedented proportions is on-going, and advised that gold ETFs have yet to face a real test.
CPM's research determined that the average annual price of gold increased 35.9% to $606.67, the second highest annual average price in history. The current bull market was 69 months old as of December 30, 2006. The next longest bull market in gold prices was 59 months from January 1970 through December 1974.
INVESTMENT DEMAND
"Never before in history have so many investors, spread throughout a truly global array of geographic and demographic universe, spent so much money buying so much gold over such an extended period of time," CPM declared.
Investors added 43.5 million ounces of gold to their holdings last year, down slightly from 46.7 million ounces in 2005. "Investors are projected to add another 39.7 million ounces of gold this year on a net worldwide basis."
CPM's analysis suggested that "investors may be less worried this year than they have been over the past two years. One or two major political crisis in any number of current trouble-spots, a major interruption in international petroleum flows, a currency crisis, or some other such global crisis, could change this overnight, however."
The build up of gold bullion in market centers raises concern for CPM. "Enormous volumes of gold have flowed into major market centers, including London, Dubai, and Canada, and have not flowed out. This partly reflects a bullish trend: Investors are buying gold for storage in major market centers. It also partly reflects a bearish trend: There is a large amount of gold flowing into markets centers that is not being sold and moved on to jewelers and others in other parts of the world."
"Some of it appears to represent metal that is being bought by bullion dealers in their roles as market makers, who hedge their positions and now find themselves sitting on large bullion inventories that do not have ready buyers eager to acquire them'" according to CPM.
"The influx of new investors and new type of investors is reflected in the rise of new gold exchanges in Dubai, Mumbai and Chicago, and the creation of new investment products catering to various types of investors."
"The amount of gold that may be purchased may decline from 2006 levels during 2007, but the overall pace of investment demand is expected to remain very high by historical standards."
GOLD ETF
"Clearly ETFs have captured the imagination of the investors," CPM declared. "This is true not only with gold but in the myriad of other ETFs based on an infinite number of financial assets and basket assets."
While CPM considered gold ETFs to be an initial success, which have stimulated gold demand, made it easier for investors to buy physical gold, and taken the metal off of the gold lease market, "whether they will be a long-term success remains to be seen."
"Gold ETFs have not been tested in a bear market, and gold is notorious for having extended bear markets. How investors will behave with their ETF shares if and when gold prices turn lower in the future for any extended period of time will be very important to watch," CPM said. "That said, ETFs in general and gold ETFs will continue to grow in importance to the markets."
Meanwhile, as some investors are investing in metals through ETFs, ‘an even greater volume of gold continues to be purchased in more traditional methods," CPM noted.
GOLD SUPPLY
Total gold supply was 105.7 million ounces last year from mine production, secondary recovery and net shipments from transitional economies. This was a 3% decline from 2005 and down from a peak of 110.5 million ounces in 2003, according to CPM.
Total gold supply this year is projected to rise 4.4% this year to 110.3 million ounces, which CPM said is the second largest annual total gold supply of newly refined gold.
Last year, declines in both mine production and in secondary recovery of gold from scrap occurred in a year when gold mine production and total supply had been projected to increase. CPM blamed the declines on the delays in bringing new mines on stream, and supply bottlenecks worldwide in the mining industry "caused by a massive rush of investment into new mines developments and expansions, has slowed the advent of new capacity."
Meanwhile, gold mining costs have risen sharply during the past two years, according to CPM. While higher input costs, such as commodities and labor, are normally blamed for the increase, CPM's analysis suggested that "it also represents a tendency on the part of existing mining operations to work higher-cost mining surfaces during periods of high metal prices."
Nevertheless, CPM predicted that mine output is still projected to increase 4% this year to 63.8 million ounces. Gold mine production declined 2.4% to 61.4 million ounces in 2006.
"There is a gold rush of unprecedented proportions under way around the world today," CPM declared. "The modernization, deregulation, and opening up of many countries, including vast regions of the earth's surface in China, Russia, and other parts of the world, is contributing to the enormous scope of this expansion of exploration and development. More money is being spent on mine exploration and development than ever before in history. As a result, new deposits are and will continue to be discovered, and new mines are and will continue to be developed."
CPM's research determined that 50 mines with a combined annual capacity of 14.5 million ounces are undergoing development, and will begin producing gold between 2007 and 2011. Total reserves at these mines is estimated at 274.4 million ounces, representing an average mine life of 19 years.
CENTRAL BANK SALES
CPM's research revealed that central banks appear to have been net sellers of 11.4 million ounces of gold last year, down from 20.6 million ounces in 2005 and below typical central government sales levels over the past 17 years.
"This year central bank sales may decline even further, and could total no more than 9 million ounces," CPM projected. "The basic reality is that while central banks still own 977.1 million ounces of gold, they appear to have sold most of the gold that they wish to sell."
"Going forward, there will be further sales, but the annual flow of gold may dwindle significantly from the 14 million ounces or so per year that central banks were selling over the past 18 years," they said.
FABRICATION DEMAND
The use of gold in jewelry and other products fell sharply in 2006, "hammered down by the high price of gold," CPM said. Jewelry demand declined 13.3% in 2006, down to 63.3 million ounces.
However, CPM suggested that total fabrication demand could recover slightly this year. "Total demand may increase 8.2% to 79.6 million ounces. Jewelry use of gold is projected to rise 9.1% to 69.1 million ounces as jewelry consumers adjust to higher gold prices," CPM forecast. "Gold use in electronics is projected to continue rising, boosting non-jewelry use 2.5% to around 10.5 million ounces."
Meanwhile, money formerly spent in gold jewelry is now being divided among "a more diverse range of luxury or discretionary purchases, including jewelry but also encompassing home electronics, automobiles, watches, and handheld electronic devices, and clothes," CPM advised.
This has resulted in another trend to buying gold bullion, coins, and medallions for gold investments, instead of jewelry, they added.
Gold use in electronics and electrical equipment increased 10% in 2006. CPM forecasts that gold use in electronics is "projected to continue rising at healthy rate," for a 4.1% increase to 6.3 million ounces in 2007.
Gold use in dental and medical applications declined 2.9% to 2.36 million ounces in 2006. CPM projects that gold for use in dental and mental products could fall 1% to 2.34 million ounces this year.
GOLD MARKET
CPM estimated that the total gold market amounted to 9.1 billion ounces in 2006, up 33.9% from 2005. Combined trading volumes in futures and options were up 43.5% to 3.2 billion ounces in 2006.
Combined warehouse inventories, including the exchange stocks of NYMEX, CBOT and Tocom totaled 7.9 million ounces at the end of 2006, up from 6.9 million ounces at the end of 2005.
CPM Group's Gold Yearbook 2007 may be ordered and downloaded online at http://www.cpmgroup.com/
Louis Gold/Silver-Commitments of Traders Reports
http://users.skynet.be/bk336919/commodities/cotoi.html
Central Bank Gold Sales
http://www.amarks.homestead.com/cbgold.html
2006/2007 Fiscal Year

2005/2006 Fiscal Year

Sales Under CBGA1 and CBGA2

Central Bank Gold Sales by Country as of 9/16/06
http://amarks.homestead.com/files/cbgoldsalescountry.jpg

Central Bank Gold Sales
Current Year To Date (Sept 2005 - Sept 2006)

Prior Year to Date September 2004 - June 2005 (Virtual Metals)

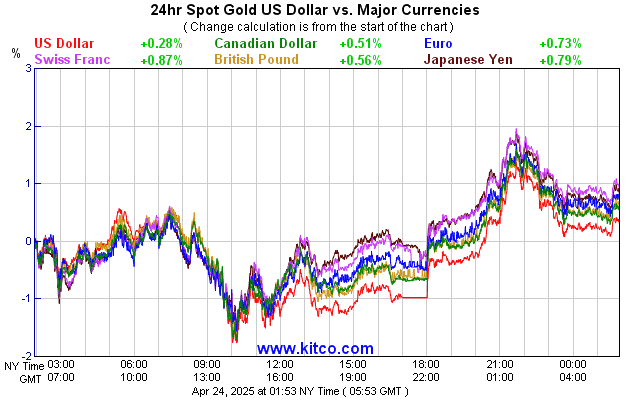
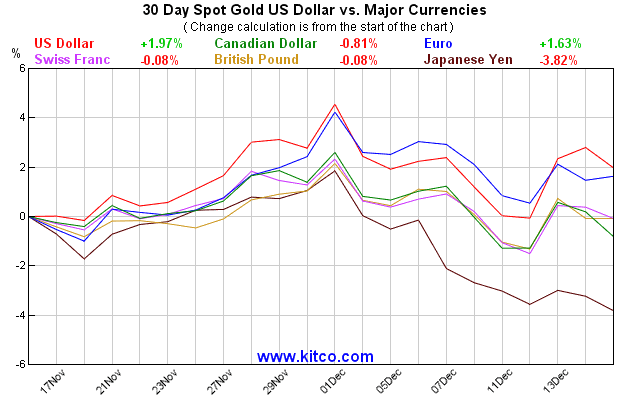
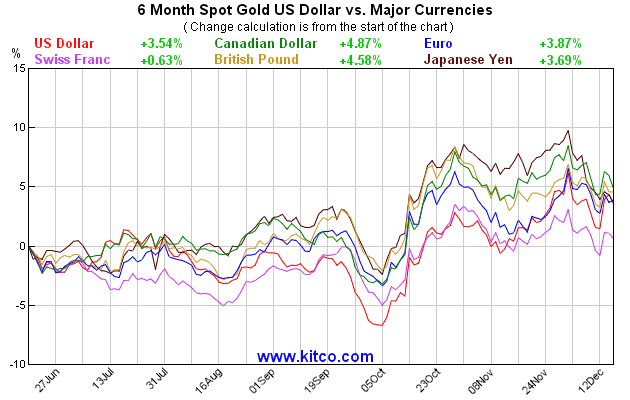
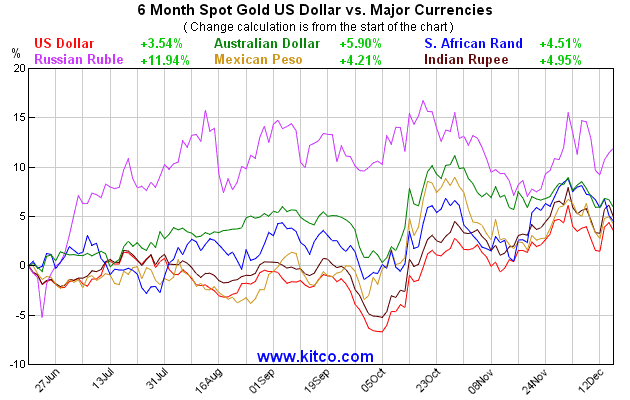
US$ Spot Gold vs Other Currencies
Today
Last 30 Days
Last 6 months
Gold Stock Bellweathers - Weekly
Gold Stock Bellweathers / 6 months

Gold Stock Bellweathers / 6 months

Chart above is the Schultz Gold Index
you can subscribe or learn more at this link:
http://www.hsletter.com/gcruentre_jsmineset.html
CT comments on his trading system:
I have spent over 10 years building my system, which incorporates price movements from Comex to London fixings, with consideration given to historical behavior as well. It's designed to capture short term swings to long term trends. However, no system is perfect, and the recent +10-dlr swings caused me plenty of losses. Well the recent choppy action is unseen in recent years, therefore I am not concerned about any system crash. I am confident that my system will return to continuous profitability in short order.
http://search.messages.yahoo.com/search/messages?tag_M=Casual_Techwatcher+&fname_M=txt_author
http://messages.yahoo.com/bbs?action=m&board=7079215&tid=nem&mid=400730&sid=7079215
Gold in US$, Euro, Indian Rupee, SA Rand
the producers... excluding Australia...
http://finance.yahoo.com/q/bc?t=1y&s=XAUUSD%3DX&l=on&z=m&q=l&c=XAUMXN%3DX%2CXAUC....
create your own chart...
http://finance.yahoo.com/currency/convert?amt=1&from=XAU&to=MXN&submit=Convert
Gold vs Silver vs Platinum = Red/Green/Blue
5 Day/3 Month/ 1 Year / 2 Year
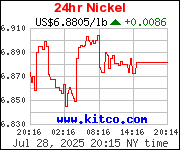
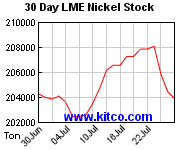
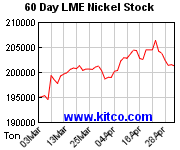
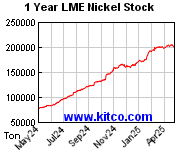
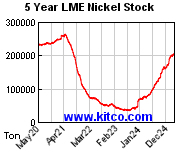
Nickel & Copper Charts
Nickel Price
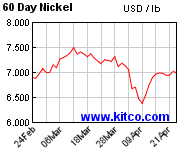
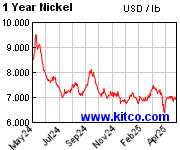
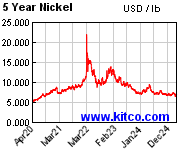
Nickel Inventory
Copper Price

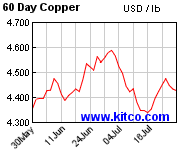
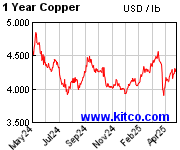
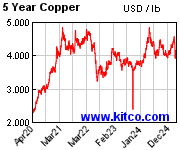
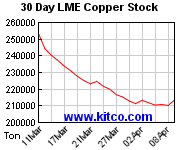
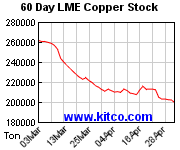
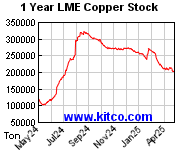
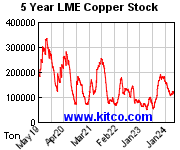
Copper Inventory
Gold Stock Bellweathers... $TSEGD/NEM/HUI/XAU
Relative Performance to S Africa
HUI vs. TSE
SA Rand & Gold - 3 Year
SA Rand - 3 Year
Gold Ounce in SA Rand - 3 Year
Gold Ounce in US$ - 3 Year
US$Gold vs SA Rand Gold Price
Gold ounce in SAR
Gold ounce in US$
SAR per USD
HUI components vs. HUI
What's leading and lagging in the HUI index...
Newmont = 13.9%
>
Glamis = 4.9%
&pref=G>
Goldcorp = 4.3%
&pref=G>
Gold Fields = 12.8%
&pref=G>
Coeur d'alene = 8.4%
&pref=G>
Bema = 6.7%
&pref=G>
Hecla = 6.5%
&pref=G>
Freeport = 9.7%
>
Golden Star = 5.6%
>
Randgold = 5.2%
>
Harmony = 4.0%
>
Gold
&pref=G>
See: http://www.amex.com/?href=/othProd/prodInf/OpPiIndComp.jsp?Product_Symbol=HUI
 Yield spread between 30 Year T-Bond and 3-month T-Bill. If the yield ratio turns up and the real rate of interest remains negative, then gold should fly.
 Sinclair MACD & %R
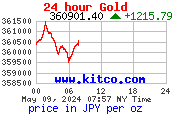
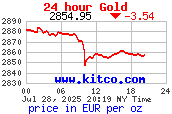
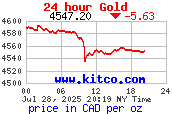
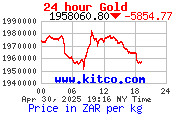 Y460 is breakout....................E360 is breakout.................C$570 is breakout............over R98000=good profit margin


| Volume | |
| Day Range: | |
| Bid Price | |
| Ask Price | |
| Last Trade Time: |
