 News
News  Market Data
  Discover
Support: 888-992-3836
Copyright © 2023 InvestorsHub Inc.


Register for free to join our community of investors and share your ideas. You will also get access to streaming quotes, interactive charts, trades, portfolio, live options flow and more tools.
The AAII Investor Sentiment
* Sentiment Survey Results Week ending 10/17/2012
 Bullish 28.7%
 Neutral 26.8%
 Bearish 44.5%
Change from last week:
Bullish: -1.9
Neutral: -3.8
Bearish: +5.7
Long-Term Average:
Bullish: 39%
Neutral: 31%
Bearish: 30%
http://www.aaii.com/sentimentsurvey/
George.
Click on "In reply to", to see past Survey Results.
Estimated Long-Term Mutual Fund Flows
* Wednesday, October 17, 2012
Washington, DC, October 17, 2012 - Total estimated inflows to long-term mutual funds were $7.04 billion for the week ended Wednesday, October 10, the Investment Company Institute reported today. Flow estimates are derived from data collected covering more than 95 percent of industry assets and are adjusted to represent industry totals.
Equity funds had estimated outflows of $2.61 billion for the week, compared to estimated outflows of $11.22 billion in the previous week. Domestic equity funds had estimated outflows of $2.31 billion, while estimated outflows from world equity funds were $295 million.
Hybrid funds, which can invest in stocks and fixed income securities, had estimated inflows of $139 million for the week, compared to estimated inflows of $2.26 billion in the previous week.
Bond funds had estimated inflows of $9.51 billion, compared to estimated inflows of $9.52 billion during the previous week. Taxable bond funds saw estimated inflows of $8.16 billion, while municipal bond funds had estimated inflows of $1.35 billion.
http://ici.org/research/stats/flows/flows_10_17_12
George.
Click on "In reply to", to see report from prior week.
Sentiment Poll
* Monday, October 15, 2012
http://tickersense.typepad.com/ticker_sense/
George.
Click on "In reply to", to see charts from prior week.
The NAAIM Survey of Manager Sentiment is still bullish
The NAAIM Survey of Manager Sentiment
* Wednesday, October 11, 2012 
The NAAIM Number
64.59
Last Quarter Average
71.96
http://www.naaim.org/news/naaim-survey-of-manager-sentiment/
George.
Click on "In reply to", to see The NAAIM Number from prior week.
The AAII Investor Sentiment
* Sentiment Survey Results Week ending 10/10/2012
Bullish 30.6%
Neutral 30.6%
Bearish 38.8%
Change from last week:
Bullish: -3.3
Neutral: -2.3
Bearish: +5.6
Long-Term Average:
Bullish: 39%
Neutral: 31%
Bearish: 30%
http://www.aaii.com/sentimentsurvey/
George.
Click on "In reply to", to see past Survey Results.
Estimated Long-Term Mutual Fund Flows
* Wednesday, October 10, 2012
Washington, DC, October 10, 2012 - Total estimated inflows to long-term mutual funds were $2.05 billion for the week ended Wednesday, October 3, the Investment Company Institute reported today. Flow estimates are derived from data collected covering more than 95 percent of industry assets and are adjusted to represent industry totals.
Equity funds had estimated outflows of $11.08 billion for the week, compared to estimated outflows of $7.55 billion in the previous week. Domestic equity funds had estimated outflows of $10.60 billion, while estimated outflows from world equity funds were $483 million.
Hybrid funds, which can invest in stocks and fixed income securities, had estimated inflows of $2.26 billion for the week, compared to estimated outflows of $386 million in the previous week.
Bond funds had estimated inflows of $10.87 billion, compared to estimated inflows of $8.29 billion during the previous week. Taxable bond funds saw estimated inflows of $8.06 billion, while municipal bond funds had estimated inflows of $2.82 billion.
http://ici.org/research/stats/flows/flows_10_10_12
George.
Click on "In reply to", to see report from prior week.
Short Interest NYSE | Amex | Nasdaq
* Tuesday, October 09, 2012
> Biggest Short Positions
> Largest Positive Changes
> Largest Negative Changes
> Largest % Increases
> Largest % Decreases
> Shorts As A Percentage of Float
> Days To Cover
http://online.wsj.com/mdc/public/page/2_3062-nyseshort-highlites.html?mod=topnav_2_3022
George.
Sentiment Poll
* Monday, October 8, 2012
http://tickersense.typepad.com/ticker_sense/
George.
Click on "In reply to", to see charts from prior week.
30 Pieces of Silver: An indictment of American Churches
Submitted by Denise B on Sat, 10/06/2012 - 14:59
in
Daily Paul Liberty Forum
DP Original
WARNING!: This article is intended for a specific audience (Christians). If you are not a Christian and topics of a religious nature offend you, please read no further and return to the main page. I am posting it to the DP, because there are a number of Christians who frequent this site and I believe it is a topic of vital importance that has played a pivotal role in the loss of liberty in this country. I think it is one that all Christians should be aware of and should respectfully and prayerfully speak with their pastors about.
****
I want to start this essay by giving all Glory, Honor, Thanks & Praise to my Heavenly Father, who by His might created all the Heavens and the Earth and who sent His only begotten Son, My Lord and Savior Jesus Christ, to bear the sins of the world upon His shoulders that we who believe in Him may have everlasting life in eternity with Him.
I write this essay with much fear and trembling. Indicting God’s church is not something that should be done on a whim, or without much prayer and direction of the Holy Spirit. I would not publish this essay without a firm conviction that what I am about to say is truth, in accordance with His Word. I pray for God’s mercy and that my words will be heeded:
American Churches have sold out, for 30 Pieces of Silver, and have taken America down with her. Many decades ago, the Churches decided that God’s voice was not needed in the political arena and traded their God given freedom of speech for a (501)c3 tax exemption. For those of you who are not aware, churches are given this exemption, by their master’s the IRS, in return for staying out of the political arena...No political speech or mention or endorsement of political figures is allowed by the clergy, lest they lose their coveted tax exemption. Look around you today and you will see the dire consequences of their ill-advised action. When God’s voice is removed from the governing authorities, the inevitable result is a removal of His voice from all corners of that society. Many people will claim that if we do not curb the rampant spread of immorality in our society (divorce, abortion, homosexuality, promiscuity, fraud, deceit, corruption, etc.) we risk judgement from God; however, I assert to you that these things are merely proof that God’s judgement is already upon us. Did we really believe that we could turn a blind eye to the sinful men that have unlawfully set up their authority over us and suffer no consequence?
I am fully aware of the Romans 13 argument and I assert to you that, as it is used for justification for looking the other way while Satan reigns over us, it is a false argument, a coward’s argument that flies in the face of logic. It is true that Romans 13 states that we are to “be in subjection to the governing authorities”; however, this statement is further qualified with the statement that “rulers are not a cause of fear for good behavior, but for evil”...and further that governing authority is “a minister of God to you for good”...and also that “for because of this you also pay taxes, for rulers are servants of God, devoting themselves to this very thing.”
In this country, we have but one properly enacted, God-ordained governing authority and it is called the United States Constitution. In reference to our federal government, it is the single governing document from which all of our governing bodies derive their just powers from. It is the document that each of our public officials take an oath before God to protect and defend from all enemies, both foreign and domestic. When it is followed, it truly is a document that requires governing authority in this country to be “ministers of God to you for good”. It protects our rights in many aspects, not the least of which is our right to freedom of speech and freedom of religion and freedom of worship. I submit to you that it is our First Amendment Rights which guarantee us the right to follow God’s greatest Commission unimpeded; spreading the Gospel of Jesus Christ. We see even today, first hand, what happens in countries where no such rights are guaranteed and I have read many a story of believers jailed and even murdered for seeking to do nothing more than preach the Gospel to those in desperate need of it.
But what happens, when our public officials, acting outside of the boundaries of their lawful authority, no longer serve as “avengers who brings wrath on the one who practices evil”, but instead become the ones who are practicing evil themselves? How is God’s Church to react to this? Are we then to ignore our God-ordained governing document, the U.S. Constitution and look the other way while evil and unjust authority rule over us? God forbid such a conclusion!
Should not the correct response to this by God’s people be to expose our public officials for the lawbreakers, oathbreakers and usurpers that they have become? Should we not seek to have them removed from their unjust authority and replace them with those that will honor their oath sworn on the Bible before God? Oh that’s right, we can’t do that without violating our “contract” with the Devil...oops, I mean the IRS and losing our sacred tax exemption. That’s all right, I am sure that God will understand....
How does any God-fearing Christian think that it could ever be preferable to God that His Church keep silent about tyranny, injustice and oath-breakers in return for mere monetary gain?! I would assert that those who feel it is better for the church to have a few extra dollars rather than the ability to speak the truth has no faith in their Creator to provide for them at all. I can imagine no circumstance where the Almighty God of the Bible would need an agency such as the IRS as a means of providing for His people - at the high cost of the ability to speak the truth about those that would seek to represent them...unless of course it was as a form of judgment for their failure to do what is right in His eyes.
This country, like all others before us, stands on a precipice. Once again, humanity has shown it’s inability to achieve anything but utter destruction when it wanders from the path that God has laid out for us. Show me where in the entire Bible that God’s people have ever been exempt from reaping the often painful results of sinful actions. I assert to you that serving monetary needs over matters of truth is a sinful action in God’s eyes. God is perfectly capable of providing for His church and He does not need an IRS tax exemption to do so!
While, for some of us, our souls may be saved, (hallelluia!), that does not guarantee that our children and grandchildren will not reap the results of our failure to be watchmen on the walls for them. Our churches have allowed themselves to be bribed and deceived by the enemy and the point of this essay is not to call a fallen world to Repent and be Saved (as vital as that also is), but to call God’s church to Repentance and Forgiveness for allowing their voices to be silenced for monetary gain, lest we continue to bring God’s Just Wrath upon our nation as a whole. It will be our children and grandchildren who pay the heaviest price of living under an unjust governing authority that knows not God, nor the rebuke of His people. Luke 16:13: “No servant can serve two masters; for either he will hate the one and love the other, or he will be devoted to one and despise the other. You cannot serve God and wealth.” Choose your master wisely and I beseech God’s churches to stop allowing the enemy to buy your silence for any price! We are God’s people, we are to boldly speak the truth and fear God, not any man or agency of the Devil!!
http://www.dailypaul.com/257766/30-pieces-of-silver-an-indictment-of-american-churches
Silver safety -
ex....
USGIF Gold is Good Money, But Our Fiat Currency is Not -
Stock Scan: Growth Stocks
* Friday, October 05, 2012
» Best Performers: Small Cap
» Best Performers: Mid Cap
» Best Performers: Large Cap
» Ways to Invest for Growth: ETFs
» Ways to Invest for Growth: Large-Cap Growth Mutual Funds
» Ways to Invest for Growth: Mid-Cap Growth Mutual Funds
» Ways to Invest for Growth: Small-Cap Growth Mutual Funds
http://online.wsj.com/mdc/public/page/2_3022-scangrowth.html?mod=topnav_2_3027
George.
Insider Spotlight
* Insider Activity for the week ending Friday, October 05, 2012
> Insider Buying
> Insider Selling
> Insider Planned Sales
> Companies with Insider Activity
> Companies with Planned Sales
> Sectors
http://online.wsj.com/mdc/public/page/2_3024-insider1.html?mod=topnav_2_3062
George.
Dividend Stocks
* Friday, October 05, 2012
> Top-Yielding Stocks
> Ways to Invest for Dividends: ETFs
> Stocks With the Fastest Dividend Growth
> High-Yielding Mutual Funds
http://online.wsj.com/mdc/public/page/2_3022-scandiv.html?mod=topnav_2_3062
George.
Bond Offering Calendar
* Friday, October 05, 2012
> Treasurys
> Public and Municipal Finance
> Corporate Debt
http://online.wsj.com/mdc/public/page/2_3022-bondoffer.html?mod=topnav_2_3022
George.
Insider Trading Transactions By Sector And Industry
* Friday, October 05, 2012
![]()
"Insiders might sell their shares for any number of reasons, but they buy them for only one: they think the price will rise"
- Peter Lynch
http://www.secform4.com/edgar-filings.php
George.
Top 10 insider trading lists for the last 10 days
* Friday, October 05, 2012
![]()
> Top total buy in dollar amount
> Top total sale in dollar amount
> Top net buy (Total buy - Total sale) in dollar amount
> Top net sale (Total sale - Total buy) in dollar amount
> Top total number of form 4 sale filings
> Top number of net buy filings
> Top number of net sale filings
http://www.secform4.com/stock-screener.htm
George.
ETF SCREENER
* Friday, October 05, 2012
Find ETFs by selecting from the criteria given:
> Price & Performance
> Fund Category
> Price-to-Earnings Ratio (P/E)
> Price-to-Book Ratio (P/B)
> Management & Expenses
http://online.wsj.com/public/quotes/etf_screener.html?mod=topnav_2_3022
George.
PENSION FUNDING INDEX: September brings $45 billion improvement in pension funded status
* September, 2012
Pension liabilities of the 100 largest corporate defined benefit pension plans fell by $30 billion in September while the corresponding pension assets improved by $15 billion, lowering the Milliman 100 PFI pension deficit to $453 billion and increasing the funded ratio to 74.5%. The September 30, 2012, funded ratio still lags its December 31, 2011, value of 78.7%.
September’s funded status improvement was fueled by an increase in the corporate bond interest rates that are the benchmarks used to value pension liabilities. September marks the second consecutive month of discount rate increases after the dismal performance between March and July, when the deficit ballooned in response to declining discount rates. As of September 30, the funded ratio climbed to 74.5%, up from 72.4% at the end of August.

http://www.milliman.com/expertise/employee-benefits/products-tools/pension-funding-index/index.php
George.
Click on "In reply to", for prior months reports.
The NAAIM Survey of Manager Sentiment
* Wednesday, October 3, 2012
The NAAIM Number
76.03
Last Quarter Average
71.96
http://www.naaim.org/news/naaim-survey-of-manager-sentiment/
George.
Click on "In reply to", to see The NAAIM Number from prior week.
The AAII Investor Sentiment
* Sentiment Survey Results Week ending 10/3/2012
Bullish 33.9%
Neutral 32.9%
Bearish 33.2%
Change from last week:
Bullish: -2.2
Neutral: +5.5
Bearish: -3.2
Long-Term Average:
Bullish: 39%
Neutral: 31%
Bearish: 30%
http://www.aaii.com/sentimentsurvey/
George.
Click on "In reply to", to see past Survey Results.
Estimated Long-Term Mutual Fund Flows
* Wednesday, October 3, 2012
Washington, DC, October 3, 2012 - Total estimated inflows to long-term mutual funds were $448 million for the week ended Wednesday, September 26, the Investment Company Institute reported today. Flow estimates are derived from data collected covering more than 95 percent of industry assets and are adjusted to represent industry totals.
Equity funds had estimated outflows of $7.50 billion for the week, compared to estimated outflows of $5.12 billion in the previous week. Domestic equity funds had estimated outflows of $5.08 billion, while estimated outflows from world equity funds were $2.42 billion.
Hybrid funds, which can invest in stocks and fixed income securities, had estimated outflows of $377 million for the week, compared to estimated inflows of $1.64 billion in the previous week.
Bond funds had estimated inflows of $8.32 billion, compared to estimated inflows of $8.00 billion during the previous week. Taxable bond funds saw estimated inflows of $6.89 billion, while municipal bond funds had estimated inflows of $1.44 billion.
http://ici.org/research/stats/flows/flows_10_03_12
George.
Click on "In reply to", to see report from prior week.
“Me, Lord Marlboro, and the Dow?!”
By Jeffrey Saut
* Monday, October 1, 2012
![]()
The call for this week: Mark Twain once remarked, “October, this is one of the peculiarly dangerous months to speculate in stocks. The others are July, January, September, April, November, May, March, June, December, August, and February." However, if the typical presidential election year trading pattern continues to play, after a pause/pullback stocks should trade higher (see chart on page 3). And, this week is full of economic reports that could cause a pause/pullback. This week we get the global manufacturing data and the U.S. jobs data. The wildcard, however, is Spain. The bulls are hoping that last week's Spanish budget proposals will pave the way for a bailout request by Mariano Rajoy's government. If so, it would be a step in clearing some of the uncertainty in the euro zone. Whatever the news, I don’t think stocks pull back much from here.

http://www.raymondjames.com/inv_strat.htm
George.
Click on "In reply to", for Authors past commentaries.
Sentiment Poll
* Monday, October 1, 2012
http://tickersense.typepad.com/ticker_sense/
George.
Click on "In reply to", to see charts from prior week.
$NYSI (NYSE Summation Index)
$NASI (Nasdaq Summation Index)
George.
The NAAIM Survey of Manager Sentiment
* Wednesday, September 26, 2012
The NAAIM Number
69.75
Last Quarter Average
50.93
http://www.naaim.org/news/naaim-survey-of-manager-sentiment/
George.
Click on "In reply to", to see The NAAIM Number from prior week.
The AAII Investor Sentiment
* Sentiment Survey Results Week ending 9/26/2012
Bullish 36.1%
Neutral 27.4%
Bearish 36.5%
Change from last week:
Bullish: -1.4
Neutral: -1.3
Bearish: +2.7
Long-Term Average:
Bullish: 39%
Neutral: 31%
Bearish: 30%
http://www.aaii.com/sentimentsurvey/
George.
Click on "In reply to", to see past Survey Results.
Estimated Long-Term Mutual Fund Flows
* Wednesday, September 26, 2012
Washington, DC, September 26, 2012 - Total estimated inflows to long-term mutual funds were $4.47 billion for the week ended Wednesday, September 19, the Investment Company Institute reported today. Flow estimates are derived from data collected covering more than 95 percent of industry assets and are adjusted to represent industry totals.
Equity funds had estimated outflows of $5.16 billion for the week, compared to estimated outflows of $3.21 billion in the previous week. Domestic equity funds had estimated outflows of $4.80 billion, while estimated outflows from world equity funds were $355 million.
Hybrid funds, which can invest in stocks and fixed income securities, had estimated inflows of $1.64 billion for the week, compared to estimated inflows of $1.31 billion in the previous week.
Bond funds had estimated inflows of $8.00 billion, compared to estimated inflows of $8.11 billion during the previous week. Taxable bond funds saw estimated inflows of $7.55 billion, while municipal bond funds had estimated inflows of $446 million.
http://ici.org/research/stats/flows/flows_09_26_12
George.
Click on "In reply to", to see report from prior week.
Stock Scan: Growth Stocks
* Wednesday, September 26, 2012
» Best Performers: Small Cap
» Best Performers: Mid Cap
» Best Performers: Large Cap
» Ways to Invest for Growth: ETFs
» Ways to Invest for Growth: Large-Cap Growth Mutual Funds
» Ways to Invest for Growth: Mid-Cap Growth Mutual Funds
» Ways to Invest for Growth: Small-Cap Growth Mutual Funds
http://online.wsj.com/mdc/public/page/2_3022-scangrowth.html?mod=topnav_2_3027
George.
Who Benefits From QE?
* Monday, September 24, 2012 

Different asset prices do not respond in the same way to quantitative easing. Unfortunately, in the aftermath of structural housing busts, central bank action simply cannot generate a strong rebound in house prices. But it can trigger big rallies in stock prices.
For example, U.S. households’ real estate assets are still languishing at $16 trillion, down sharply from $23 trillion in 2007 – however, the Fed’s quantitative easing programs have helped households’ stock market wealth bounce back to $21 trillion, close to an all-time high.
Importantly, the movement in stock prices relative to house prices is an excellent gauge of wealth polarization, and hence the relative strength of top-end versus mainstream consumer spending. Recent policy decisions from five of the world’s major central banks will continue to support the top-end spender more than the average spender.
Bottom line: We recommend staying overweight luxury products and services equities, especially as valuations still appear very reasonable.
http://blog.bcaresearch.com/who-benefits-from-qe
George.
Click on "In reply to", for Authors past commentaries.
ETF Tools
* Friday, September 21, 2012 
 New Highs / Lows - List of ETFs making new highs and lows
 Volatility - Chart the rolling realized volatility of up to five ETFs
 Correlation - See how the relationship between two ETFs has varied over time.
 Dividend Yield - Compare the dividend yield of two ETFs
 Total Return vs Price Return - See the impact of dividend reinvestment - chart the difference between price return and total return
http://www.etfreplay.com/tools.aspx
George.
Stocks With the Largest Short Interest
* Friday, September 21, 2012
> nyse
http://bigcharts.marketwatch.com/reports/bigmovers.asp?data=1&start=1&report=10&report_country_code=US&date=20120921
George.
Click on "In reply to", to see reports from prior week.
Cycle Update: 9/17H, 9/19L, Up into 9/24H
By Raj Times and Cycles
* Friday, September 21, 2012 
From last weekend's 9/15 email: "The active cycle suggests a rally into 9/17H, decline into 9/19 Low, rally into 9/24 High, all +/- 1 TD"
Actual: 9/14 High (-1), 9/20 Low (+1), next is Up into 9/24 cycle High.
The 9/17 Cycle High, arrived 1 TD earlier at the 9/14 High and the 9/19 Low arrived 1 hour later, in the 1st hour of 9/20 Low at 1449.98 SPX. We then reversed higher and rallied the rest of the day, closing at 1460.26 SPX yesterday. The rally phase should continue today.
What's next: We should continue to rally into 9/24 cycle High, before the next pullback.
Overall we should be higher into end of the year, with some sharp pullbacks along the way.
October should be full of surprises for many, but 2012 should end on an Up note.
http://timeandcycles.blogspot.com/
George.
Click on "In reply to", for Authors past commentaries.
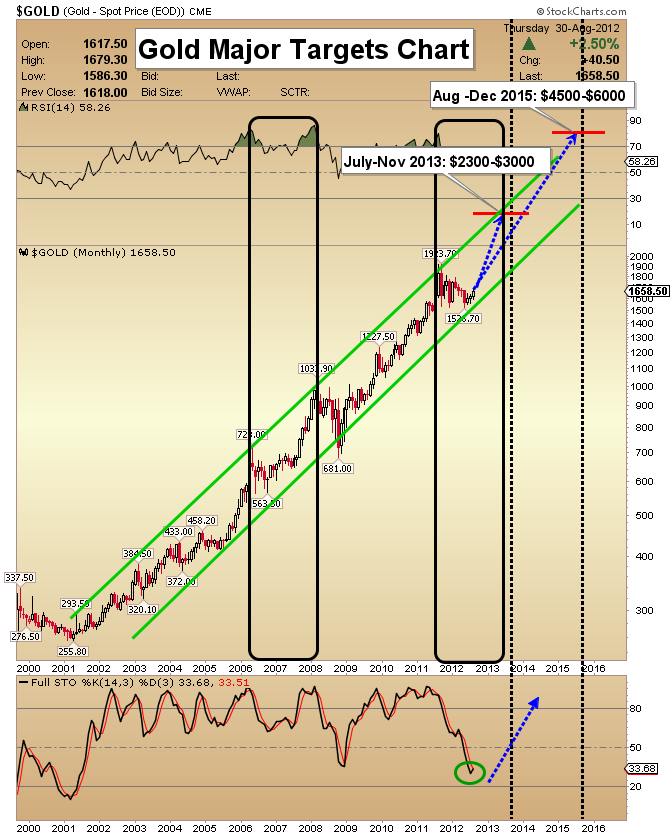
Gold Prices Could Peak at $5,000: Bank of America
Posted on September 21, 2012 by News
21-Sep (CNBC) —

As gold prices hit a 2012 record of $1,787.40 per ounce on Friday,
Bank of America Merrill Lynch analysts said the precious metal
could soar to $3,000 or even $5,000 over the longer-term.
“We will be focusing in on gold.
Ultimately we think gold can trade between $3,000 and
$5,000 an ounce going forward,” MacNeil Curry,
head of foreign-exchange and rates technical strategy at BAML,
told CNBC’s “Worldwide Exchange.”
“Certainly not within the next few months, but on a long-term
basis we are on a well-defined uptrend, and we have got more to
run before that runs its course.”
…“We believe the growth in supply of fiat currencies [those
without intrinsic value] such as the U.S. dollar and dollar-
linked currencies such as the renminbi is a key driver, followed
by concerns regarding inflation and inflation volatility which
could follow,” Brebner and Fu said in the report.
[source]
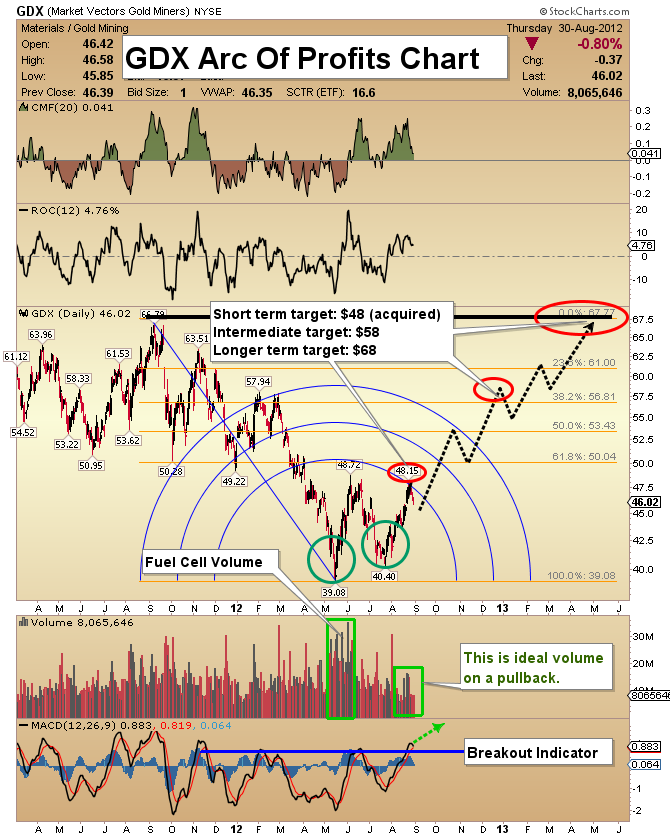
GDX Gold Miners chart -
Caledonia Gold Target $4,500.- + + 
Caledonia Gold Mines well, Sheldon keep on buying more and more -
not just buying for Pinetree Capital -
Sheldon is buying CAL/CALVF for himself private also
adding plenty -
CALVF Insider Pinetree Capital Ltd major shareholder -
& Inwentash, Sheldon Chairman & CEO of Pinetree -
Insiders buying more Caledonia mining -
http://canadianinsider.com/node/7?ticker=CAL
http://investorshub.advfn.com/boards/read_msg.aspx?message_id=78683901
http://www.caledoniamining.com/pdfs/CALPres08142012.pdf
CALEDONIA #1 SCOTTISH RIGHT WAY TO GO -
http://www.caledoniamining.com/pdfs/CALPres08142012.pdf
CALEDONIA Celtic Thunder -
Dow Theory: Transports Not Confirming Industrials
By Carl Swenlin
* Friday, September 21, 2012
One of the elements of Dow Theory is that the Dow Jones 20 Transportation Average (DJTA) should confirm new highs in the Dow Jones 30 Industrial Average (DJIA). When this fails to happen, it is a bad sign for the market. The logic behind this is that, if industrial company stocks are doing well, the companies will be ordering raw materials in anticipation for future sales, which will be transported by the transportation companies, in turn causing the transportation stocks to benefit.
The two charts below show that the DJTA has not confirmed the new highs in the DJIA all this year. Whereas the DJIA has continued to push to new highs, the DJTA has stalled and moved sideways.
The internals behind this divergence are even worse than revealed by price. Each chart has a panel showing the percentage of stocks in each price index that are above their 200-EMA. Note that the percentage for the DJIA is near 90%, while it is only 20% for the DJTA.
When a stock's price is below its 200-EMA, by our technical definition it is in a long-term bear market. With 80% of DJTA stocks in bear markets, the outlook for the DJTA is not good. And in accordance with Dow Theory, the prospects for the broader market are much worse than the new highs in the DJIA would imply.
* * * * * * * * * * * * * * * * * * * * *
Technical analysis is a windsock, not a crystal ball.
* * * * * * * * * * * * * * * * * * * * *
http://blogs.decisionpoint.com/chart_spotlight/2012/09/20120921cs-1.html
George.
Click on "In reply to", for Authors past commentaries.
Insider Trading Transactions By Sector And Industry
* Friday, September 21, 2012
![]()
"Insiders might sell their shares for any number of reasons, but they buy them for only one: they think the price will rise"
- Peter Lynch
http://www.secform4.com/edgar-filings.php
George.
Top 10 insider trading lists for the last 10 days
* Friday, September 21, 2012
![]()
> Top total buy in dollar amount
> Top total sale in dollar amount
> Top net buy (Total buy - Total sale) in dollar amount
> Top net sale (Total sale - Total buy) in dollar amount
> Top total number of form 4 sale filings
> Top number of net buy filings
> Top number of net sale filings
http://www.secform4.com/stock-screener.htm
George.
ETF SCREENER
* Friday, September 21, 2012
Find ETFs by selecting from the criteria given:
> Price & Performance
> Fund Category
> Price-to-Earnings Ratio (P/E)
> Price-to-Book Ratio (P/B)
> Management & Expenses
http://online.wsj.com/public/quotes/etf_screener.html?mod=topnav_2_3022
George.
Bond Offering Calendar
* Friday, September 21, 2012
> Treasurys
> Public and Municipal Finance
> Corporate Debt
http://online.wsj.com/mdc/public/page/2_3022-bondoffer.html?mod=topnav_2_3022
George.
Dividend Stocks
* Friday, September 21, 2012
> Top-Yielding Stocks
> Ways to Invest for Dividends: ETFs
> Stocks With the Fastest Dividend Growth
> High-Yielding Mutual Funds
http://online.wsj.com/mdc/public/page/2_3022-scandiv.html?mod=topnav_2_3062
George.
Insider Spotlight
* Insider Activity for the week ending Friday, September 21, 2012
> Insider Buying
> Insider Selling
> Insider Planned Sales
> Companies with Insider Activity
> Companies with Planned Sales
> Sectors
http://online.wsj.com/mdc/public/page/2_3024-insider1.html?mod=topnav_2_3062
George.
Nasdaq Daily Sentiment Index
* Friday, September 21, 2012


Description
http://www.market-harmonics.com/free-charts/sentiment/nasdaq_sentiment.htm
George.
Dow Transports Tests Major Support Level and Dow Theory
By Arthur Hill
* Friday, September 21, 2012

The Dow Transports surged to resistance last week and plunged to support this week. Overall, the junior Average has been stuck in a trading range since mid June with support at 4900 and resistance around 5250. A break below 4900 would be clearly bearish for the Average and negative for Dow Theory.
http://blogs.stockcharts.com/
George.
Click on "In reply to", for Authors past commentaries.
Stocks’ future return: Just 5.6% annualized By Mark Hulbert
* Friday, September 21, 2012 
Commentary: Model has enviable record forecasting 10-year returns
Ned Davis, of Ned Davis Research, for example, argues that one of the causes of the widening profit margins has been little more than financial engineering: “Corporations have, since 1984, been borrowing in the debt market in order to take over other companies’ stock (and boost profit numbers) or to finance buy-backs, which lower the number of shares. This makes earnings per share magically higher with really no increase in profits at all.”
Low interest rates have also been a major factor in profit growth, according to Davis. “Unfortunately, the Fed cannot lower interest rates below zero, so this bullish factor for earnings is rapidly approaching the end of its contribution to profits’ growth.”
If we assume that profit margins do come back down, then Arnott’s forecasted return of 5.6% annualized becomes too optimistic. GMO, for example, is forecasting that the stock market will produce virtually no real return over the next seven years.
Now that’s really depressing.
http://www.marketwatch.com/story/stocks-future-return-just-56-annualized-2012-09-21?link=home_carousel
George.
Click on "In reply to", for Authors past commentaries.
Citi see stocks falling by 20% in worst-case fiscal cliff scenario
* Friday, September 21, 2012
How bad could going over the “fiscal cliff” be for investors? Try a 20% decline in equity prices, Citi Research analysts said in a note on Friday.
That’s under a worst-case scenario mapped out by analysts about what happens if big tax hikes and spending cuts are allowed to take effect at the beginning of next year. It’s one of three scenarios contemplated. The other two envision sidestepping some of the fiscal cliff measures like tax hikes, and hatching a “grand bargain” of fiscal consolidation.
With Congress about to leave town until after the elections — and no visible progress on the fiscal cliff — the worst-case scenario becomes all the more interesting. If there’s no deal, the Citi analysts say that in addition to the decline in stock prices, oil prices would drop by $20 a barrel; a 5% depreciation of the dollar is possible; and unemployment would rise to at least 9.5% through 2014, from 8.1% in August.
The analysts note that there is “little if any probability” that lawmakers would allow the worst-case fiscal cliff scenario — coupled with a failure to raise the debt ceiling — to play out.
Both the House and Senate are scheduled to adjourn on Friday, although the Senate could stay longer to wrap up some unfinished business. That makes the post-election session of Congress all the more important.
“The prospect of a lame duck Congress adjourning with only promises of action would likely make for a stressful year end and could be a serious jolt to financial stability at the start of the year,” the analysts write. “Investors would have no assurance that lawmakers could avert the tax hikes and spending cuts and also extend the debt limit in a timely way.”
–Robert Schroeder
http://blogs.marketwatch.com/election/2012/09/21/citi-see-stocks-falling-by-20-in-worst-case-fiscal-cliff-scenario/
George.
SPX: Follow Up of the Short Term EWP By The wave trading
* Friday, September 21, 2012

During this week I have been clearly shifting my bias to the bearish side.
Major Reasons:
A potential complete EW count off the June 4 low
Reversal of momentum indicators from overbought readings
Weakening of the McClellan Oscillator
By the way yesterday the Oscillator has issued a sell signal by crossing the zero line with a bearish cross of the MA.

Today I add to the list:
Reversal of Crude Oil (It usually maintains a positive correlation with SPX).
Kick off of a likely pull back of EUR.
Troublesome divergence of DJ Transports and SMH.
Yesterday I mentioned that we are in a short-term waiting game since the internal structure of the pull back still favors the bulls since we ONLY have a 3-wave down leg, and we all know that until now every single corrective pull back has been ALWAYS aggressively bought.
But an apparently corrective harmless pattern can morph into a larger correction if we see more conviction by the bears.
Keep in mind that what I am talking about is a potential correction phase and not a major reversal.
Yesterday I mentioned that an impulsive down leg could have shifted the trend to the down side. We got the impulsive down leg but without any follow through. Instead OPEX players aggressively bought it?
The eod picture looks bullish with a nice daily hammer, but if we analyze the internals of the move we can see that rebound off yesterday's lod is not impulsive, therefore EW wise bulls are failing to take advantage a bullish friendly EWP.

So if price is unable to rise with an impulsive move it should mean the price is now involved in the initial stages of a potential larger correction.
So far we have a 3-wave down leg that can be labeled as wave (A) of a larger Zig Zag or wave (W) of a Double Zig Zag.

Hence the corrective looking rebound in progress should be a wave (B) or (X) that may or not reach the September 14 "potential short term Top".
In my opinion we have the gap at 1465.77, which if it not closed then the resumption to the down side could be a matter of 1 - 2 days at the most and we will have a Lower High.
If the sequence of higher lows/highs shifts to lower highs/lows then we will have the confirmation that a correction phase is in progress.
Regardless of this short term issue (Lower High or Double Top) looking down the next support is located in the area of 1440 - 1438.
In addition we have to consider that once/if we have the official kick off of the correction price could retrace the 0.382 Fibonacci of the June's up leg = 1395.
Today we have Quarterly OPEX and the statistics is overwhelmingly favoring the bears: Since 1990 the week after the September opex has been positive ONLY 4 years. Will Ben instruct his generals to abort the bear's chance?
Have a great weekend.
http://www.thewavetrading.com/2012/09/21/spx-follow-up-of-the-short-term-ewp-14/
George.
Click on "In reply to", for Authors past commentaries.
The AAII Investor Sentiment
* Sentiment Survey Results Week ending 9/19/2012
Bullish 37.5%
Neutral 30.5%
Bearish 33.80%
Change from last week:
Bullish: +1.0
Neutral: -1.8
Bearish: +0.8
Long-Term Average:
Bullish: 39%
Neutral: 31%
Bearish: 30%
http://www.aaii.com/sentimentsurvey/
George.
Click on "In reply to", to see past Survey Results.
Nasdaq Daily Sentiment Index
* Wednesday, September 19, 2012
Description
George.
Clive Maund >>> Silver Market Update
* Monday, September 17, 2012

The strong uptrend in silver of the past several weeks is believed to mark the start of a major uptrend that should take the price comfortably to new highs before it’s done. On the 12-year log chart for silver below we can see that this uptrend is still in its infancy, as it has a target at the top channel return line shown, which means it should get to over $60 on this advance, a modest objective given the stunt pulled by the SPSC (Silver Price Supporters Club) over at the Fed last week.

Silver is approaching an inner trendline that appears to still have some validity, the pale blue trendline shown on the chart, and given that this coincides with a resistance level shown on the 2-year chart below and that silver is now critically overbought short-term, and also that its COT readings are at extreme levels, and also that the good news is now on the street, a period of consolidation or a minor reaction here looks likely, which would set up the next upleg. Before leaving the 12-year chart note the momentum breakout shown by the MACD indicator at the bottom of the chart.

Silver’s 2-year chart makes plain that it has now broken out decisively from the long corrective downtrend in force from April – May of last year. Moving averages are now swinging into bullish alignment again for the first time in a long time and we should soon see the “Golden Cross” where the 50-day moving average rises up through the 200-day, and the latter turns up, which will be a sign that the new uptrend is becoming established. Silver is now critically overbought on its RSI indicator shown at the top of the chart, which suggests that it is likely to take a rest soon before continuing higher – most likely it will consolidate for a while, and perhaps react back somewhat – but it is not expected to react back much, given that the Fed last week hooked up the fire hoses to the gas pump with every intention of spraying gasoline on the spreading fires of inflation. This makes perfect sense from their point of view, as the massive QE now set in motion will enable them to continue to enrich their crony pals in the banks and on Wall St by simply passing this spirited into existence money straight to them, and by propping up the bond market, and pass the bill for this munificence on to the middle and lower classes via roaring inflation and a zero return on savings.
The 6-month chart for silver shows recent action in much more detail. On this chart we can see the powerful, steep uptrend of recent weeks, that has in part been fuelled by panic short covering, of course, and last week got an extra boost from the grandstanding by the Fed, which was on a scale that surprised even those expecting QE, for not only did they announce QE, but they even went as far as promising that it would be open-ended, and also their intention to clamp interest rates near to zero for another year, until 2015. This is all music to the Precious Metals markets of course, and all but guarantees ongoing strong uptrends. Nevertheless, we can see that silver is heavily overbought here short-term with several technical factors pointing to it needing to take a rest before continuing higher, and this fits with the fundamental situation as all the good news is now out and on the street.

One technical factor pointing to silver needing to take a breather here is the latest COTs. On the COT chart below we can see that Commercial short positions are about to fly off the scale, with Large and Small Spec long positions being at very high levels too, and here we should note that this data is only up to date as of last Tuesday, so Thursday’s spike in the silver price can reasonably be expected to have driven these positions to even more extreme levels. This makes a period of consolidation or a reaction here likely before the uptrend continues towards our objective at new highs.

http://www.clivemaund.com/article.php?art_id=67
George.
Click on "In reply to", for Authors past commentaries.
Clive Maund >>> Gold Market Update
* Tuesday, September 18, 2012
Last week was a momentous one when the financial world passed the point of no return. Right after a German court cleared the way for massive European QE to get underway, steamrollering opposition from German politicians and the German public in the process, the Fed announced not just QE3, which was expected, but open-ended and unlimited QE and suppression of interest rates over a longer timeframe. The Fed has declared open warfare not just against the dollar and savers in general, but against the entire American middle and lower classes, who will be progressively stripped of their assets and impoverished, the better to serve the interests of the banking class and the elites at large.
It is interesting that the Fed fired its biggest guns right after the German courts cleared the way for Europe to do QE on a grand scale in a similar manner. This means that the dollar and euro are going to go down in value pretty much in lockstep, so we are going to have to take this into account when looking at dollar index charts, which have a very heavy euro weighting, as going forward the dollar index chart may partially mask the ensuing dollar collapse. This brings us to another point – is the rest of the world going to stand by and watch and do nothing as the dollar accelerates into a downward slide, which will have the advantage for the US of devaluing its huge debts in real terms and increasing its competitive advantage re exports? – the answer to that is no – everybody is going to be in on the game and the fiat race to the bottom will intensify fuelling accelerating global inflation even as economies shrivel.
Last week also signaled that we are entering the endgame stage – where the accelerating demise of fiat leads first to rampant inflation and then hyperinflation, devastating global economies and leaving them a smoking ruin, at which point, finally stripped of their comfy sofa and TV set and other essentials of life like food and power, the masses go on the rampage, and “do an Iceland” on the bankers and politicians who brought them to this pass. Then and only then can we start over.
The Fed is playing a very dangerous game. While it is, or should be, hard for any person of even moderate intelligence to understand why anyone would want to invest in either the US bondmarket or the dollar, given the hopeless debt problems afflicting the US, there are still a lot of investors out there who haven’t given up faith. These latest cavalier actions by the Fed have essentially given a 2 fingered salute to investors in US dollar assets, and could be the last straw that brings out a wave of dumping of US assets, especially as the effects of this policy become more and more apparent with passing time.
From all of the foregoing it should be obvious that with the starting gun having been fired last week on the fiat endgame, where wave of wave of money creation drives the value of fiat lower and lower, not just in the US and Europe, but around the world, the price of anything with real or intrinsic value is going to go up and up and up – the most obvious beneficiaries being gold and silver.
The predictions made in the last Gold and Silver Market updates turned out to be correct. A pause was predicted, which we got and then a breakout and strong run, which also duly occurred. We were wrong last week, however, in predicting a “sell on the news” reaction to the outcome of the Fed meeting. This was based on markets front running the news from the German courts and the Fed, but even we did not expect such unashamed generosity from the Fed – it’s easy to be generous with other peoples’ money, or rather money you yourself create out of thin air – we didn’t just get QE3, which was largely expected and discounted, but open-ended QE, along with an extended commitment to hold rates close to zero. This is what ignited further strong gains in the Precious Metals and the broad stockmarket.
So what does all this mean for the Precious Metals, and for gold in particular? It means that they are to go up and up and up and not just against the dollar but against most other currencies, and as the fight to preserve wealth from the depredations of inflation intensifies, the scarcity value of gold and silver should guarantee gains that more than compensate for the loss in value of currencies – in other words their gains should more than offset inflation. If, late in the endgame, as the increasingly desperate Fed and other Central Banks accelerate their already discredited policies to put off the day of reckoning by heaping still more debt on debt, inflation morphs into hyperinflation, then of course gold and silver will go parabolic and ultimately arrive at prices that would even impress that great Keynesian Robert Mugabe of Zimbabwe who took Keynesianism to exalted heights that most of its proponents can only dream about.
Let’s now look at the charts to see how gold is shaping up. On the long-term 12-year log chart we can see that gold remains in a fine and orderly long-term uptrend that has been in force from mid-2005. In a freak move occasioned by the 2008 crash, gold broke down from this uptrend briefly, late in 2008, but its decline stopped at a classic support level and it quite quickly repaired the damage by hopping back into the uptrend, and it has been a case of onward and upward ever since.

We can see that gold has begun a major new uptrend in recent weeks, but is still some way from taking out its highs of August. It should have little trouble doing so before much longer, and given what went down last week, the chances of it double topping with those highs is now rated as close to zero. Once new highs are attained it should accelerate away to the upside, with the Fed graciously providing a monthly reminder of why it should do so. Before leaving this long-term chart we should note how it shows that the new uptrend is still in its infancy, and that the projected upper boundary of the uptrend allows us to estimate a target for this move in the $2400 area.
Those old boys who openly lusted after the likes of Brigitte Bardot , showing commendable taste, even if it resulted in them being chased down by their wives with a frying pan or rolling pin, will surely appreciate the curvaceous nature of gold’s ascent shown on its 12-year arithmetic chart. This is the chart of a commodity that is clearly accelerating into a spectacular parabolic blowoff move that could take it much, much higher than current levels.

The 2-year chart shows that we now have a clear and decisive breakout from the lengthy 3-arc Fan Correction. Moving averages are swinging into bullish alignment, with the 50-day about to rise up through the 200-day and in so doing confirm the birth of a new uptrend. Gold is now extremely overbought on its short-term RSI, shown at the top of the chart, but not so overbought on its MACD, which shows that there is room for further upside before it pauses for a while to rest. So it looks likely that it will run at the resistance at about $1800 and stop and rest to digest its gains at about this level, and there is some chance that it could press on as far as the highs of last August at over $1900 before consolidation set in.

The 6-month chart shows recent action in more detail. On this chart we can see that gold is now super critically overbought on its RSI indicator, and and it can continue higher in this overbought state for some time, the chances of a consolidation/reaction setting in soon are now quite high, the reading of this indicator puts us on notice to expect consolidation/correction soon, even if it continues higher for a little while first, and this would make sense given that all the “good news” with respect to EU and Fed largesse is now common knowledge.

The latest gold COT are showing quite extreme readings so we may see gold pause to consolidate its gains soon, and maybe react somewhat, and it is appropriate that it should do so here having almost arrived at the first resistance level shown on its 2-year chart above. Here we should note, however, that these COT readings could “fly off the scale” during a particularly dynamic uptrend, as we have seen happen with Crude Oil and the Euro fx COT charts in the past.

We will close by taking a quick look at the dollar. The dollar index has now broken down from its uptrend by a clear margin, and is expected to continue to drop. Last week the Fed declared open-ended warfare on the currency which will become the victim of relentless dilution going forward. The only mitigating factor is that other countries and trading blocs are going to follow the Fed’s example and go in for currency dilution of their own, with the German court last week clearing the way for massive Fed style European QE. What this means is global QE, so we should see gold rising against most currencies as their buying power is eroded by dilution. Given the magnitude of the Fed’s assault the support levels shown on this chart are unlikely to count for much, and it could easily crash them quite quickly. Over time however the dollar’s demise may be masked on this index chart by as Europe races to catch up in the QE stakes and the euro is thus subjected to similar treatment.

http://www.clivemaund.com/article.php?art_id=68
George.
Click on "In reply to", for Authors past commentaries.
QE3 Infinity - Ron Paul, Peter Schiff, Ben Bernanke
dees.jpg)
QE3 SENDS SHORTS SCURRYING By Tom Bowley
* Saturday, September 15, 2012
Living in the Washington DC area, I'm not sure which was more exciting - QE3 or RG3!
The market was set up for higher prices as traders anticipated more quantitative easing. Fed Chairman Bernanke did not disappoint. By providing a third round of quantatative easing, the Fed aims to stimulate our sagging economy and boost employment. Traders saw an opportunity and endorsed the plan by buying equities and commodities and bailing out of the dollar and treasuries.
When QE1 was announced in 2008, the treasury market was caught off guard and rates fell precipitously after the Fed announcement with traders flocking into treasuries. A few months later, when QE1 was increased, again traders flocked into treasuries with the yield tumbling 50 basis points the day of the announcement. Take a look:
Traders did a much better job anticipating QE2 and QE3, however, with rates tumbling BEFORE the announcements. Check out how far yields had fallen ahead of the QE2 and QE3 announcements:
I've been expecting QE3 for months. The money that poured into treasuries and equities simultaneously nearly guaranteed it. Both the treasury market and stock market sent the Fed the message that further help was needed. And on Thursday, the Fed delivered and global markets soared.
Nearly every area of equities benefitted, but the falling dollar had an exceptionally bullish effect on energy and materials. If QE3 works as intended, our economy should improve and riskier areas like technology should see rapidly rising EPS. And it's a subcomponent of technology - networking - where I saw confirmation of a bottoming pattern this past week. Technically, few areas have as much upside as networkers because they haven't really participated in prior 2012 rallies. Here's the bottoming pattern:
Several networking stocks look solid technically, but I have my eye on two in particular. For more details on these two stocks, CLICK HERE.
Happy trading!
http://blogs.stockcharts.com/
George.
Click on "In reply to", for Authors past commentaries.
|
Followers
|
33
|
Posters
|
|
|
Posts (Today)
|
0
|
Posts (Total)
|
3350
|
|
Created
|
08/09/11
|
Type
|
Free
|
| Moderator StkMktPirate | |||
| Assistants NYBob DiscoverGold RC Philly warpig38 | |||


The History of Austrian Economics, Part 1 | Dr. Israel Kirzner
The History of Austrian Economics, Part 2 | Dr. Israel Kirzner
|
Posts Today
|
0
|
|
Posts (Total)
|
3350
|
|
Posters
|
|
|
Moderator
|
|
|
Assistants
|
| Volume | |
| Day Range: | |
| Bid Price | |
| Ask Price | |
| Last Trade Time: |


