 News
News  Market Data
  Discover
Support: 888-992-3836
Copyright © 2023 InvestorsHub Inc.


Register for free to join our community of investors and share your ideas. You will also get access to streaming quotes, interactive charts, trades, portfolio, live options flow and more tools.
Atlas Financial Holdings. By removing the powerful broker tools from your trading weapons you will solve nothing. You will lose an edge, and they will always continue to manipulate and exploit number. Particularly market makers. Nothing you can do about that.
What is AFH???
I won't use broker software, too easy for them to track retail and exploit the numbers.
I've slowly learned to flip stocks like this while waiting for the long run payoff. Yesterday I got in with $5K, and out today and took a $520 profit. I use a TradeStation scan to identifies stocks that are having a monster pullback during the post or premarket sessions. Then I work the RTM (reversion to the mean). PLaying with AFH now. It opened today with a down gap of 57% due to poor earnings. AFH may take a little more time to recover.
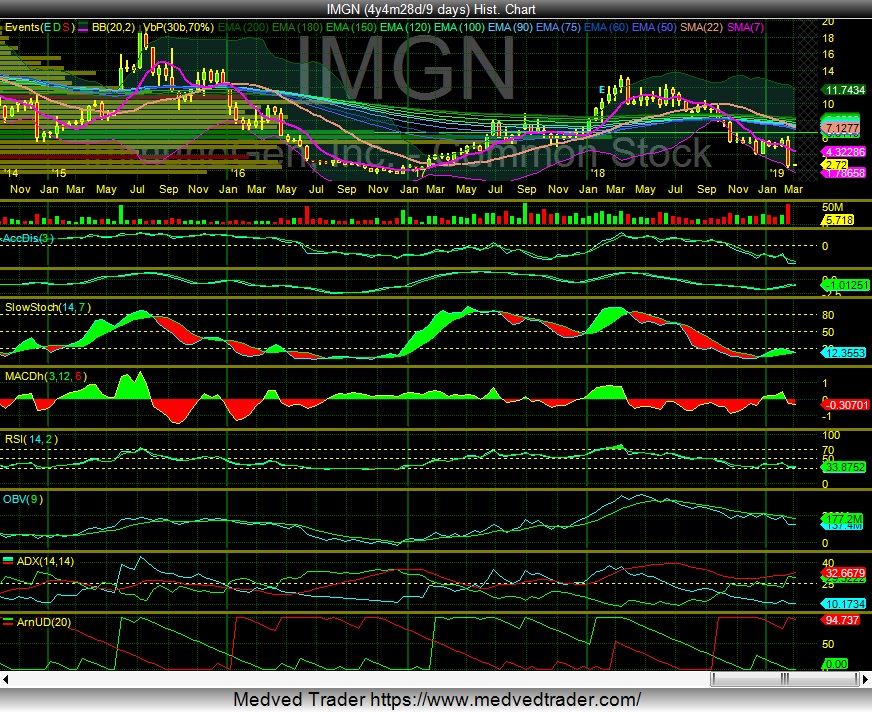
I like the 9 day chart for stepping back a bit..
A weekly chart can be subject to paint and the longer time period simplifies the chart.
The $5-$7 range has strong VBP resistance but institutional interest has gone from 70 to 85% from end of 2017 to end of 2018 (current numbers unknown). This could be a flushing out of weak hands, retail included.
The Big Boys are the largest investors:
 File Date	Form	Investor		Opt	Prev
 Shares	Current
 Shares	Change
 (Percent)	Prev Value
 ($1000)	Current Value
 ($1000)	Change
 (Percent)
 2019-02-04	13G/A	BlackRock Inc.			8,493,975	12,378,204	45.73
 2019-02-14	13G/A	Redmile Group, LLC			10,906,962	10,884,607	-0.20
 2019-02-12	13G/A	VANGUARD GROUP INC			9,655,527	10,492,223	8.67
 2019-02-14	13G/A	Clearbridge Investments, LLC			11,071,365	8,406,481	-24.07
 2019-02-14	13G	STATE STREET CORP			8,345,380	8,100,371	-2.94
 2019-01-11	13G	MORGAN STANLEY				8,026,699
 2019-02-13	13F	FMR LLC / Fidelity			7,497,597	6,427,984	-14.27	71,002	30,855	-56.54
 2019-02-12	13F	Renaissance Technologies LLC			6,312,640	6,182,140	-2.07	59,781	29,674	-50.36
 2019-02-15	13F/A	MILLENNIUM MANAGEMENT LLC			837,142	4,389,260	424.31	7,928	21,068	165.74
 2019-02-12	13F	PRIMECAP MANAGEMENT CO/CA/			3,788,800	3,765,000	-0.63	35,880	18,072	-49.63
 2019-02-14	13F	Arrowpoint Asset Management, LLC			1,927,950	3,606,724	87.08	18,258	17,312	-5.18

While what you are saying is true, we should see some major RTM profits being made off of IMGN over the coming months. Reversion to the mean.
While I agree they're diversified, and the upcoming presentations at AACR has some products that previously have not been discussed, most of the products they've developed or are working with partners are in early stage clinical or preclinical development. IMGN853 is the only product that in the immediate future can provide routine earnings.
All this could change with one or more new partnership, or perhaps a current partner taking a big step into a pivotal trial, but barring that IMGN853 is the product that should bring in earnings that could eventually reach billions a year. It will probably be the middle of the next decade before other products reach approval consideration.
Gary
I share your optimism. Also, IMGN is somewhat diversified so that mitigates risk some as well.
I think you're right, and it could do better than that if at ASCO they commit to filing a BLA for IMGN853 before the end of the year after conferring with the FDA.
I believe it was the FDA who insisted in having the weakest patients in this trial, not who IMGN originally wanted to target, clearly that caused the failure. If they look at the subsets which would have gained approval it's clear that the drug is achieving acceptable benefits, and survival data appears to improve with time, even if progression is noted. Is the progression actually pseudoprogression, i.e. the tumor essentially necrotic mass, that may need to be determined.
In short, I believe if the company clearly demonstrates that approval should happen during the first half of 2020, the stock will achieve new 52 week highs before the years end.
Gary
I think this will be a 'double' by this summer.
At the end of the fiscal year, Immunogen Inc has the cash and cash equivalents of $262.3 million, compared with $267.1 million in the previous year. The company had no long term debt, compared with $2.05 million in the previous year. Immunogen Inc has a financial strength rank of 5 (out of 10).
At the current stock price of $2.51, Immunogen Inc is traded at 73.7% discount to its historical median P/S valuation band of $9.54.
IMGN
Right but he stated the obvious really by saying not only it traded side ways after it hit bottom at around the ~ $2.26 mark but it actually held and went up from the lows to close near the high of the day / closer to his $2.60 "weak" resistance mark.
Notice the the mini "blue Skies" he mentioned above the 2.60 mark
Note: This company has over 290 million dollars in cash and alot in the pipelines as well.... So this is a good buy and I already got me some at the 2.27 mark
Lets see what happens Monday!
IMGN
$$$$$$$ 3.75 $$$$$$ By mid next week
Above the $3 mark.
395 Million dollars in cash!!!
Plus much more stuff in the pipelines
IMGN
* * $IMGN Video Chart 03-01-2019 * *
Link to Video - click here to watch the technical chart video
ImmunoGen:
- PFS and overall survival periods were longer in the subset of patients with high folate receptor alpha expression who took ImmunoGen's drug than in the group of patients on chemotherapy.
- A higher confirmed overall response rate was also observed in the subset of patients who took mirvetuximab soravtansine.
- some of the positive efficacy signals that were observed in the Forward study. The best hope for mirvetuximab soravtansine now, though, will be as part of a combination regimen. Enyedy noted that ImmunoGen has generated some encouraging data in combo therapy studies.
- ImmunoGen does have three additional antibody-drug conjugates in development. ImmunoGen also has around $295 million in cash to fund operations and advance its candidates.
IMGN
Exactly.Tjus I am thankful I was able to pickup some shares at the 2.27 mark
The trial didn't fail - it missed endpoints.
The company learned something from the trial. It was a partial success.
Now hold for partnership announcements.
IMGN is almost 100% based on Ovarian, and their leading trial failed is a big deal! Also, its valued at $1.98
Apparently this is how institutions get to 100% ownership.
"Even though FORWARD I did not meet its primary endpoint, I continue to be impressed with the efficacy and tolerability of mirvetuximab soravtansine in ovarian cancer patients, especially in the subset with high FRa expression," said Dr. Kathleen Moore, associate director of clinical research at the Stephenson Cancer Center at the University of Oklahoma. "I look forward to continuing to work with ImmunoGen to analyze the Phase 3 data and determine the most appropriate path to bringing mirvetuximab soravtansine to those patients who benefit most from it."
The overall response rate for the company's treatment was ultimately higher than for those in the study who were treated with chemo,,
IMGN
Agreed!
________________________________________________________________
Options are active today - this may be the dump before the pump....
IMGN
This is an WAAY over reaction and it's a great buy at these levels
IMGN
http://investor.immunogen.com/news-releases/news-release-details/immunogen-announces-multiple-presentations-aacr-annual-meeting
Perhaps this will make tomorrow a much better day.
I believe the company stabbed itself in the foot by not announcing the trial was clearly running long and they'd be adjusting the clinical trials database in such a manner as to not need to adjust it again. I think the dates used in the updates were extremely conservative, I believe we'll see top line data at or before ASCO.
Gary
It's a reaction to phase 3 trial delay. I believe patients are living longer, but the Street doesn't like delays.
Gary
Options are active today - this may be the dump before the pump....
10:18 this AM

At noon:

About 10 am on the 12th:

* * $IMGN Video Chart 02-06-2019 * *
Link to Video - click here to watch the technical chart video
Also interesting that TDA just recently increased their margin on IMGN from 40% to 50%.
Blackrock - it figures....
BlackRock Inc. discloses 8.30% ownership in IMGN / Immunogen, Inc.
February 04, 2019 - BlackRock Inc. has filed an SC 13G/A form with the Securities and Exchange Commission (SEC) disclosing ownership of 12,378,204 shares of Immunogen, Inc. (NASDAQ:IMGN). This represents 8.3 percent ownership of the company. In their previous filing dated February 01, 2018, BlackRock Inc. had reported owning 8,493,975 shares, indicating an increase of 45.73 percent.
Other investors with positions similar to BlackRock Inc. include Redmile Group, LLC, and Vanguard Group Inc.
Immunogen, Inc. has declared a standard industrial code (sic) of 2834 which is the "Pharmaceutical Preparations" industry. BlackRock Inc.'s top industries are "Legal Services" (sic 81), "Miscellaneous Repair Services" (sic 76), and "Agriculture production livestock and animal specialties" (sic 02).
It's my belief that brokerages each have their own margin requirements, and they're subject to change. I've not used margin for years, but got killed previously when requirements either were changed for IMGN, or when it's price slipped to the point where the requirement changed. I certainly believe it's a way that the brokerages, and MM play with individual investors to manipulate stock price.
In at least one case, I saw the allowable margin to go from 50% to zero purely based on a decision by a brokerage that the stock was too volatile to permit any use of margin. It certainly dropped the share price dramatically, and I suspect some Institution was able to load up with shares cheaply. In part I believe such manipulation is why the stock is as low as it is today, as I've heard that some brokerages increased their margin requirements. Just add some positive news on the Phase 3 Trial and I believe we'll be looking at new 52 week highs, but until we get such news, no telling how low it might go.
Gary
Sorry , I purchased shares and never checked out this hub until now . If Schwab or any firm increaes your maintenance requirements it’s for another investor to get in for less than you . It’s a panic and hopefully you are all long . This was the best information I could have read . Knowing from experience that the only reason they needed you off margin is for their protection . No brokerage firm cares about the retail investor and they are only interested in their large institutional accounts . I wonder what was the biggest volume day after the margin protection occurred . The exchange use to have to give clients a 30 day notice . Look into this !
OPTIONS back on line at TDA late in the day, this is postmarket:

IMGN - options showing a blank from TDA this AM.
This is what I saw yesterday and on the 14th:


This is from 12/28/18

I think you're right, and I thought we'd be seeing new highs by now, but clearly it's all about the Phase 3 Trial, and we should know about that in the near future, but we don't know how near. Perhaps JPM will answer that question, meanwhile the latest company corporate presentation looks positive, I suspect they know more than they can say.
Over the decades it's been common to compare IMGN with SGEN, I've never been able to justify why SGEN's market cap is so much higher than IMGN's given the successes, and failures both companies have had. I believe that if IMGN gains approval of IMGN853 before SGEN achieves an approval for another drug, IMGN's market cap will exceed that of SGEN, over a ten banger from where we are today. In comparing the company, SGEN has not yet proven effective against a solid cancer, IMGN has. SGEN abandoned it's leukemia drug due to toxicity problems, IMGN's IGN drugs continue to advance in this area, and some degree of efficacy is being seen in escalating trials. Where IMGN falls short is earnings, they monitized Kadcyla, which only was to receive royalties from Roche whereas SGEN still owns the majority of the drug they have approved, but they're yet to be profitable based on earnings from it. In short, IMGN853 should be the first wholly owned drug that IMGN gains approval from, while SGEN has one, but both have examples of other drugs which have failed, or appear to be succeeding that are both in house and partnered with others. SGEN however still has a major investment from Roche, yet Roche's one approved conjugate drug is Kadcyla, Herceptin conjugated with DM1 utilizing IMGN's technology.
I believe that both companies will have future success, but given the marked difference in the market caps, IMGN should be the superior investment at this time.
Gary
I think they're trying to discourage buying though...
There's a sizeable call position for 1/18 at $9.
 	Symbol	Bid	Ask	Last	Vol	Opn Int	Change	Change %
 	.IMGN_190118C2	3.1	3.5				-2.94	-100
 	.IMGN_190118C3	2.15	2.4	1.45		21	-0.49	-25.25773196
 	.IMGN_190118C4	1.2	1.5	1.1		48
 	.IMGN_190118C5	0.5	0.65	0.65	118	950	0.29	80.55555556
 	.IMGN_190118C6	0.05	0.2	0.17	16	1,086	0.0452	36.21794872
 	.IMGN_190118C7		0.15	0.05	5	337	0.0156	45.34883721
 	.IMGN_190118C8		0.5	0.01		970	0.0014	16.27906977
 	.IMGN_190118C9		0.5	0.05		5,444	0.0479	2,280.95238095
 	.IMGN_190118C10		0.3	0.05		444	0.0495	9,900
 01/04/19	16:28:28	4.94	4.66	4.94	694,700
 01/04/19	16:00:00	4.94	4.93	4.94	259,326
 01/04/19	11:15:40	4.92	4.91	4.92	308,000
 01/03/19	17:05:22	4.75	4.65	5.21	123,300
 01/03/19	16:00:00	4.755	4.75	4.76	234,805
 01/02/19	16:30:11	4.78	4.68	4.85	3,261,200
 01/02/19	16:14:17	4.78	4.68	4.77	3,261,200
 01/02/19	16:00:04	4.78	4.68	4.78	290,700
 01/02/19	16:00:04	4.78	4.68	4.78	281,900
 01/02/19	16:00:04	4.78	4.68	4.78	579,385
 01/02/19	16:00:00	4.78	4.77	4.78	722,250
 12/27/18	16:00:00	4.44	4.46	4.47	125,022
 12/26/18	16:00:00	4.49	4.48	4.49	493,035
 12/24/18	13:00:00	3.96	3.96	3.97	117,461
 12/21/18	17:13:42	3.94	3.94	4.39	227,600
 12/21/18	16:15:55	3.94	3.81	4.39	496,300
 12/21/18	16:13:31	3.94	3.81	3.96	522,300
 12/21/18	16:06:02	3.94	3.81	3.96	195,600
 12/21/18	16:00:00	3.965	3.95	3.96	1,901,834
 12/21/18	13:29:49	4.00	3.99	4.00	181,700
 12/21/18	09:30:00	4.29	4.08	4.56	280,400
 12/20/18	17:25:33	4.23	4.05	5.72	142,700
 12/17/18	17:13:11	5.18	5.06	5.42	121,500
 12/17/18	16:42:01	5.18	5.06	5.42	230,600
 12/13/18	16:19:58	5.39	5.35	5.44	230,600
The recent gains IMGN made since it's most recent lows shouldn't put people into margin calls unless they've been staying right on the edge of what was permissible. Once it's above $7 again I suspect they'll lower the requirement and allow maximum margin for those who wish to do so. Depending on what's said Wednesday at the JPM Healthcare Conference, $7 or more may come very quickly. I don't know that they can announce unblinding the Phase 3 Trial at that time, but if not, I think they can estimate how close it is. Clearly the results of the Phase 3 will either send the stock to new highs, or new lows, I believe it will be highs.
Gary
TDA bumped up the maintenance requiremnt on IMGN today- now 50%, was closer to 35% last week.
I was encouraged by the EOD block.
December blocks >=100,000 per TDA streamer.
 12/26/18	16:00:00	4.49	4.48	4.49	493,035
 12/24/18	13:00:00	3.96	3.96	3.97	117,461
 12/21/18	17:13:42	3.94	3.94	4.39	227,600
 12/21/18	16:15:55	3.94	3.81	4.39	496,300
 12/21/18	16:13:31	3.94	3.81	3.96	522,300
 12/21/18	16:06:02	3.94	3.81	3.96	195,600
 12/21/18	16:00:00	3.965	3.95	3.96  1,901,834
 12/21/18	13:29:49	4.00	3.99	4.00	181,700
 12/21/18	09:30:00	4.29	4.08	4.56	280,400
 12/20/18	17:25:33	4.23	4.05	5.72	142,700
 12/20/18	16:00:00	4.22	4.23	4.24	355,150
 12/19/18	16:00:00	4.585	4.59	4.60	116,170
 12/18/18	16:00:00	5.01	5.01	5.02	215,588
 12/18/18	10:45:09	5.08	5.07	5.08	100,000
 12/17/18	17:13:11	5.18	5.06	5.42	121,500
 12/17/18	16:42:01	5.18	5.06	5.42	230,600
 12/17/18	16:00:00	5.18	5.18	5.19	176,565
 12/14/18	16:00:00	5.185	5.18	5.19	154,173
 12/13/18	16:19:58	5.39	5.35	5.44	230,600
 12/13/18	16:00:00	5.39	5.39	5.40	232,775
 12/12/18	16:00:01	5.43	5.42	5.46	210,500
 12/12/18	16:00:00	5.43	5.42	5.43	210,576
 12/10/18	17:24:54	5.38	5.40	5.50	141,100
 12/10/18	16:01:02	5.38	5.01	5.49	275,293
 12/07/18	16:42:24	5.34	5.35	5.55	143,500
 12/07/18	16:36:40	5.34	5.35	5.56	170,600
 12/04/18	17:03:01	5.54	5.55	5.95	230,800
 12/03/18	17:11:12	5.75	5.64	5.80	144,500
 12/03/18	16:38:20	5.75	5.64	5.80	170,600

 [/quote]
Two presentations.. surely they must have something to say..
We'll see :)
Xena,
I believe the real question by these presentations is, where does the Phase 3 trial stand. People are questioning whether data will support approval, and clearly that's created the weakness in the stock. The best news would be positive top line data from the trial, but baring that, if they indicated that based on progress in the trial that top line data will be out by a date certain, investors would have something to look forward to.
I believe the data will be positive, and if so, I think we'll see new 52 week highs and the $18 target of many analysts may be met or exceeded. Of course if I'm wrong and the data doesn't support a BLA submission that's deemed to be solid, new lows will continue. The key is what's in the data. Clearly the data in the combination trials which really was incomplete has been a drag on the stock, that too may improve as additional data is added, but approval based on the Phase 3 is most important. In the future, after the drug is approved and available, I suspect that combinations that have yet to be tried may prove to be more effective than any combinations to date, but that experimentation can only occur once the drug is available to experiment with, except when used under right to try provisions the FDA is developing.
Gary
Webcasts scheduled for Jan. 9 & 10..
http://investor.immunogen.com/
The fundamentals are intact... Hopefully when the market reverses so will IMGN.
Today's new lows based on CFO leaving after charges at another company being validated is a buying opportunity IMHO, I purchased near these lows last week, but for any who haven't, it ought to be a consideration.
By this time next week we should have ASH results for our two newest drugs in trials. I also believe by year's end we'll learn that the Phase 3 for IMGN853 is unblinded, and the data's being collected. Hopefully we'll have top line data early next year. If all of this is positive, I cannot help but believe that we'll be seeing new 52 week highs, rather than lows, in the very near time future. Results of partners trials during the next few months could also add to positive sentiment toward the company.
Depending on the timing of the data gathering and submission of a BLA, approval of IMGN853 should occur either late 2019 or early 2020. Of course this assumes the data continues to be positive in the trial.
Gary
These are the blocks >= 5,000. It appears to me that that 1.8 million @ $5.50 put a floor in. After that almost all went through at higher prices. I am thinking it just may be Friday funny business, shaking out retail that might have bought today.
 11/02/18	16:55:46	5.67	5.60	5.75	37,200
 11/02/18	16:11:05	5.8718	5.60	5.95	9,700
 11/02/18	16:00:05	5.655	5.60	5.89	9,417
 11/02/18	16:00:00	5.65	5.66	5.67	157,596
 11/02/18	15:59:58	5.655	5.65	5.66	8,942
 11/02/18	15:59:39	5.6675	5.66	5.67	5,277
 11/02/18	15:55:07	5.705	5.69	5.70	8,365
 11/02/18	15:55:01	5.705	5.70	5.71	7,817
 11/02/18	15:18:03	5.69	5.69	5.70	7,600
 11/02/18	13:48:01	5.85	5.85	5.86	5,200
 11/02/18	12:25:34	5.63	5.65	5.67	14,000
 11/02/18	12:11:41	5.72	5.72	5.73	5,000
 11/02/18	11:40:30	5.91	5.91	5.92	5,000
 11/02/18	11:29:54	5.99	5.98	5.99	5,500
 11/02/18	11:27:39	5.97	6.01	6.02	8,400
 11/02/18	11:22:54	6.10	6.10	6.11	5,565
 11/02/18	11:00:48	6.25	6.20	6.23	16,200
 11/02/18	10:53:54	6.15	6.14	6.15	5,100
 11/02/18	10:52:21	6.20	6.19	6.20	5,500
 11/02/18	10:40:11	6.04	6.04	6.06	19,000
 11/02/18	10:40:11	6.04	6.04	6.06	19,000
 11/02/18	10:26:26	6.11	6.16	6.17	8,900
 11/02/18	10:14:02	6.30	6.29	6.31	20,000
 11/02/18	10:12:05	6.29	6.27	6.29	5,200
 11/02/18	10:05:03	6.165	6.15	6.17	25,000
 11/02/18	10:02:22	6.10	6.07	6.09	17,000
 11/02/18	09:53:23	5.92	5.92	5.94	9,300
 11/02/18	09:44:32	6.0505	6.03	6.06	5,900
 11/02/18	09:30:02	6.10	6.00	6.10	6,000
 11/02/18	09:30:00	6.05	6.00	6.10	35,700
 11/02/18	09:30:00	6.28	6.00	6.10	35,792
 11/01/18	17:07:12	5.94	5.94	6.09	8,400
 11/01/18	16:59:30	5.94	5.84	5.99	274,500
 11/01/18	16:00:05	5.95	5.78	5.99	5,523
 11/01/18	16:00:00	5.95	5.93	5.94	151,198
 11/01/18	15:59:57	5.93	5.94	5.95	9,565
 11/01/18	15:59:55	5.9299	5.94	5.95	6,224
 11/01/18	15:59:54	5.93	5.95	5.96	17,034
 11/01/18	15:59:51	5.91	5.95	5.96	5,036
 11/01/18	15:59:51	5.91	5.92	5.93	17,258
 11/01/18	15:59:48	5.90	5.92	5.93	12,298
 11/01/18	15:59:47	5.895	5.91	5.92	9,223
 11/01/18	15:59:45	5.89	5.90	5.91	27,235
 11/01/18	15:59:42	5.88	5.89	5.90	8,500
 11/01/18	15:59:40	5.88	5.88	5.89	5,118
 11/01/18	15:59:40	5.89	5.88	5.89	13,606
 11/01/18	15:59:38	5.88	5.88	5.89	7,635
 11/01/18	15:59:37	5.89	5.88	5.89	10,629
 11/01/18	15:59:33	5.84	5.86	5.87	7,191
 11/01/18	15:57:30	5.83	5.81	5.82	17,035
 11/01/18	15:55:00	5.815	5.84	5.85	15,575
 11/01/18	15:36:50	5.84	5.84	5.85	6,000
 11/01/18	15:31:08	5.85	5.84	5.85	14,000
 11/01/18	14:42:13	5.865	5.86	5.87	12,500
 11/01/18	14:37:31	5.895	5.89	5.90	5,000
 11/01/18	14:04:04	5.86	5.85	5.86	5,500
 11/01/18	13:37:53	5.85	5.85	5.86	8,500
 11/01/18	13:28:48	5.8925	5.89	5.90	5,000
 11/01/18	13:15:32	5.90	5.90	5.91	7,000
 11/01/18	13:07:35	5.94	5.94	5.95	24,200
 11/01/18	12:20:04	5.965	5.96	5.97	16,800
 11/01/18	12:19:32	5.965	5.96	5.97	25,000
 11/01/18	12:17:35	5.965	5.96	5.97	7,400
 11/01/18	12:05:34	5.98	5.96	5.97	13,400
 11/01/18	11:40:44	5.88	5.87	5.88	43,200
 11/01/18	11:13:18	5.90	5.88	5.90	20,000
 11/01/18	11:00:42	5.845	5.84	5.85	25,000
 11/01/18	10:58:11	5.90	5.89	5.90	25,000
 11/01/18	10:56:54	5.90	5.88	5.90	10,000
 11/01/18	10:49:27	5.90	5.95	5.96	7,000
 11/01/18	10:48:10	6.00	5.99	6.00	30,000
 11/01/18	10:47:24	5.9972	5.99	6.00	5,000
 11/01/18	10:46:09	5.98	5.97	5.98	8,400
 11/01/18	10:45:28	5.96	5.95	5.97	8,800
 11/01/18	10:42:34	5.82	5.84	5.86	50,000
 11/01/18	10:41:45	5.88	5.83	5.85	8,800
 11/01/18	10:41:36	5.78	5.77	5.78	9,300
 11/01/18	10:37:03	5.68	5.66	5.68	5,000
 11/01/18	10:35:08	5.66	5.65	5.67	11,400
 11/01/18	10:33:38	5.595	5.58	5.59	15,000
 11/01/18	10:32:23	5.5875	5.59	5.59	15,100
 11/01/18	10:28:32	5.525	5.52	5.53	7,800
 11/01/18	10:27:44	5.52	5.51	5.52	14,900
 11/01/18	10:27:12	5.52	5.52	5.53	15,000
 11/01/18	10:26:14	5.505	5.50	5.51	5,200
 11/01/18	10:25:29	5.50	5.48	5.49	1,800,000
 11/01/18	10:25:28	5.49	5.48	5.49	7,700
 11/01/18	10:14:21	5.535	5.52	5.53	5,300
 11/01/18	10:11:59	5.53	5.52	5.53	30,000
 11/01/18	09:35:36	5.465	5.45	5.47	13,900
 11/01/18	09:33:37	5.495	5.48	5.51	6,000
 11/01/18	09:31:58	5.4801	5.48	5.52	5,000
 11/01/18	09:30:00	5.45	5.43	5.76	19,200
 10/31/18	17:03:04	5.43	5.41	6.39	86,200
 10/31/18	16:34:57	5.43	5.41	6.39	271,500
 10/31/18	16:00:23	5.43	5.41	5.49	9,600
 10/31/18	16:00:05	5.43	5.41	5.49	47,500
 10/31/18	16:00:05	5.42	5.41	5.49	54,719
Unfortunately IMGN didn’t hold 6$ today...still wait some sign of reversal
$$$$
I don't find Clay Trader's charts very useful.. only one indicator was discussed and that huge buy at $5.50 was ignored.
* * $IMGN Video Chart 11-01-18 * *
Link to Video - click here to watch the technical chart video
Trades >=50,000 per TDA streamer data:
 11/01/18	10:42:34	5.82	5.84	5.86	50,000
 11/01/18	10:25:29	5.50	5.48	5.49	1,800,000
 10/31/18	17:03:04	5.43	5.41	6.39	86,200
 10/31/18	16:34:57	5.43	5.41	6.39	271,500
 10/31/18	16:00:05	5.42	5.41	5.49	54,719
 10/31/18	16:00:00	5.43	5.42	5.43	491,464
 10/30/18	16:00:00	5.51	5.51	5.52	111,102
 10/29/18	16:00:00	5.605	5.61	5.62	239,672
 10/29/18	10:22:23	6.00	6.03	6.04	248,600
 10/26/18	16:00:00	5.885	5.89	5.90	152,128
 10/26/18	12:48:30	6.00	6.04	6.05	247,700
 10/26/18	10:59:00	6.00	6.00	6.02	250,000
 10/25/18	16:51:11	6.18	5.50	6.30	86,200
 10/25/18	16:00:05	6.16	6.17	6.29	62,889
 10/25/18	16:00:00	6.16	6.16	6.17	280,817
 10/25/18	11:06:46	6.20	6.19	6.20	50,000
 10/24/18	16:00:05	5.885	5.88	6.04	82,557
 10/24/18	16:00:00	5.88	5.88	5.89	384,292
 10/23/18	16:01:44	6.3283	6.26	6.27	152,300
 10/23/18	16:00:00	6.26	6.26	6.27	175,184
|
Followers
|
60
|
Posters
|
|
|
Posts (Today)
|
0
|
Posts (Total)
|
1106
|
|
Created
|
02/12/02
|
Type
|
Free
|
| Moderators | |||
http://www.immunogen.com/about-us
http://finance.yahoo.com/q/h?s=IMGN
Our mission is to be the leader in the application of monoclonal antibodies for the treatment of cancer. We aim to achieve this by exploiting our expertise and experience in the identification of potential biological targets for cancer treatments, the development and humanization of monoclonal antibodies, and the creation of potent cell-killing agents designed for delivery by antibodies. Our Targeted Antibody Payload(TAP) technology uses tumor-targeting antibodies to deliver a highly potent cell-killing agent specifically to cancer cells to kill these cells with minimal damage to healthy tissue.
We are committed to the highest standards of scientific excellence and integrity for the benefit of patients, the medical community, our partners, shareholders and employees.
| Volume | |
| Day Range: | |
| Bid Price | |
| Ask Price | |
| Last Trade Time: |


