 News
News  Market Data
  Discover
Support: 888-992-3836
Copyright © 2023 InvestorsHub Inc.


Register for free to join our community of investors and share your ideas. You will also get access to streaming quotes, interactive charts, trades, portfolio, live options flow and more tools.
Gold Miners’ Q2’22 Fundamentals
By: Adam Hamilton | August 19, 2022
The major gold miners just finished reporting their latest quarterly results, revealing how they are actually faring fundamentally. This Q2’22 earnings season was particularly important with inflation raging in its first super-spike since the 1970s. Traders need to know how higher prices are affecting mining costs and thus profitability, especially after a serious correction left sector sentiment languishing near bearish extremes.
The most-popular major-gold-stock benchmark remains the venerable GDX VanEck Gold Miners ETF. Launched way back in May 2006, it has since parlayed its first-mover advantage into an insurmountable lead. Even in its present battered state, mid-week GDX’s net assets of $10.7b dwarfed those of the next-largest 1x-long gold-miners-ETF competitor by a staggering 27.3x! GDX is effectively the only game in town.
While it feels like ancient history now, the larger gold miners dominating GDX were actually enjoying an excellent 2022 until mid-April. GDX had surged 27.6% year-to-date, amplifying gold’s parallel rally by a big 3.4x! That was much better than GDX’s usual 2x-to-3x leverage to material gold-price moves. But then unfortunately an unusual confluence of anomalous market events sprung the hangman’s trapdoor.
The Fed’s most-extreme hawkish pivot in its entire century-plus history ignited a parabolic US-dollar rally, catapulting its leading benchmark to an extreme 20.1-year high! That spawned monster leveraged gold-futures selling, slamming the yellow metal sharply lower. By the time that unsustainable puking exhausted itself in mid-July, gold had corrected 14.3%. GDX leveraged that by 2.8x, plummeting a brutal 39.8%!
While big volatility is par for the course in this high-potential sector, the ill timing of that epic gold-futures purge was crushing. With inflation raging in its biggest super-spike since the 1970s, gold and its miners’ stocks certainly should’ve been soaring. Even the lowballed headline US Consumer-Price-Index inflation prints during Q2 ran red-hot blasting 8.3%, 8.6%, and 9.1% higher year-over-year in April, May, and June.
The latter was the worst CPI read since way back in November 1981! During the 1970s inflation super-spikes, monthly-average gold prices from trough-to-peak CPI months nearly tripled during the first then more than quadrupled during the second! So gold’s recent correction fueled by that anomalous, extreme, and unsustainable gold-futures dumping proved extra-damaging to speculators’ and investors’ sentiment.
While that did pound gold prices 6.8% lower through Q2’22, the yellow metal was still doing quite well. Gold’s quarterly-average closing price of $1,872 in Q2 was only 0.4% lower sequentially from Q1’22, and still actually climbed a solid 3.2% YoY from comparable Q2’21 levels! So despite the psychological angst, the gold miners still had a strong gold environment to sell into. Q2’22 saw the fourth-highest average gold ever.
So the major gold miners’ latest operating and financial results from last quarter should’ve proven good. The big question requiring a deep dive into their quarterly reports was how much is this raging inflation affecting their variable input costs? While most gold-mining costs are effectively fixed when mines are being planned, once operational they still consume plenty of supplies purchased at prevailing prices.
For 25 quarters in a row now, I’ve painstakingly analyzed the latest results released by GDX’s 25-largest component stocks. These include the world’s biggest gold miners, which now account for a commanding 87.2% of this ETF’s entire weighting. Digesting hard fundamental results as they are released is essential for cutting through obscuring sentiment fogs. It helps traders rationally understand gold stocks’ real outlook.
This table summarizes the operational and financial highlights from the GDX top 25 during Q2’22. These gold miners’ stock symbols aren’t all US listings, and are preceded by their rankings changes within GDX over this past year. The shuffling in their ETF weightings reflects shifting market caps, which reveal both outperformers and underperformers since Q2’21. Those symbols are followed by their current GDX weightings.
Next comes these gold miners’ Q2’22 production in ounces, along with their year-over-year changes from the comparable Q2’21. Output is the lifeblood of this industry, with investors generally prizing production growth above everything else. After are the costs of wresting that gold from the bowels of the earth in per-ounce terms, both cash costs and all-in sustaining costs. The latter help illuminate miners’ profitability.
That’s followed by a bunch of hard accounting data reported to securities regulators, quarterly revenues, earnings, operating cash flows, and resulting cash treasuries. Blank data fields mean companies hadn’t reported that particular data as of the middle of this week. The annual changes aren’t included if they would be misleading, like comparing negative numbers or data shifting from positive to negative or vice-versa.
As feared, the major gold miners widely reported mounting inflationary input-cost pressures last quarter. Those certainly forced overall mining costs higher, cutting into profitability. But excluding a couple crazy outliers, these elite GDX-top-25 gold miners still generally held the line on costs. Considered as a whole, they performed impressively given this raging inflation unleashed by extreme central-bank money printing.

The world’s bigger gold miners have long struggled with production growth. They operate at such huge scales that it’s almost impossible to replenish their gold mined. They simply can’t discover or buy enough gold deposits at necessary sizes to overcome relentless depletion. And they can’t develop the ones they do find or acquire into new mines rapidly enough. So major gold miners have long suffered shrinking output.
Thus the 8,497k ounces of gold the GDX top 25 collectively mined last quarter was a pleasant surprise. Those were the best levels since Q4’20, climbing a healthy 2.6% YoY! Shuffling into and out of GDX’s upper ranks wasn’t a material factor, with its top holdings remaining fairly-static. That was even a good showing for these major gold miners compared to Q2’s world mined output per the World Gold Council.
In its latest fantastic quarterly Q2’22 Gold Demand Trends report, global mine production climbed 4.0% YoY to 911.7 metric tons. Interestingly the GDX top 25 only accounted for 29% of that output. Their share is generally shrinking as the majors struggle to fill their often-massive production pipelines with enough new deposits and mines. But they did add enough over this past year, bucking their vexing trend.
A mega-merger helped, with Agnico Eagle Mines buying Kirkland Lake Gold for $10.7b in stock. That deal was announced in late September, and closed in early February. That’s the sole reason AEM has the best Q2 production growth of all the majors, soaring 71.4% YoY! Tellingly that is still 2.5% lower than the two predecessor companies’ total output in Q2’21. Mergers only temporarily mask depletion for one year.
But the sad gobbling-up of Kirkland Lake, which had been the best major gold miner by far fundamentally for many years, didn’t distort overall GDX-top-25 output much. The replacement moving up into these elite ranks was the tiny ludicrously-overvalued Osisko Gold Royalties. It only sold a trivial 14.9k ounces of gold in Q2’22, the worst in these ranks and radically not major-gold-miner material! Osisko isn’t the only one.
As a professional gold-stock speculator for decades now, I’ve never understood investors’ love-affair with the tiny royalty companies. They crowd into these driving their market capitalizations up to nose-bleed extremes relative to their gold outputs and profits. Franco-Nevada has long been the third-largest GDX component, and Royal Gold is ascending. Both royalty companies have way-higher valuations than true miners.
Barrick Gold and Franco-Nevada had similar market caps this week, but the former sported a low 14.7x trailing-twelve-month price-to-earnings ratio while the latter’s was 32.6x. And Barrick produced 1,043k ounces of gold last quarter fueling $717m in accounting profits, dwarfing the mere 103k ounces sold by Franco-Nevada earning just $197m. Why pay way more for much-smaller and less-profitable gold stocks?
With inflation raging, the GDX top 25’s impressive production growth in Q2 is really overshadowed by their mining costs. In normal times, unit gold-mining costs are generally inversely-proportional to gold-production levels. That’s because gold mines’ total operating costs are largely fixed during pre-construction planning stages, when designed throughputs are determined for plants processing gold-bearing ores.
Their nameplate capacities don’t change quarter-to-quarter, requiring similar levels of infrastructure, equipment, and employees to keep running at full-speed. So the only real variable driving quarterly gold production is the ore grades fed into these plants. Those vary widely even within individual gold deposits. Richer ores yield more ounces to spread mining’s big fixed costs across, lowering unit costs and boosting profitability.
But while fixed costs are the lion’s share of gold mining, there are also sizable variable costs. Energy is the biggest category, including electricity to power ore-processing plants including mills and diesel fuel to run excavators and dump trucks hauling raw ores to those facilities. Other smaller consumables range from explosives to blast out ores to chemical reagents necessary to process various ores to recover their gold.
The GDX-top-25 gold miners’ Q2’22 reports had many mentions of inflationary pressures in the latter. I took notes on these while wading through the latest results, and examples were legion. Mighty Newmont Corporation, the world’s largest gold miner by far, blamed higher mining costs on “inflationary pressures, driven by higher labor costs and an increase in commodity inputs, including higher fuel and energy costs”.
Paying workers more is one of the stickier forms of price inflation, as cutting compensation later is terrible for employee morale. Thankfully Newmont was more of an outlier in that regard. The second-largest GDX component Barrick Gold was more typical, citing “the impact of higher input prices driven by energy and consumables from inflationary pressures” driving costs higher. Those costs rise and fall with market prices.
Another major gold miner AngloGold Ashanti warned due to the “resultant disruption of supply chains, certain key commodity supplies are experiencing volatility and inflationary pressures. These include oil and lubricants, ammonia-related products (explosives and cyanide) and labour.” Cyanide is an essential chemical for gold mining, sprinkled on heap-leach pads of crushed ore to filter through and dissolve out gold.
SSR Mining emphasized this price inflation infecting the variable-cost side of gold mining, writing that it is “continuing to face increased cost pressures especially in fuel, electricity, and reagents across the business”. While there were many more inflation warnings from the major gold miners, these are a good sample. Plenty GDX-top-25 gold miners also expect inflationary cost pressures to persist in coming quarters.
Agnico Eagle Mines certainly wasn’t alone in saying mining costs going forward will be higher, “Given that inflationary pressures are expected to continue in the second half of 2022, the Company believes that total cash costs per ounce and AISC per ounce could trend towards the top end of these ranges.” Some major gold miners are shifting their full-year-2022 mining-cost forecasts to the high side of their guidances.
Cash costs are the classic measure of gold-mining costs, including all cash expenses necessary to mine each ounce of gold. But they are misleading as a true cost measure, excluding the big capital needed to explore for gold deposits and build mines. So cash costs are best viewed as survivability acid-test levels for the major gold miners. They illuminate the minimum gold prices necessary to keep the mines running.
Last quarter the GDX top 25 reported average cash costs of $918 per ounce, which rocketed up an eye-popping 24.9% YoY! Those also proved the highest on record, way above Q4’21’s $853 before central-bank-money-printing-fueled inflation really spiraled out of control this year. While that remains far under prevailing gold prices, that trend is still troubling. Thankfully Q2’22’s $918 was heavily distorted by two outliers.
If just the crazy-high cast costs of $1,132 reported by Pan American Silver and $1,989 from First Majestic Silver are excluded, the rest of the GDX top 25 only averaged $838. That would only be the third-highest witnessed after the preceding couple quarters. Most of the major gold miners are holding the line on their costs despite these inflationary pressures, which is impressive. PAAS and AG have single-mine problems.
During the long 25 quarters I’ve been doing these deep analyses, I’ve always used simple averages of costs. Until this quarter, it never occurred to me that production-weighted averages might be smarter. I’m going to think about that going forward. Should AG’s dreadful $2,429 AISCs for just 19k ounces of gold from one mine be equally weighted with Newmont’s $1,199 for 1,495k ounces across about fourteen mines?
PAAS’s anomalously-high costs resulted from a shortfall at its largest gold mine. With just a couple years left until it is depleted, ore grades diverged from drilling results. So Pan American thinks drilling got lucky, striking higher-grade pockets than the wider ore body. So it partially wrote down that old mine, and made a negative inventory adjustment to account for less gold likely in ores stacked on that mine’s heap-leach pad.
AG continues to struggle to improve operating efficiencies and drive down costs at its lone primary gold mine acquired in March 2021. Plenty of improvements have been made, and management is forecasting costs falling dramatically later this year. But both the cash costs and all-in sustaining costs reported by that little gold mine in Q2 were some of the most extreme ever for a GDX-top-25 gold miner, a short-lived anomaly.
All-in sustaining costs are far superior than cash costs, and were introduced by the World Gold Council in June 2013. They add on to cash costs everything else that is necessary to maintain and replenish gold-mining operations at current output tempos. AISCs give a much-better understanding of what it really costs to maintain gold mines as ongoing concerns, and reveal the major gold miners’ true operating profitability.
Ominously the GDX-top-25 gold majors’ AISCs soared 19.7% YoY to an all-time-record high of $1,281 in Q2’22! Had those been righteous and not heavily-skewed, the gist of this essay would’ve been different. I’d be more concerned about inflation driving up mining costs. But again just excluding those same outlying costs from those single gold mines of Pan American Silver and First Majestic Silver, things are way better.
The rest of the GDX top 25 averaged far-more-reasonable $1,161 AISCs last quarter without PAAS and AG. Those remain the second-highest on record after Q4’21’s $1,188, so they certainly aren’t low. But they would’ve been up a much-milder 8.5% YoY, which is excellent considering this raging inflation. My wife and I sure wish our family’s grocery bills were only surging that fast, instead of roughly tripling that.
Out of the 8,497k ozs of gold the GDX top 25 mined in Q2’22, those two troubled mines at PAAS and AG only accounted for 54k or 0.6%! Interestingly Pan American Silver clarified that without that one-time inventory charge for lower ore grades, its company-wide gold AISCs would’ve plunged from $2,051 to a way-better $1,540. First Majestic Silver sees its troubled gold mine’s AISCs falling near $1,800 in H2’22.
So the major gold miners’ cost situation mostly driven by volatile consumables isn’t as dire as feared in this inflation super-spike. And most of these surging variable costs including energy will eventually retreat as their supply-and-demand situations normalize. Electricity, diesel, explosives, and reagent chemicals aren’t going to keep surging forever. Supply will catch up with than exceed demand forcing prices lower.
But the GDX top 25’s lofty $1,281 all-in sustaining costs including all these gold miners still really cut into sector implied unit profitability. That is the difference between quarterly-average prevailing gold prices and the major gold miners’ average AISCs. By that measure including those PAAS and AG extremes, per-ounce earnings plunged 20.6% YoY to just $591. That proved the lowest witnessed since Q1’20.
But if those are adjusted to exclude that crazy-outlying 0.6% of overall GDX-top-25 gold output in Q2’22, sector unit earnings looked way better at $711. That would’ve merely been down 4.4% YoY, which is truly remarkable given this raging inflation punishing everyone! That would even be slightly better than the preceding four quarters’ average of $700. So truly the gold miners are faring fine in this environment.
That point was driven home by the hard accounting data reported to securities regulators last quarter, under Generally Accepted Accounting Principles or other countries’ equivalents. The GDX top 25’s total revenues climbed a good 5.0% YoY to $23,834m. That sales growth was fueled by quarterly-average gold prices rallying that 3.2% from Q2’21 to Q2’22, and that impressive 2.6%-YoY production growth achieved.
Bottom-line accounting earnings really amplified those growing revenues, with the GDX top 25’s surging 24.6% YoY to $3,011m last quarter! That didn’t look skewed either, as I didn’t see any large impairments or impairment reversals in these gold miners’ Q2’22 income statements. PAAS’s writedown of that old gold mine with underperforming ore grades was only $99m, small by past gold-mine-impairment standards.
If anything, these major gold miners’ overall sales-and-profits growth over this past year are understated a bit due to a GDX-top-25 composition change. Perseus Mining displaced Centerra Gold as the 25th-largest GDX stock between Q2’21 to Q2’22. As the former is an Australian gold miner that hasn’t yet reported its latest half-year results, it didn’t add any revenues or earnings unlike Centerra in the comparable quarter.
These elite gold miners’ overall cash flows generated from operations also remained strong, just slipping 2.0% YoY last quarter to $6,209m. That’s on the high side of all totals from the last 25 quarters. If this raging inflation was heavily impacting gold miners’ operations, it would certainly filter through to lower operating cash flows. Once the Australian gold miners report H1’22 results, GDX-top-25 OCFs should rise.
And the overall corporate treasuries reported by these elite major gold miners actually surged 7.5% YoY at the end of Q2’22 to hit $22,880m. That not only reveals their underlying operations are healthy, it is the highest cash balance reported in the last 25 quarters and almost certainly ever! That’s a stark contrast to the big US general stocks, which I analyzed last week looking at the S&P 500’s top 25 stocks’ Q2’22 results.
Those gigantic American market-darlings everyone knows saw their cash hoards plunge 17.0% YoY as of the end of last quarter! So the major gold miners are doing comparatively-well in these challenging inflationary times. Their big cash warchests will likely be used to accelerate mine expansions and buying new mines outright. That makes the smaller mid-tier and junior gold miners prime targets for majors to acquire!
I’m going to analyze their latest quarterlies in next week’s essay on the GDXJ-top-25 gold mid-tiers’ Q2’22 results. These smaller gold miners have superior fundamentals and much-greater upside potential than the majors. Operating at smaller scales they can more easily consistently grow their production, while their lower market caps make them easier to bid higher. I’d avoid most of the underperforming major miners.
If you regularly enjoy my essays, please support our hard work! For decades we’ve published popular weekly and monthly newsletters focused on contrarian speculation and investment. These essays wouldn’t exist without that revenue. Our newsletters draw on my vast experience, knowledge, wisdom, and ongoing research to explain what’s going on in the markets, why, and how to trade them with specific stocks.
That holistic integrated contrarian approach has proven very successful, yielding massive realized gains during gold uplegs like this latest getting underway. We extensively research gold and silver miners to find cheap fundamentally-superior mid-tiers and juniors with outsized upside potential as gold powers higher. Their gains are already mounting in our full trading books. Subscribe today and get smarter and richer!
The bottom line is the major gold miners just reported an impressive quarter. They actually managed to grow their collective production, which is unusual at their huge operational scales. And while central banks’ raging inflation did force mining costs higher, excluding a couple tiny extreme outliers the great majority of major gold miners didn’t suffer soaring costs. They are managing these inflationary pressures quite well.
Better output along with Q2’s higher average gold prices fueled good revenues growth. And that helped bottom-line accounting earnings surge nicely despite higher costs. The major gold miners’ profits are still destined to skyrocket in coming years as gold powers much higher to reflect recent years’ epic money-supply growth. That portends massive upside potential in this sector’s temporarily-battered stock prices.
Read Full Story »»»
 DiscoverGold
Bank Bots want it below 1750 now. Lol. Insane run coming. Coiled like a cobra
Forget gold today. Iron fist still in control. Or is that gold finger?
Gold Forecast: Want to Take Advantage of Declines? Keep an Eye on Gold Stocks
By: P. Radomski | August 17, 2022
Very little happened in the precious metals sector yesterday, and practically everything that I wrote yesterday and in Monday’s flagship analysis remains up-to-date.
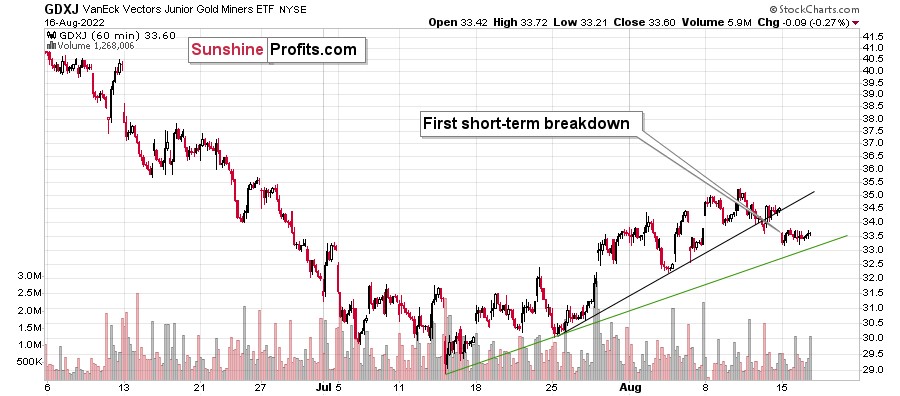
Let’s start with a quick update on the GDXJ’s very short-term chart.
Yesterday, I wrote the following:
Gold declined yesterday, and it did so in tune with what we saw in 2013. The back-and-forth trading continues, but we have some signs that it’s getting close to being over. In other words, it’s likely the case that we won’t have to wait for the decline to re-start much longer.
One of those signs comes from the very short-term GDXJ ETF chart.
Junior miners are after a breakdown below their rising black support line, and the move above the early-August high was clearly invalidated. This means that we saw two small sell signals.
Once the GDXJ declines below the rising, green support line, it will be a good indication that the next big move lower is already underway. Right now, it’s quite possible, but not very likely. In other words, if we see more back-and-forth movement this week, it would still be normal in light of the analogy to 2013 and it would not be something bullish.
Indeed, the junior miners’ ETF moved slightly lower, but overall it stayed between the two support lines. Once we see a breakdown below the green line, we’ll likely “know” (there are no certainties in any market) that the next big move lower has just started.
Gold and silver haven’t done much, and the USD Index declined a little.
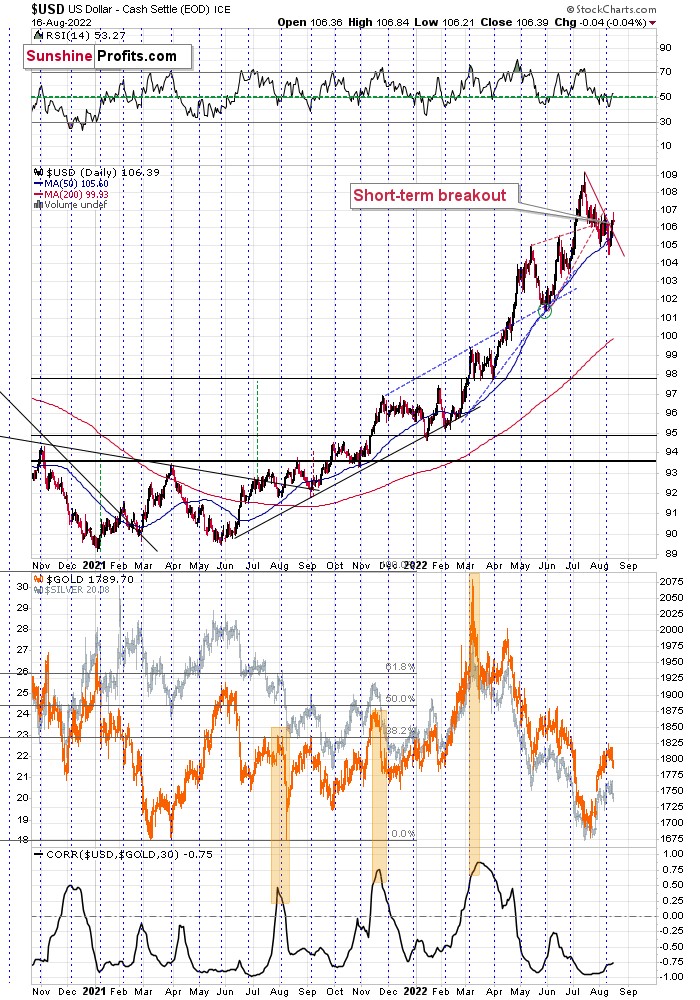
This tiny decline is perfectly normal given the recent short-term breakout. It’s most likely just its verification. Consequently, my previous comments on the above chart remain up-to-date:
Another indication comes from the USD Index, which just moved above its declining red resistance line. It’s up by about 0.3 in today’s pre-market trading, which indicates that the move is likely to continue.
This fits the subtle clues coming from gold and junior miners – the top might already be in.
Even if it’s not, I think it remains a good idea to be well positioned to take advantage of lower prices in the precious metals sector, especially in the junior mining stocks.
One thing that I would like to add today is that the general stock market is approaching a combination of strong resistance levels.
One of them is provided by the all-important 61.8% Fibonacci retracement level based on the entire 2022 decline. The other is the declining resistance line based on the previous 2022 highs. These levels coincide just slightly above the current values of the S&P 500 index – at around 4,365 – implying that the S&P 500 index’s short-term upside is very limited.
The best (here: most bearish) thing about the above chart is not only the above. It’s also a fact that the precious metals sector has already stopped reacting to higher stock market values. Consequently, when stocks finally decline, it’s likely that they will contribute to lower PM values, but at the same time, if they keep rallying, it’s not necessarily likely to make PMs move higher.
This is just one of the factors that creates a great risk-to-reward situation for a short position in the precious metals sector, especially in junior mining stocks. As a quick reminder, the prices of junior miners are more correlated with other stocks than the rest of the precious metals sector.
Summary
Summing up, it seems that the corrective upswing is over (or close to being over), which means that the powerful medium-term downtrend can now resume.
Read Full Story »»»
DiscoverGold
LMBA enjoy while u can. UR days R numbered. HUGE.
MWS will permanently put u out of real business with gold. Use ur paper wisely, u will need it in the bathroom.
Gold got KO’d today. Central bank bots are there all morning. Let’s see after Fed notes.
Gold still walking around the ring punch drunk. No meaningful pattern yet still has a pulse. 1768 is new feeding zone.
Really strange stuff going on today for sure.
GDX with a couple of highly unusual sweepers hitting the tape today
By: Cheddar Flow | August 16, 2022
• $GDX with a couple of highly unusual sweepers hitting the tape today.

Read Full Story »»»
DiscoverGold
GDX $1.8 Million Call Strike: 30 Expiration: 12/16
By: Cheddar Flow | August 16, 2022
• $GDX $1.8M Call
Strike: 30
Expiration: 12/16.

Read Full Story »»»
DiscoverGold
Obviously gold is sitting there not by choice. Economy is sending up flares everywhere all the while Democrats lie with their forked tongues.
No sign of any change, now sitting at 1778, but no sign of advance.
gold and silver were tamped down today when it should have ran hard. signals all day long. result is, it aint going above 1778 until dey is done.
Gold Forecast: Gold Short-Term Dip, Then Higher
By: Jim Curry | August 14, 2022
Recapping Last week
Last week's trading saw Gold forming its bottom in Monday's session, here doing so at the 1786.90 figure. From there, a sharp rally was seen into mid-week, with the metal running up to a Wednesday high of 1824.60 - before backing slightly off the same into the weekly close.
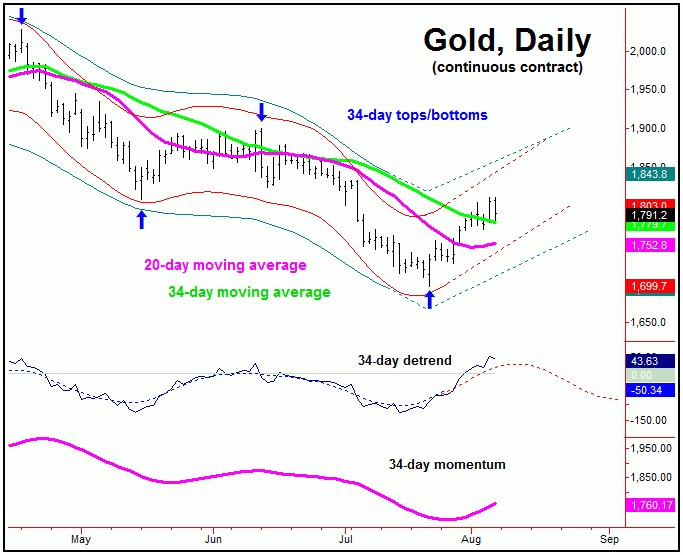
Gold, Short-Term
From the comments made in past articles, the last key low for Gold came from the 10, 20 and 34-day cycles, which bottomed out with the July 22nd tag of the 1696.40 figure (December, 2022 contract). From that low, our outlook called for a significant short- term rally for the metal, which we have obviously seen.
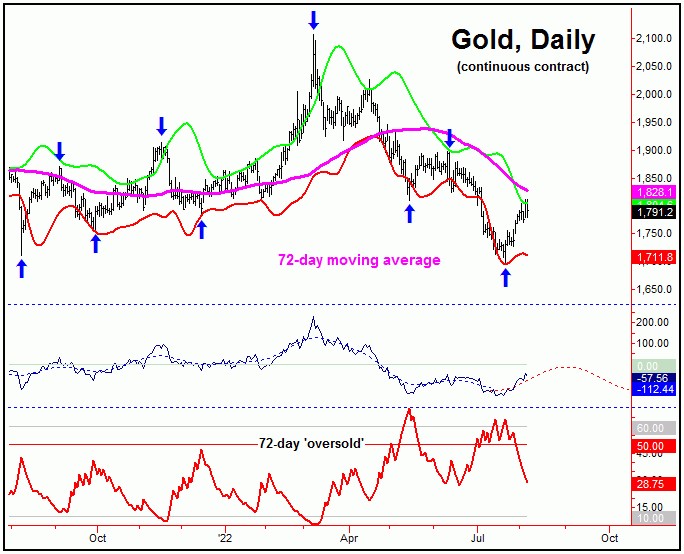
From last weekend: "In terms of price, the 72-day moving average was mentioned as the ideal upside magnet - which is around 36 points above current price levels. With that, the overall assumption is that Friday's pullback will end up as countertrend, giving way to strength again - and higher highs for the move - on the next minor swing up, ideally lasting into mid-month or later."
As mentioned last weekend, the probabilities favored the most recent short-term dip to end up as a countertrend affair, with the 72-day moving average acting as the magnet to the next swing up. With the action seen into last week, we have now met this (72-day moving average) expectation - and thus are now back into short-term topping zone.
The chart below shows our in-between cycle, the 20-day component:
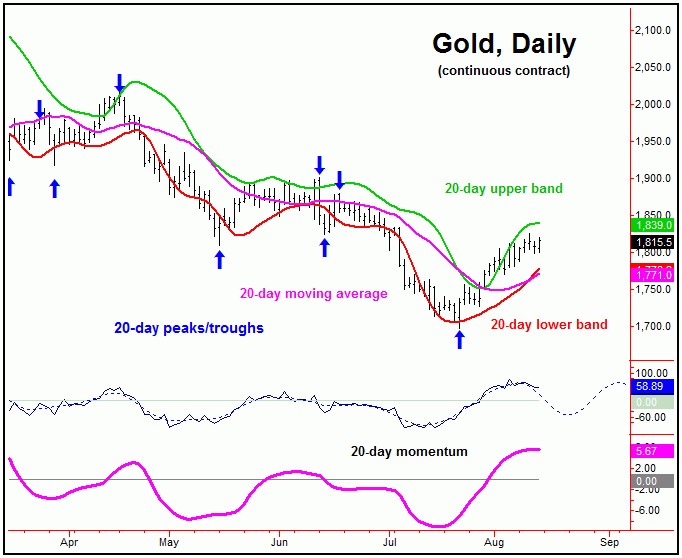
With the above said and noted, the next short-term peak for Gold is now expected to form at anytime - coming from the combination of 10 and 20-day cycles. In terms of price, our Gold Wave Trader noted key resistance to the move at the 1824-1833 region, which was moved into last Wednesday - and which halted the rally for a quick decline into Thursday's session.
Even with the above, it is too early to actually confirm a 10 and 20-day peak to be set in place, though any reversal below the 1797.00 figure (December, 2022 contract) would be our best indication of a turn south with the same.
In terms of price, the next downward phase of the 10 and 20-day cycles is favored to drop back to the 20-day moving average before bottoming, a move which seems likely to end up as countertrend. Support to that decline would also be at or near this same 20-day moving average and/or the lower 20-day cycle band.
Gold's Stepped-Back View
Stepping back slightly, a countertrend dip with the 10 and 20-day cycles in the days ahead - if seen as noted - would be favored to give way to higher highs on the next swing up with these waves. In terms of time, that action would likely put us into the late-August to very early-September timeframe, then to be on the lookout for the next peak with the larger 72-day cycle, shown below:
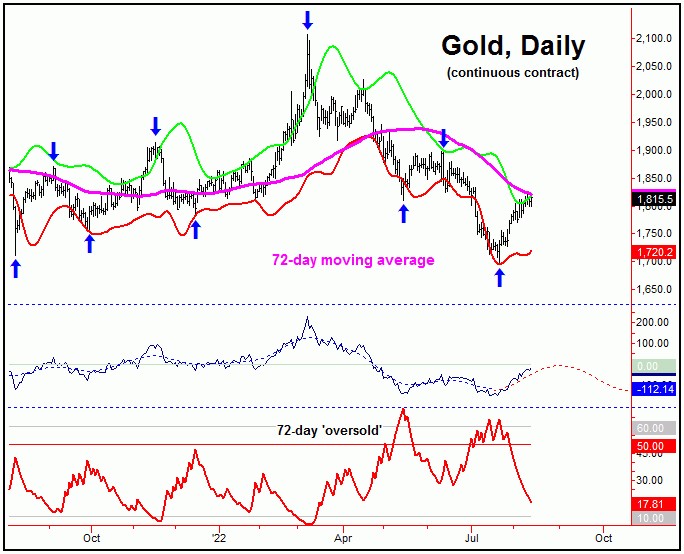
With the above said and noted, following a short-term dip with the 10 and 20-day cycles, the probabilities now favor higher highs with our 72-day wave into the late-August to early-September timeframe. If we are making higher highs with this 72-day wave into that region, then we will need to be on the lookout for key technical signs that this cycle is topping.
One of the key technical signs that we like to watch is our 72-day 'oversold' indicator. Since this indicator moves inversely to price action, a drop below this lower line would be an indication this particular wave is peaking. Stepping back, the next trough for our 72-day cycle - if made on schedule - is due around October of this year, which now looks to be the next key timeframe for the metal. Stay tuned.
Read Full Story »»»
DiscoverGold
well i agree with Mr. Chan, with the exception that my indicators say Way UP for gold and Way Way UP for silver.
Jack Chan: Gold Price Exclusive Update
By: Jack Chan | August 13, 2022
Our proprietary cycle indicator is UP.
To public readers of our updates, our cycle indicator is one of the most effective timing tool for traders and investors. It is not perfect, because periodically the market can be more volatile and can result in short term whipsaws. But overall, the cycle indicator provides us with a clear direction how we should be speculating.
Investors
During a major buy signal, investors can accumulate positions by cost averaging at cycle bottoms, ideally when prices are at or near the daily 200ema.
During a major sell signal, investors should be hedged or in cash.
Traders
Simply cost average in at cycle bottoms when prices are at or near the daily 200ema; and cost average out at cycle tops when prices are above the daily 50ema.
Gold sector is on long term SELL signal.
GLD is on short term buy signal.
GDX is on short term buy signal.
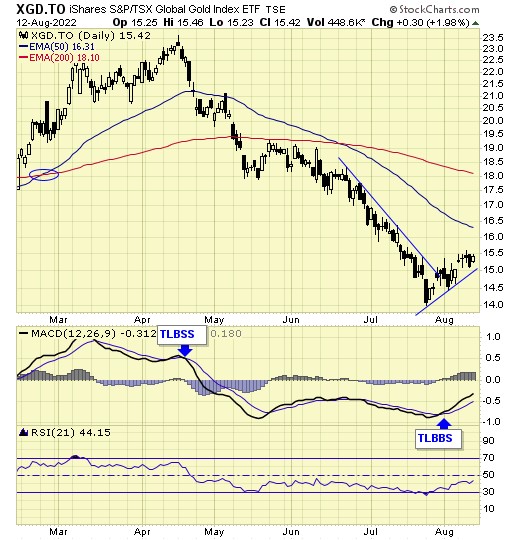
XGD.to is on short term buy signal.
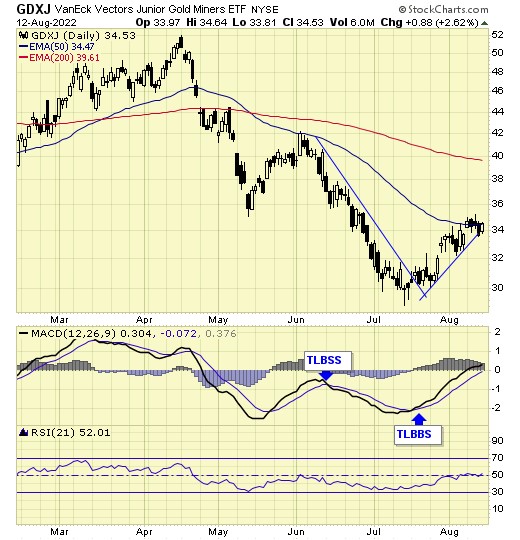
GDXJ is on short term buy signal.
Analysis

Current data supports overall higher gold prices.

Our ratio is on a new BUY signal.

Trend is now DOWN for the dollar.
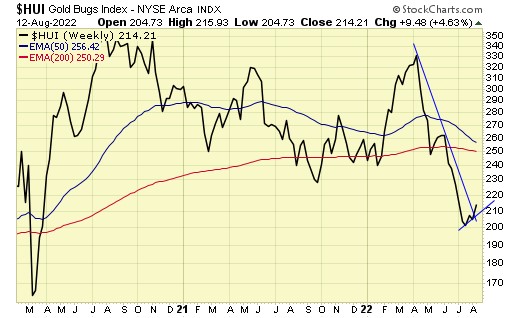
Trend is now UP for gold stocks.
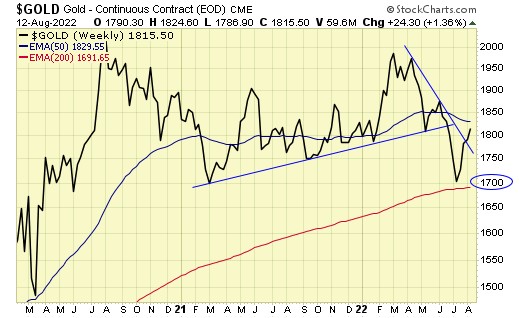
Trend is now UP for gold also.
Downside target achieved.
An inverted head & shoulder bottom is now confirmed.
Summary
Long term – on SELL signal.
Short term – on buy signals.
Gold sector cycle is UP.
$$$ We are now holding trading positions as no core positions should be held during a long term sell signal.
Read Full Story »»»
DiscoverGold
NY Gold Futures »» Weekly Summary Analysis
By: Marty Armstrong | August 13, 2022
The NY Gold Futures closing today at 181550 is immediately trading down about 0.71% for the year from last year's settlement of 182860. This price action here in August is suggesting that this has been a bear market trend on the monthly level. As we stand right now, this market has made a new high exceeding the previous month's high reaching thus far 182460 intraday and is still trading above that high of 181520.
ECONOMIC CONFIDENCE MODEL CORRELATION
Here in NY Gold Futures, we do find that this particular market has correlated with our Economic Confidence Model in the past. The Last turning point on the ECM cycle low to line up with this market was 2015. The Last turning point on the ECM cycle high to line up with this market was 2020 and 2011 and 1996.
MARKET OVERVIEW
NEAR-TERM OUTLOOK
The historical perspective in the NY Gold Futures included a rally from 2015 moving into a major high for 2020, the market has been consolidating since the major high with the last significant reaction low established back in 2015. The market is still holding above last year's low but is trading rather weak at this moment. The last Yearly Reversal to be elected was a Bullish at the close of 2020.
This market remains in a positive position on the weekly to yearly levels of our indicating models.
The perspective using the indicating ranges on the Daily level in the NY Gold Futures, this market remains moderately bullish currently with underlying support beginning at 181160 and overhead resistance forming above at 181700. The market is trading closer to the resistance level at this time. An opening above this level in the next session will imply a bounce is unfolding.
On the weekly level, the last important low was established the week of July 18th at 167840, which was down 5 weeks from the high made back during the week of June 13th. We have been generally trading up for the past 3 weeks from the low of the week of July 18th, which has been a move of .0841%.
INTERMEDIATE-TERM OUTLOOK
YEARLY MOMENTUM MODEL INDICATOR
Our Momentum Models are declining at this time with the previous high made 2020 while the last low formed on 2021. However, this market has rallied in price with the last cyclical high formed on 2020 and thus we have a divergence warning that this market is starting to run out of strength on the upside.
Critical support still underlies this market at 175200 and a break of that level on a monthly closing basis would warn that a sustainable decline ahead becomes possible. Nevertheless, the market is trading above last month's high showing some strength.
DiscoverGold COT - Commitments of Traders in Metals Futures Market Reports
By: Software North | August 12, 2022
Gold

Silver

Read Full Story »»»
DiscoverGold
GDXJ ETF Failed To Benefit From Investors’ Bullish Frenzy
By: Sunshine Profits | August 12, 2022
A weaker-than-expected headline Consumer Price Index (CPI) print didn’t provide the PMs with much stimulation, as gold rallied by 0.08%, silver by 1.27%, the GDX ETF by 0.71% and the GDXJ ETF by 0.12%.
In contrast, the Nasdaq and the S&P 500 rallied by more than 2%. Moreover, with the US Dollar Index declining by 1.10% and U.S. Treasury yields also dropping, the PMs’ relative weakness is profoundly bearish.
Gold Left Out in the Cold
With the CPI coming in cold, jubilation overwhelmed the financial markets, as the S&P 500 and risk-on currencies surged. However, with gold, silver, and mining stocks underperforming, the PMs were largely forgotten during the bullish feeding frenzy.
Moreover, while the consensus celebrates the inflation deceleration, I warned before the opening bell that a slowdown was likely. I wrote:
With investors eagerly awaiting the release of the CPI, the results could sway short-term sentiment. Moreover, while the headline CPI is expected to show a year-over-year (YoY) deceleration – due to the decline in oil and gas prices – the economic pain required to reduce the metric to 2% is materially underestimated by the consensus.
Therefore, while investors may take a glass-half-full approach when analyzing the data, the medium-term implications of eliminating inflation should weigh heavily on gold, silver, and mining stocks.
To that point, with lower oil and gas prices as the main culprits, the medium-term roadmap continues to unfold as expected.
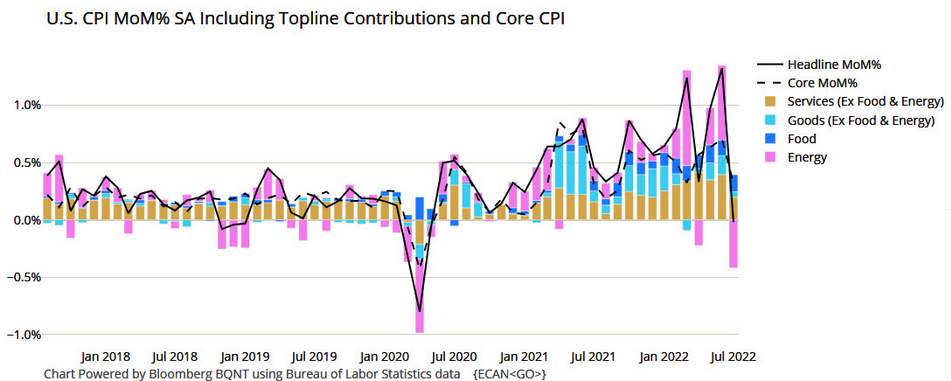
US CPI
To explain, the black line above tracks the month-over-month (MoM) percentage change in the headline CPI, while the colored bars above represent the various components' contributions. If you analyze the right side of the chart, you can see that energy (the purple bar) was the only component to decline MoM in July. As a result, the print didn't reveal anything that we didn't expect.
Likewise, the idea of "peak inflation" is much more semblance than substance. For example, there is a misnomer in the financial markets that the battle is won when inflation stops going up. However, the reality is that reducing inflation to 2% is much more difficult than reducing the pace of the increases. As such, the consensus drastically underestimates the amount of economic pain that's required to achieve true normalization.
In addition, the core CPI increased by 0.31% MoM in July, so inflation is still increasing despite the energy respite. More importantly, investors celebrated an event that occurred several times in the 1970s and1980s, in June 2021 and in March 2022.
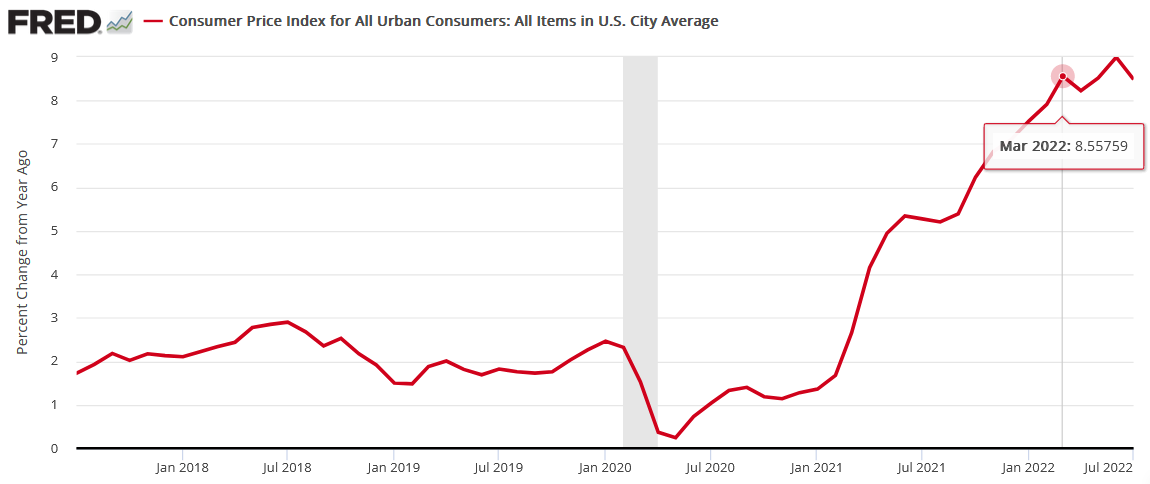
Consumer Price Index - For All Urban Consumers
To explain, the red line above tracks the YoY percentage change in the headline CPI. Remember when “peak inflation” was initially present in March? Likewise, the headline CPI also decelerated from June to August 2021 before increasing once again.
Furthermore, the “peak inflation” crowd also enjoyed plenty of premature celebrations in the 1970s and 1980s.
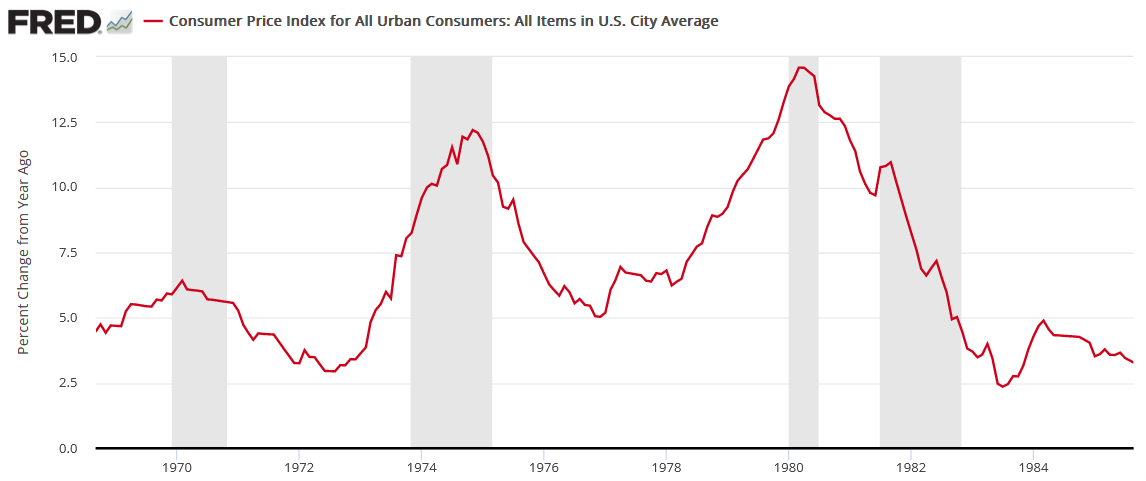
Consumer Price Index - For All Urban Consumers
To explain, the red line above also tracks the YoY percentage change in the headline CPI, and the gray vertical bars represent recessions. Moreover, notice how plenty of short-term decelerations (declines or pauses in the red line) were present. Even during the largely uninterrupted surge from 1978 to 1980, the YoY percentage change in the headline CPI declined or flatlined twice along the way. Therefore, while sentiment rules the day in the short term, the crowd is overly-optimistic about how this all ends.
As further evidence, the Atlanta Fed’s Sticky CPIs hit new 2022 highs.
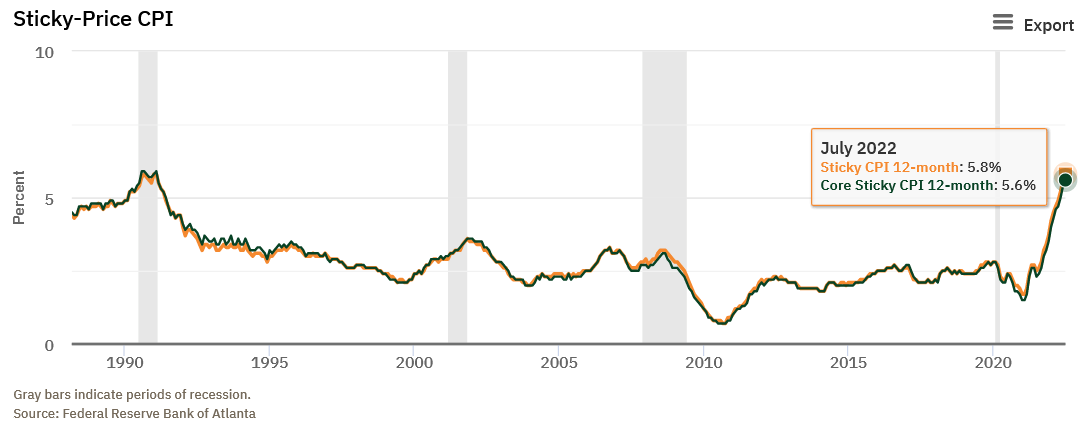
Sticky-Price CPI
The orange and green lines above track the YoY percentage changes in the Sticky and core Sticky (excluding food and energy) CPIs. If you analyze the right side of the chart, you can see that neither decelerated in July. For context, the Atlanta Fed defines the metrics as:
“The Sticky CPI is calculated from a subset of goods and services included in the CPI that change price relatively infrequently. Because these goods and services change price relatively infrequently, they are thought to incorporate expectations about future inflation to a greater degree than prices that change on a more frequent basis. One possible explanation for sticky prices could be the costs firms incur when changing price.”
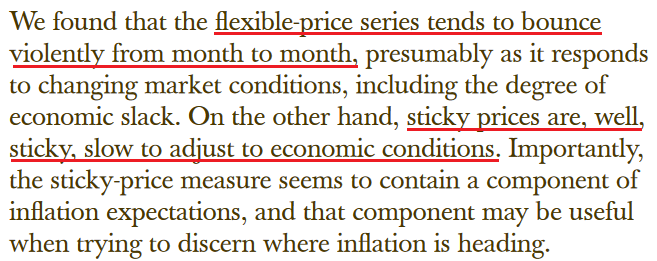
Moreover, a report by Atlanta and Cleveland Fed researchers came to the same conclusion. An excerpt read:
“We are interested in whether changes in the flexible CPI or sticky CPI improve the forecast of headline inflation at various numbers of months into the future…. We find that forecasts of the headline CPI that are based on the sticky-price data tend to be more accurate than the forecasts based on headline inflation. Further, CPI predictions using sticky-price data perform pretty well relative to CPI forecasts using core CPI data. We also find that the relative accuracy of the sticky-price Phillips curve increases as the forecast horizon gets longer.”
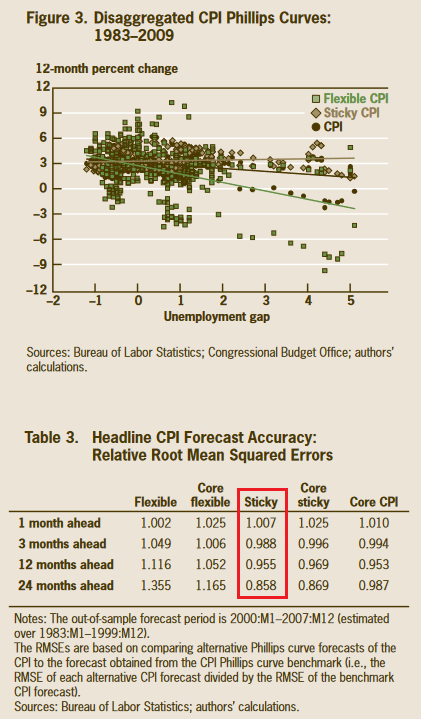
CPI Forecasts
The chart and the red box above show how the Sticky CPI has the smallest forecasting error when attempting to predict the future direction of the headline CPI. Therefore, with the metric hitting a new 2022 high in July, investors' optimism contrasts with the “sticky” realities. To that point, the researchers concluded:
Atlanta/Cleveland Fed Excerpt
Source: Atlanta/Cleveland Fed
Thus, while volatility in the energy markets made the headline CPI look more attractive to the “soft landing” crowd, the Sticky CPI provides important clues about how embedded inflation is in the U.S. economy.
Continuing the theme, I’ve long warned that rent inflation would prove problematic for the headline CPI. Moreover, with the Shelter CPI hitting a new 2022 high, it’s another indicator of why the Fed’s war with inflation will be one of attrition.
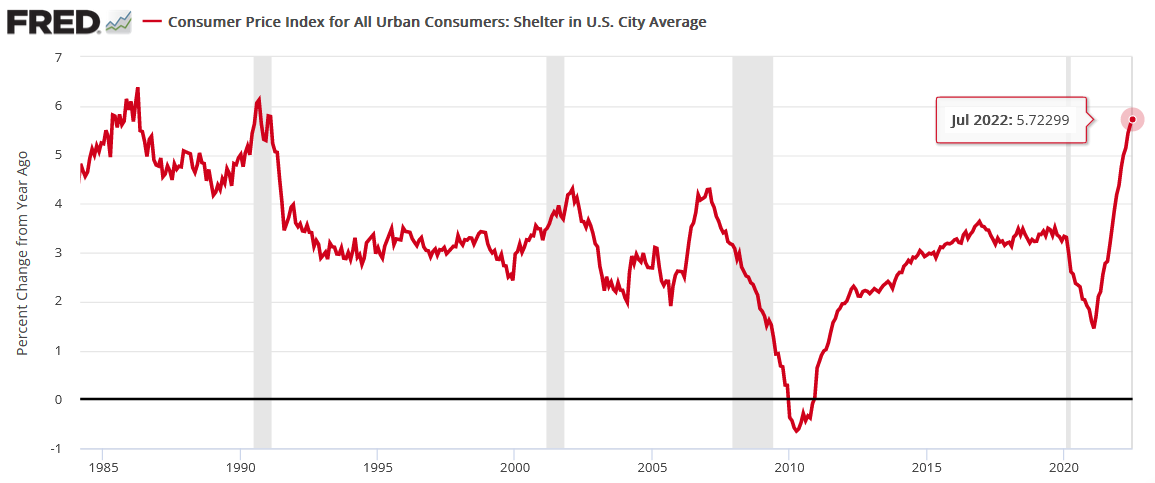
Consumer Price Index - For All Urban Consumers
Finally, while the inflation pause was met with applause, the headline CPI could repeat the feat for another eight months and still be 1.1% above the Fed’s 2% target in March 2023.
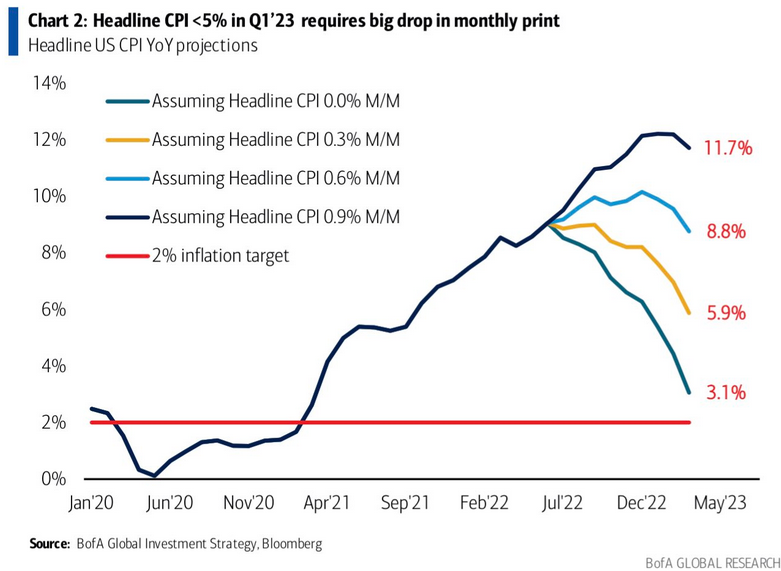
US Headline CPI
To explain, the various lines above track the trajectory of the YoY percentage change in the headline CPI, assuming different MoM scenarios. If you analyze the teal line, you can see that a flat headline CPI for the next eight months would put the headline CPI at 3.1% YoY in March 2023.
However, with the sticky inflation components still increasing, that forecast would require energy prices to decelerate MoM for the next eight months. Conversely, the light blue and gold lines are more reflective of fundamental reality. Under those scenarios, 0.3% to 0.6% MoM increases would put the headline CPI at 5.9% YoY and 8.8% YoY in March 2023.
Thus, those front-running a potential dovish pivot don’t realize that material deflation is needed to reach the Fed’s 2% target anytime soon; and with the Sticky CPI hitting a new 2022 high, does it seem like we’re near that point?
Fed Not Impressed
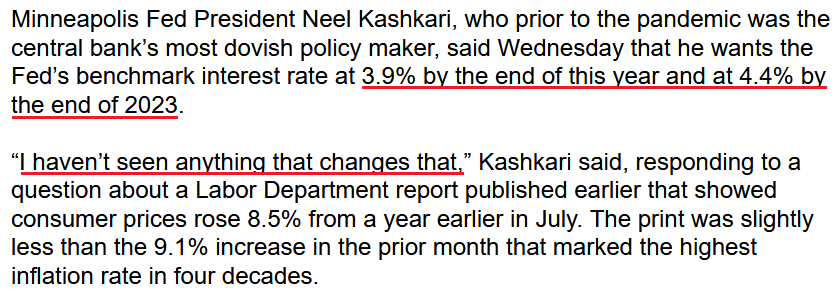
While investors clamor for the next round of QE, Fed officials poured cold water on that notion on Aug. 10. For example, Minneapolis Fed President Neel Kashkari (a reformed dove) said:
“I think a much more likely scenario is we will raise rates to some point and then we will sit there until we get convinced that inflation is well on its way back down to 2% before I would think about easing back on interest rates.”
As a result, the man “who prior to the pandemic was the central bank’s most dovish policymaker” sees the U.S. federal funds rate (FFR) moving materially higher in the months ahead.
Bloomberg Excerpt
Source: Bloomberg
Moreover, while Chicago Fed President Charles Evans welcomed the monthly pullback, he said on Aug. 10 that inflation remains “unacceptably high” and “that we will be increasing rates the rest of this year and into next year to make sure inflation gets back to our 2% objective.”
The Bottom Line
While the headline CPI retreated in July, the impact of lower oil and gas prices was far from unexpected. Moreover, while stock investors went all in, the PMs underperformed, and the GDXJ ETF gave up nearly all of its intraday gains. In addition, the relative weakness occurred alongside a decline in U.S. Treasury yields and a sharp drop in the US Dollar Index. As such, the PMs likely understand what the stock bulls will realize in the months ahead.
In conclusion, the PMs rallied on Aug. 10; but when considering the pullback in interest rates and the U.S. dollar, their performances were relatively poor. Therefore, the medium-term backdrop is much less optimistic than the S&P 500's price action suggests.
Read Full Story »»»
DiscoverGold
$GDX - Reminder: the typical duration of an uptrend is either 34 trading days or 54 trading days
By: CyclesFan | August 12, 2022
• $GDX - Reminder: the typical duration of an uptrend is either 34 trading days or 54 trading days. Therefore, it's going higher into September 12. The minimal target should be the May low at 29.66. If it manages to accelerate at some point maybe as high as the 200 day MA.

Read Full Story »»»
DiscoverGold
Gold will exist as a store of value before during and after crypto. Absolutely.
Gold will exist as money before during and after crypto. Absolutely.
Gold Is About Value; The Miners Are A Speculation Upon ‘Value
By: Gary Tanashian | August 11, 2022
Gold is…
A pretty rock that is dug out of the ground. This heavy rock has been assigned value by humans since time immemorial. That value has been its stability as an asset, a refuge from the excesses of rampant speculation, the likes of which often visit stocks (e.g. climaxes in 2000, 2007 and 2022) and sometimes commodities (e.g. 2008, 2011 and 2022). Gold is a good proxy for money, or what money should be. A stable entity retaining value through the up and down cycles over decades and centuries.
Gold is not…
A speculation. Ever. Hence, it is little surprise that gold so often fails to do what speculators seem to demand it do. Or at least it doesn’t do it when they are demanding it. That is because most speculators tend to lump gold with inflation and supply/demand driven commodities like copper, oil and soybeans. Why do they do this? Because they follow lazy analysis that views gold as primarily an instrument that is supposed to provide inflation protection as its #1 utility. It is not that. Not in its best suit.
Gold is for the long-term. A term so long that its history as an asset spans many centuries and is way beyond your or my ability to quantify it based on our own earthly experience. Humans just love to abbreviate their analysis into nice little easy to digest thought bubbles. Hence the herds that follow inflation touts into gold and then get burned when it fails to perform. Well sir, the failure is in your expectations, not in gold’s value.
Gold’s value…
It just sits there on its ample and heavy behind! That is all gold needs to do; be an anchor as asset speculations from stocks to commodities to crypto currencies orbit around it. In its relativity to cyclical and risk ‘on’ assets gold is a measure of other assets in motion. Little more.
When speculative asset markets are going up gold’s real price (as adjusted by those markets) tends to go down, regardless of what its nominal price is doing. That has value because it helps us gauge the ‘value’ levels that humans are assigning to it at any given time. That in turn helps us determine the confidence levels of the herds. Gold relatively weak = higher confidence in risk ‘on’ markets and the policymakers behind them. In short, gold’s ratios to other markets helps us determine the macro investment climate.
Why else is that of value? Because this same monetary anchor also works the same way in reverse, when asset bubbles are popping. The real price of gold rises when things fall apart in cyclical areas, regardless of whether or not its nominal price is rising.
Gold’s value, other than as a long-term ‘savings’ account, is as a barometer to the times. For example, the long correction from August 2020 through 2021 was reflective of the boom in inflated cyclical commodities and stocks. While we have accurately anticipated the summer 2022 relief rally in stocks the bigger picture – if the bear market maintains its grip as anticipated – is for the end of the latest bubble instigated by the Fed. Also reference these post-CPI thoughts on the matter.
How the miners leverage gold’s standing in the macro It’s as simple as operational efficiency and psychology.
Gold’s ‘real price’ rises during or into an economic bust. Look no further than 2000 and 2008 (vs. stocks) and 2008 and 2020 (vs. commodities). The lows in gold’s relative prices during those phases also saw important lows in gold mining stocks prior to bull markets and/or strong rallies.
Why did the miners perform so poorly from mid-2020 despite the booming inflation trades? Because the miners were leveraging gold’s standing within the macro. That standing was relatively weak and so the gold stock correction – to the bewilderment of a majority of inflation centric gold bugs – was completely normal and logical.
Why, for example, did gold stocks explode upward in late 2008? Because they had crashed immediately prior while their fundamentals (gold/stocks, gold/oil, gold/copper, gold/CRB among other signals) were exploding higher. Most people did not see it because gold was still correcting in nominal price terms but beneath the market’s surface its ‘real’ price was exploding upward. Here a hat tip is due to Bob Hoye, who is the analyst most focused on gold’s ‘real’ as opposed to market price.
I count Bob as one of my influences early on (spanning back 20 years). Among other things, I learned from him just how tragically wrong a majority of gold bugs are so much of the time and importantly, why. Analysis about gold’s ‘real’ price simply does not fit in the nice neat little box that many gold promoters want to present to their herds.
Back on message, as one example of gold mining operational efficiency benefiting from a rising ‘real’ price, if gold (product) is rising in relation to crude oil (important mining cost driver and cyclical commodity) the benefits to gold mining bottom lines are automatic.
As an example of psychological benefits, if gold is rising vs. stocks then it is only a matter of time before a critical mass of casino patrons, err, that is conventional stock market investors will take notice and position accordingly. Since we got an unwitting top call from none other than Warren Buffett and 3 luminaries of the gold cult community in mid-2020 the psychology has not been favorable. If as expected, gold reasserts its relative standing as the current broad market relief rally flames out in the coming weeks then the time will be right for the miners to leverage that situation.
There does remain an open question about the effect that a broad bear market resumption may have on the miners, but generally speaking a new phase would begin for the gold mining industry if we are correct about a resumed bear market in cyclical and risk ‘on’ stocks and commodities.
Regardless, we have projected a relief rally in the miners right along with Tech/Growth stocks and some commodity segments. This bounce will be subject to the same shorter-term trading rules as during a gold stock bear market when things get overdone emotionally and overbought technically. But in general it is time to anticipate the potential of a longer-term bull market if/as the Fed’s latest bubble du jour, panicked into existence in 2020, continues to deflate.
Read Full Story »»»
DiscoverGold
The Ord Oracle: GDX Update
By: Tim Ord | August 10, 2022
SPX Monitoring Purposes: Neutral.
Monitoring purposes GOLD: Long GDX on 10/9/20 at 40.78.
Long Term SPX Monitor Purposes: Neutral.

We have been looking at the bigger picture to see what lies ahead. The top window is the RSI for the Inflation/Deflation ratio. Intermediate-term lows have formed when the RSI for this ratio falls below 30, which is identified with blue vertical lines. This indicator is pretty good, but what catches our eye is that the pattern forming on the XAU appears to be a "Three Drives to a Bottom". This pattern predicts that, after the third low (which is forming now) is a minimum upside target to where the pattern began, which, in this case, is back to the 170 range. The 170 range is where the past three highs have formed. The more times a high is tested, the higher the probability that high will be exceeded. Our opinion will be that the 170 XAU on the next test will be exceeded. The two-year sideways trading range is due to end and an impulse wave is due to start.
Tim Ord,
Editor
Read Full Story »»»
DiscoverGold
Precious Metals Stocks -- A Bottom Finally Forms
By: Rambus | August 8, 2022
By Plunger
In this report I will advance the case that a bottom has finally formed in the precious metals market after a grueling two year bear market. First, I would like to review how the market got to where it is now. Then show the indicators in my gold bottoming system which support the case that a bottom has formed and then finally lay out a strategy going forward.
Genesis of the Bull Market- How we got to where we are
The precious metal stocks (PM) are in a multi cyclical bull market (secular) which started in January 2016. There have been 2 legs up and 2 legs down so far. The third leg up, which will likely be a powerful one, most likely began the third week of July 2022. I would expect it to last between 2-4 years.

Above we see the secular bull market so far. It began with a 7 month cyclical up leg followed by a 25 month consolidation. The next leg up lasted 23 months followed by what appears now as a 2 year cyclical bear market. I began classifying this most recent decline leg as a bear market in Feb 2021 when it was 6 months into the decline because it became evident that the moves down were NOT corrective but in fact distributive. Bear markets distribute positions from the informed to the misinformed (suckers). Until recently, most investors clung to the concept that it was “just” a correction. I think the 90 day brutal decline begun this past April, ends this argument. Clearly, it was distributive in nature, not just a correction.
The three series of indicators on the chart above show that this recent decline, in aggregate, was the most extreme pressure packed decline of this entire secular bull market since 2016. The rate of change (ROC) even exceeded the covid crash. The 3 indicators in sum exceeded all other declines. Market sentiment, Stochastic and ROC led to a full-on capitulation… more on that later.
Prior to this secular bull market the sector underwent a 5 year 85% bear market from 2011 to 2016. This cleared the decks of all the dead wood which is why the market was able to vertical launch in the first half of 2016. But this first leg was destined to disappoint, as it ultimately did, because it didn’t unfold like a “real organic” leg should. You know, majors first, mid tier second and finally juniors and green field exploration. No, everything blasted up together, so the market needed a prolonged shake-out to sort through the real stories vs the trash. It took two years to do this. Take a look how FNV did during this period vs NGD and you will see what I am talking about. The market was just doing its job.
Next was the bull leg from Sept 2018 to Aug 2020 where the GDX more than doubled. Covid slapped it down for only a month and then in its last 2 months from mid June to early August it got over heated. I exited most of my positions in early August 2020, however my biggest error was in thinking it just needed time to consolidate before resuming the upside. The red flag waving was the fact that silver accelerated in a vertical blow off. This always happens at the end of a bull market and this bull was now 2 years old. This all should have been obvious to a schooled observer of markets. I recall twitter posts made by silver bugs right after the top in August bragging about buying the first dip and listing the silver stocks they bought. Recall that when one is buying right it never feels good and bragging is usually the last thing one wants to do because he is scared. Knowing the signs were all there, the proper course of action would have been to completely fold ones tent and go on sabbatical. The weekly RSI of the silver/gold ratio peaked at 78 on 3 Aug 2020, which was a clear signal a top was imminent. When this high of an RSI reading is combined with the end game acceleration of the silver price the bull market is ending…it’s time to go fishing.
Recall the month of July 2020, it seemed surreal as silver just wouldn’t stop. Each day it powered higher. ridiculously higher. Here is a chart of Silver From Jun-Aug that summer, it was like bull markets are supposed to be, it was actually fun to be in a bull market. Silver essentially doubled in 2 months- crazy.

But keep in mind the old Warren Buffet quote that “A bull market is like sex, it feels best just before it ends”. That’s the voice that should have been in your head that summer.
Aug 2020-July 2022 The long torturous PM bear market
If you ever wish to study bear markets this has been a classic text book model. Investors refused to believe they were in a bear market until it was 80%-90% over. Bob Thompson has mentioned this phenomenon and we saw it play out. There were 3 to 4 BMR’s with each one getting progressively bigger. Gold bugs bought all the way down and got caught in all the post BMR sell offs. Finally, the last BMR (Apr 2022) sucked in enough investors to provide the fuel for a full-on, full-scale downside collapse which ended in complete capitulation after a 90 day, 50% decline. A classic ending bear market annihilation drive. It ended up being an honest to god full blown cyclical bear market. No, it was not a correction.
Let’s build the case the next bull market has now started
First off, if you are not familiar with Bob Thompson’s mining clock I highly recommend watching this video and signing up for his free clock updates. His comments on the mining clock start at the 40 min mark. Once one understands the concept and sees the timetable you should be able to see why we were not headed for a 2013 like gold crash. Simply stated that’s not where the market is in the clock cycle and the charts depict this.
The Capitulation
I have gone back and looked at all the cyclical PM stock bear markets since the late 1800’s. I have sliced and diced them and you know how long the average bear market was in the gold stocks? 24 months! That’s right, just where the market is right now. So this bear is ending on schedule. So think about what we have witnessed in the past 7 months and particularly 90 days. By mid December last year the juniors had been thoroughly trashed by tax loss selling. It was a particularly brutal catharsis because many investors had big gains in big tech and really needed to offset those gains with something. PM junior portfolios served as an offset to those tech profits and they got pummeled, beaten with a stick. And here is the thing, they never really bounced back in the new year. Once the March BMR peaked in April the market began its annihilation drive, taking stocks down 50% in 3 months. By June another unthinkable wave of selling hit the juniors to the point of total destruction. This was full blown capitulation in the junior sector, there was no longer any doubting if capitulation was here. Then mercilessly the bear went after the only thing left, royalties & majors, It didn’t matter if it was quality or not…. AEM, FNV…offered no quarter. As if the bear wanted to make a final statement or put a cherry on top of his accomplishments, then came July 25th, NEM earnings day. A total wipeout of the largest, most respected miner in the world, down 13% on the day after already losing 41% over the past 90 days. This was full capitulation of the highest order among the big caps, massive volume with an institutional exit of the sector. Full spectrum sequential capitulation in both sentiment and price action.
Think about all of this for a while then ask yourself what more do you want to see? Sure we see inverted H&S objectives for GDX as low as 12, but there is a H&S pattern behind every tree. Do you really think every last bearish objective will be achieved…. seriously?
As Rick Rule said to me recently after I had asked if one of my favorite stocks had bottomed he said “I don’t know, but sometimes it’s just cheap enough”.
Plunger’s Gold Bottoming System Charts

Above we see the gold miner sentiment indicator with the GDX overlayed and the weekly stochastic below. The vertical dashed blue line is drawn when fast stoch crosses slow to the upside. Simple chart and easy to see this is a buy point, but often overlooked. Look how stretched to the downside sentiment was and how long stochastic was flatlined. Also RSI reached the full extension of 29 which is really oversold for a weekly in a secular bull market. It was past due to turn up and it did. A buy point.
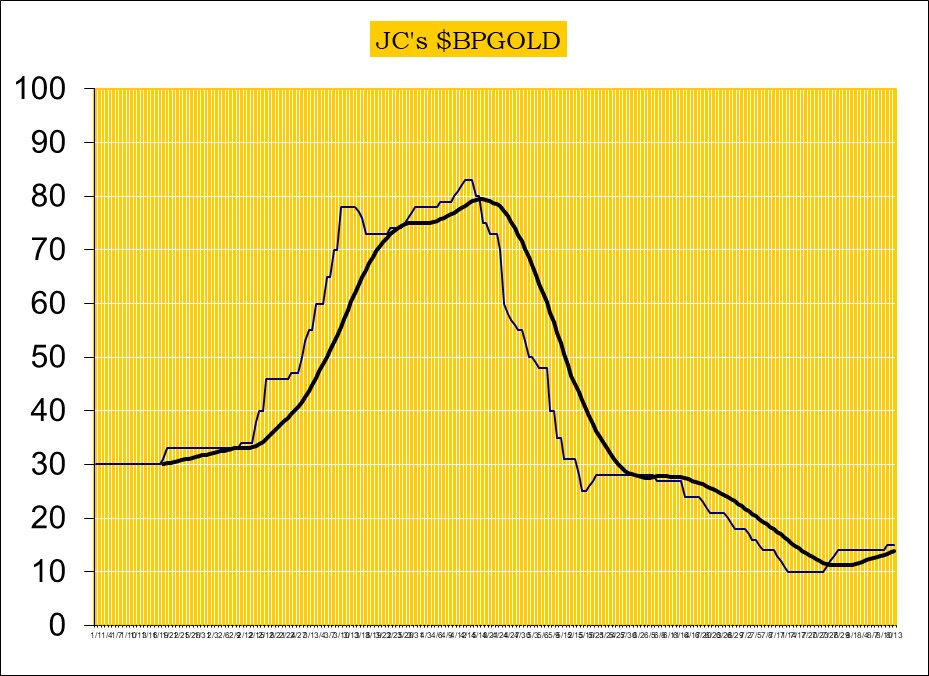
BPGDM- Daily Version
Here is a zoom in on the daily version. Here is the bottom buying criteria: when the BPGDM breaks up through the moving averages and the 5 day crosses above the 8 day it triggers a buy. This occurred on 27 July.

Gold Miners Above The 200 EMA
This was a very useful chart in the bottoming process. You can see how stocks above the 200 EMA were zero for the longest time. This showed just how extreme this downside move was. Mathematically, it can’t stay down there forever as moving averages begin declining so I drew the vertical line when stocks first hit 0% above 200 EMA. You can see the current sequence was the longest. Note that it took 6 weeks after stocks hit 0% before the GDX began to rise. In the previous 3 sequences the longest was 2 weeks. Another measure of extreme downside compression.

New High/Low Percentage
Next let’s turn to both the weekly and daily new high/low percentage. Truly extraordinary, as both exceeded the extremes of the covid crash. On the weekly, up to 50% of stocks hit new lows in the worse week of 27 June. The daily shows 65% of stocks hit new lows on the worse day of 14 July. That’s more than the worse day of the covid crash. Extraordinary high compression lows. This gives spring-back power once the next bounce breaks out.
Weekly

Above: note weekly stochastic curling up now. Expect price acceleration once the 20 level is reached.
Daily

Above: A massive 2-month cluster of new lows reaching 65% in a single day, setting up a compressed spring.
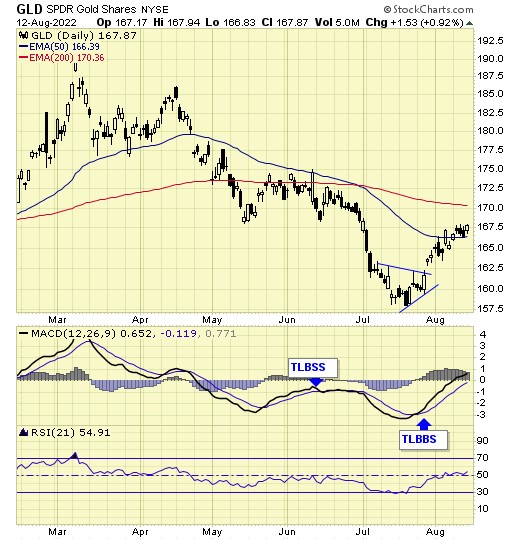
Bollinger Bands-Gold
Weekly:
You can see that gold had a 3 week excursion outside its lower Bollinger Band. That is fairly extreme in the context of a secular bull market and indicative of a near term upside reversal. The bands are now widened out from the big downside move. This is another measurement of downside compression likely leading towards a strong reversal.

Monthly BB:
The monthly confirms the concept that this is not 2013 all over again. Note how in 2013 gold ripped down through a declining BB and stayed outside for 4 horrendous months. That’s bear market action indeed. Contrast that with the recent poke below a flat BB. It was like a beachball underwater, it couldn’t stay there and popped right back up. that’s encouraging, however the indicators below make it clear that any bottoming action is going to take a lot of time before a sustained bull market move.
Stochastic and MACD are still in downward configurations so it’s going to take time to reverse this still existing downside momentum. It means there is still an undertow to the market and backing and filling will be the result of it. Don’t expect a steady upside path.
Note however, the BB width indicator. This shows the BB have narrowed to a minimum width indicating a significant move in price is fairly imminent on a monthly basis. If the move is to the upside it would result in the Stochastic and MACD making the turn and support an eventual prolonged move up.

GDX volume and extreme downside compression
This chart below shows in no uncertain terms how compressed GDX had become. First off 10 week average volume is shown by the thin red line overlaid onto price. It is a magnified and shortened scale of the thin blue line over the volume bars. This shows how volume has dried up over the past 2 bear market years. This is what we expect to see in a bear market. The recent up-curl could be the end of this trend.
RSI: I drew vertical lines through the low points in RSI showing where they intersect price at those lows. The recent low of 29.72 is very oversold on a weekly basis.
MACD Histograms: The most extended to the downside of any time in this 7 year secular bull market. More compressing of the spring.
Stochastic: Not a spike low but of longer bottoming duration and now turning up. Breaking through 20 provides confirmation.
ROC: Even exceeded the rapid covid crash

Again, this is all a picture of extreme downside compression of the GDX for a considerable length of time. It is why I expect more upside follow through in the near term. Compressed energy is now being released.
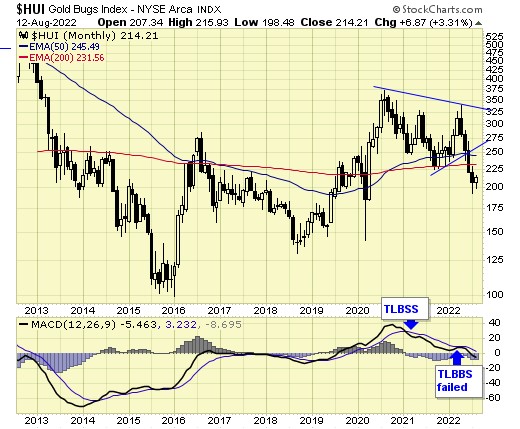
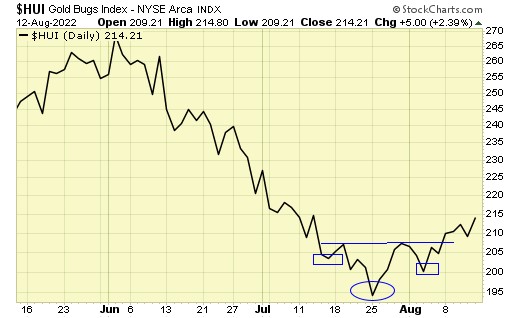
HUI/Gold Ratio
The HUI/Gold ratio is a validation of sorts of an actual bull or bear market in the gold sector. During prolonged uptrends in a bull market gold stocks will outperform gold. It does tend to lag a bit so this chart is telling us we are almost there since the indicators are now reversing. Again we see a picture of extreme extension of the indicators.

The below chart shows this same dynamic with gold and GDX plotted together. You can see the metal is still leading the stocks. This should eventually change.

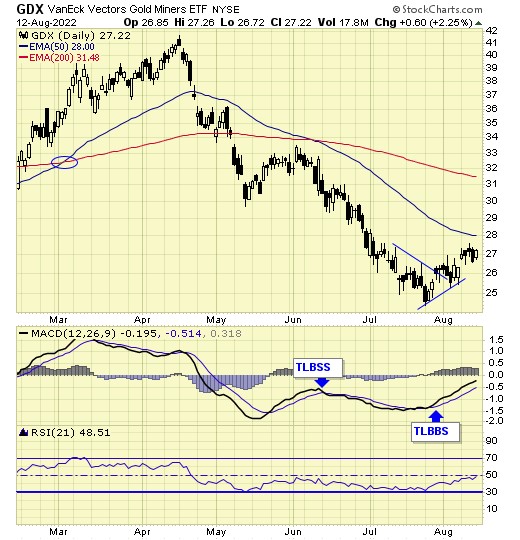
Gold Miners Adv/Decline Volume
Adv/Decline lines typically lead stock prices, however in the gold sector it doesn’t have this history. It actually tends to lag the GDX and you can see it doing so here. But it is showing signs of a bottom in the Stochastic and PPO indicators, as well as the Adv/Decline line itself.
The 21 posted on the chart is the H&S price objective of the GDX. It may or may not ever achieve it, however the NL shown may be a magnet for a GDX back test which comes in just over 29 where another measured move method is projected for this current rally.
Overall despite being a lagging indicator in GDX the Adv/Decline Volume is a slight positive now with indicators turning upward.

SIL/GDX- Silver stock to gold stock ratio
This is a significant meaningful indicator because it only makes major swings and shows when an upside bull market gets in gear. This is because silver stocks outperform gold stocks once the uptrend is well underway. It has already turned upward after a positive confirmation double bottom. The early turn upwards, I believe, is telegraphing that silver stocks are going to far out run gold stocks in this upcoming bull market. It’s my opinion that this will be due to the Comex silver suppression scheme coming unraveled...

* * *
Read Full Story »»»
DiscoverGold
Gold & Silver Stocks: Key Tactics Now
By: Morris Hubbartt | August 8, 2022


SG60 Key Charts, Signals, & Video Analysis


My SG60 service is ideal for investors who like some short-term action and core positions for intermediate gold/silver miners, growth stocks, oil stocks, regional banks, big-name cryptos, and commodity stocks. The Friday jobs report could bring a pause in the current rallies but then I think we rally right into September!
SGT Key Charts, Signals, & Video Analysis


SGJ Key Charts, Signals, & Video Analysis


Read Full Story »»»
DiscoverGold
Gold miners are almost paying more dividends than utility stocks for the first time in the history of the data
By: Otavio (Tavi) Costa | August 6, 2022
• Gold miners are almost paying more dividends than utility stocks for the first time in the history of the data.

Read Full Story »»»
DiscoverGold
Barrick Gold quarterly profit beats expectations after copper boost
By: Reuters | August 8, 2022
Barrick Gold (NYSE:GOLD) Corp reported a nearly 19% rise in second-quarter profit on Monday, beating analysts' expectations thanks to higher copper output, even as inflation drove the miner's cost of production up.
The world's second-biggest gold miner stuck to its cost forecast for the year and said it was on track to meet copper and gold production guidance.
Barrick produced 120 million pounds of copper in the second quarter, up 25% from the same period last year, while gold output rose marginally to 1.043 million ounces from 1.041 million ounces. Copper and gold are often found in the same ore, making copper a common byproduct of gold mines.
Net earnings stood at $488 million, or 27 cents per share, for the quarter ended June 30, compared with $411 million, or 23 cents per share, a year earlier. Earnings and revenue for the quarter beat analysts' estimates, according to Refinitiv data.
Barrick maintained its quarterly dividend of $0.20 per share. "On an annualized basis, this implies a ~5.1% yield, currently the highest in our coverage universe," Credit Suisse analysts said.
However, in a sign of the impact surging inflation is having on Barrick, all-in sustaining costs per ounce of gold - a measure of the cost of production - for the first half increased 13% from the same period last year, while all-in sustaining costs per pound of copper jumped 15%.
The world's biggest gold miner, Newmont Corp, raised its annual cost guidance recently as it warned inflationary pressure would persist next year.
Barrick's adjusted earnings before interest, tax, depreciation and amortisation (EBITDA) was down 10% from the same period a year ago, due in part to a 5% fall in gold production.
Project capital expenditure also jumped by 23% in the first half of this year as Barrick pushed ahead with expanding its Pueblo Viejo mine in Dominican Republic, while free cash flow fell by 24%.
(This story corrects attribution of quote in para 5 to Credit Suisse analysts, not RBC analysts)
Read Full Story »»»
DiscoverGold
Barrick $GOLD reports earnings tomorrow before the markets open
By: Stock Market News | August 7, 2022
• Barrick $GOLD reports earnings tomorrow before the markets open, Wall ST is expecting numbers of
EPS of $0.22 down 24.1% YoY
Rev of $2.85B down 1.4% YoY
Read Full Story »»»
DiscoverGold
Will The True Metals Bulls Step Forward?
By: Avi Gilburt | August 4, 2022
• Following the Elliott Wave analysis:
In my weekend analysis, I tried to convey a sense of risk. In fact, that sense of risk I was trying to convey was one of which you did not have to take just yet.
And, now the both silver and gold have pulled back to their respective supports. And, I cannot say that the micro moves off those supports are standard 5-wave structures. But, as long as these supports hold, I can still reasonably “look” higher, but it does not necessarily mean I would trade it to the long-side aggressively just yet. The market must prove a trend change with a completed 5-waves up for me to move towards the aggressive long-side.
Now, moving over to GDX, we have a very interesting posture the market has taken. As I have said before, I still have no indication that the bottom has indeed been struck. But, I am keeping an open mind as to the potential. And, I have outlined that potential on the attached 8-minute GDX chart.
As you can see, I have a very uncertain wave i high, especially since that rally does not count clearly as a 5-wave structure. But, there is potential for this decline today to count as a 3-wave structure, so I have to at least be open to a possible i-ii structure.
So, let me take a moment and explain how I use Fib Pinball to distinguish between structures. First, there is potential that the decline off yesterday’s high can count as 5-waves down. Normally, the 5th wave within a 5-wave structure does not exceed .618 the size of waves 1-3, sometimes we do see a very extended 5th wave that can reach the .764 ratio. And, that is what we may be seeing in GDX right now. So, if we hold the low struck today, and see a corrective rally in the coming day or two, then I would have to side with this being a 1-2 downside structure in the final 5th wave of the decline in the GDX, which would complete this larger degree c-wave of the (b) wave on the daily chart. And, such a decline would likely target the 23 region.
However, if we see a bit more of a drop tomorrow into the 25 region, then we have exceed the .764 extension and the market more likely is tracking as an a-b-c corrective pullback, wherein the a=c in that pullback. That would give a bit more credence to the i-ii bullish structure, and would clearly confirm on the break out over the high of wave i.
Now, clearly the yellow count must remain below yesterday’s high, even though the market only dropped to the .764 extension. In a minority of times, an a-b-c structure can have a c-wave at the .764 extension of the a-b structure. So, we need to see a corrective rally tomorrow which remains below the high struck this week to maintain the downside potential in the yellow count.
In either case, holding over 25 and breaking back over the high struck this week would point us to the 30-31 region to complete wave 1 off the lows. And, it would likely mean that the GDX is moving into a “catch-up” mode to silver and gold, and would likely outperform on the break out over this week’s high.
So, overall, the market has still not proven that a final low has been struck in any of the charts we track. If it chooses to do so, it will likely provide us with a strong rally in the coming days, most specifically in the GDX, as that has been the lagging chart thus far. And, until we are able to take out the high struck this week in the GDX, I am still view the potential for a lower low as a higher probability than I would prefer at this point in time. And, should we break out over this week’s high, then we should be off to the races, and starting a major bull run that should last well into 2023.
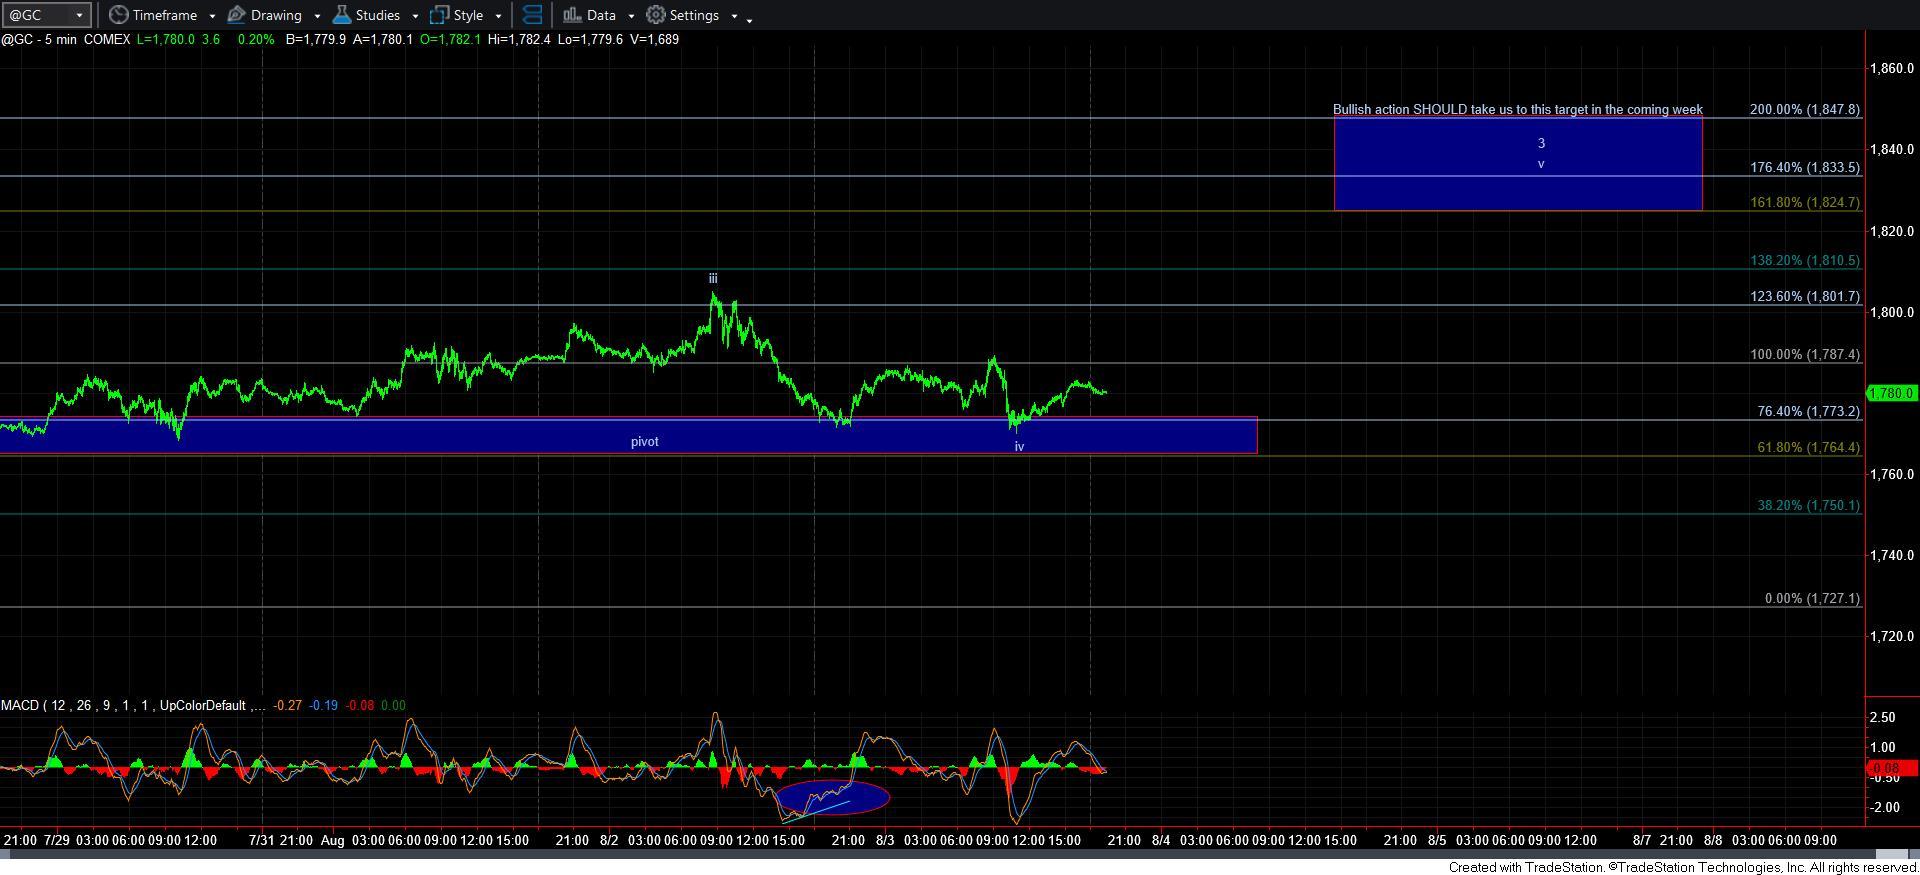
GC5min
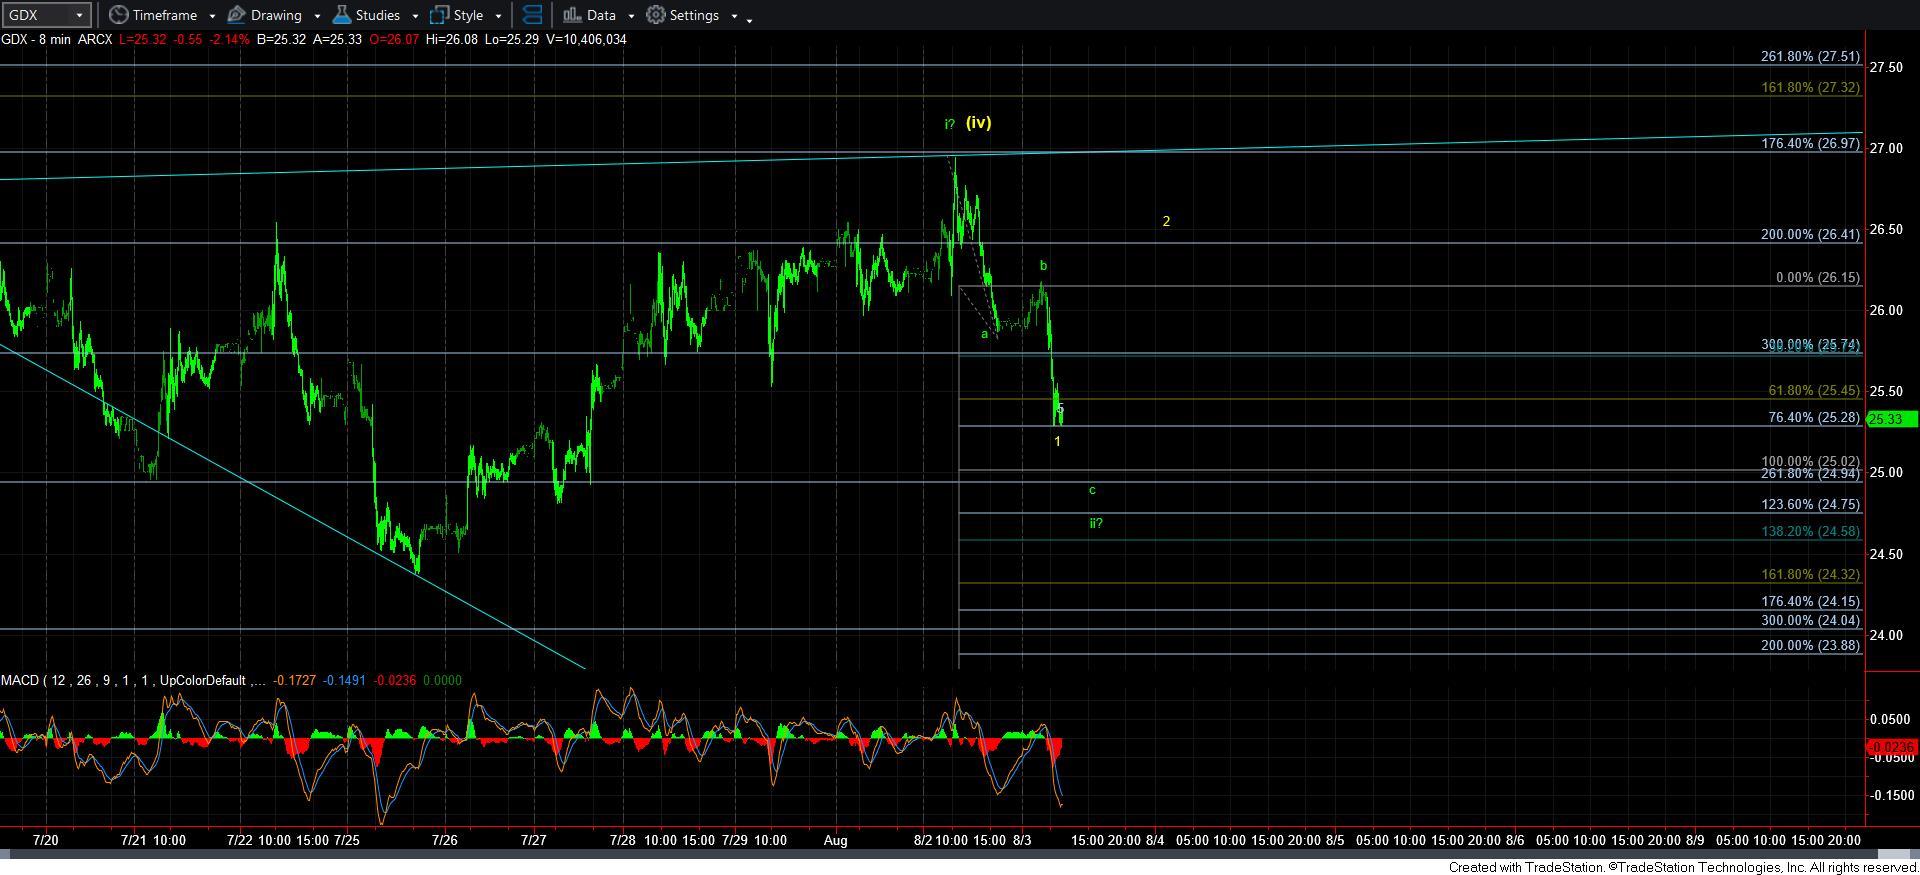
GDX8min
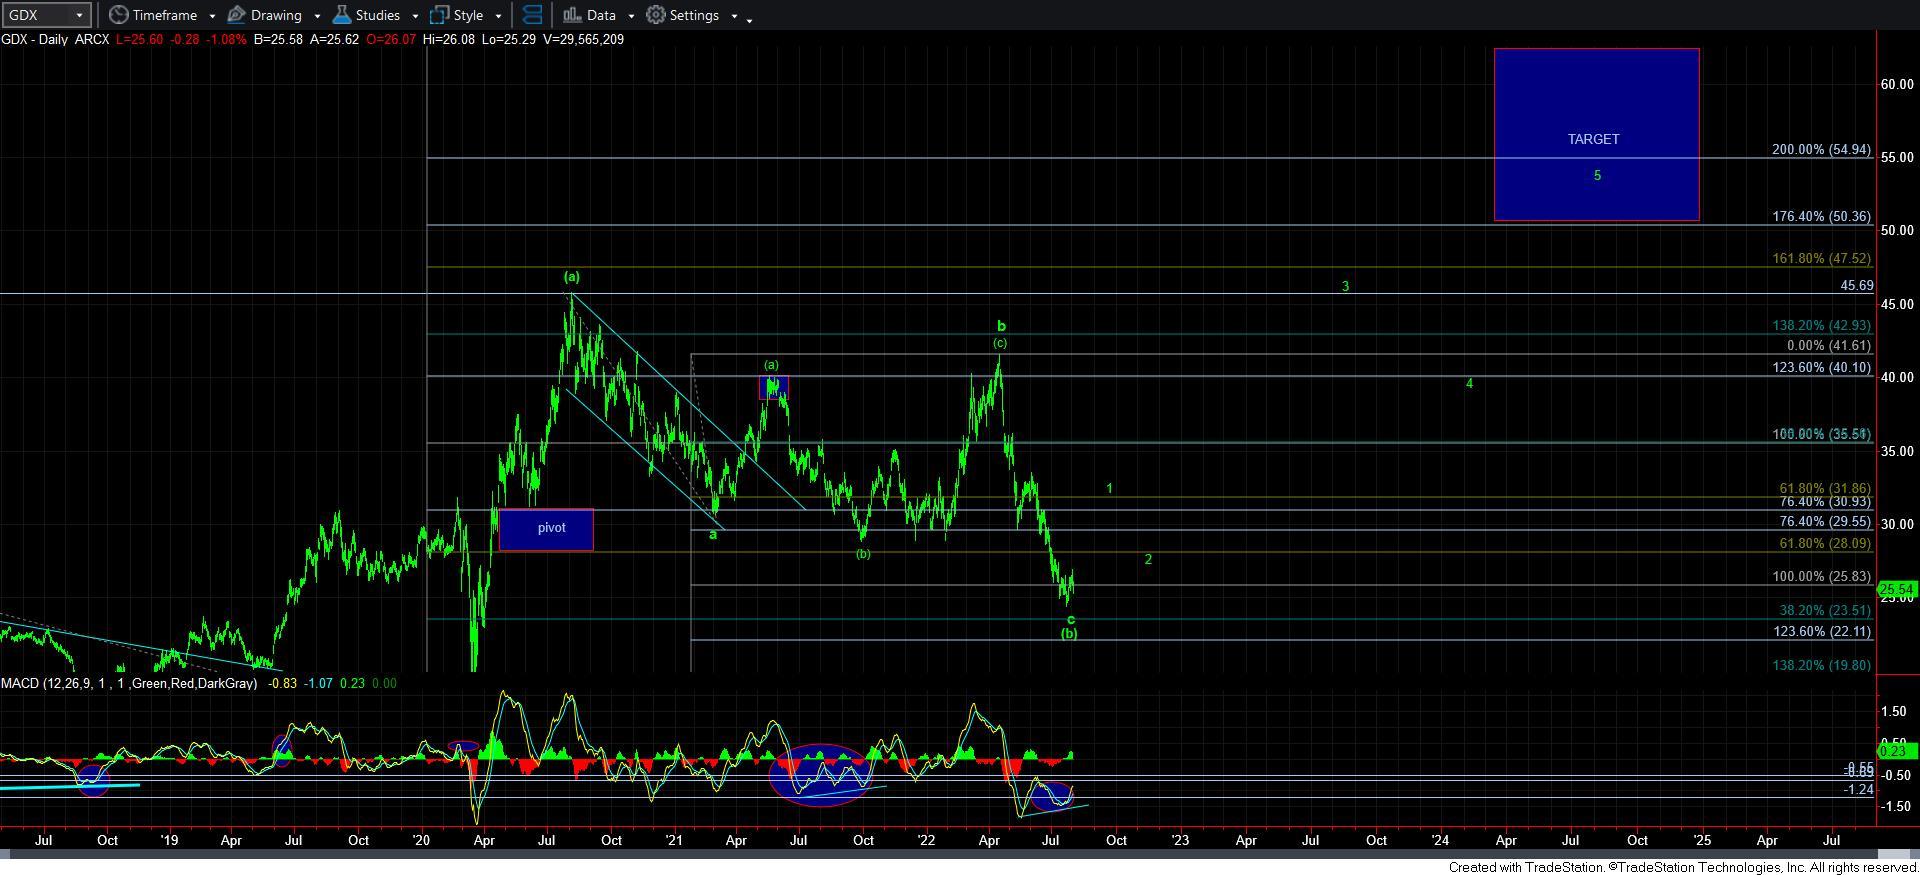
GDXdaily
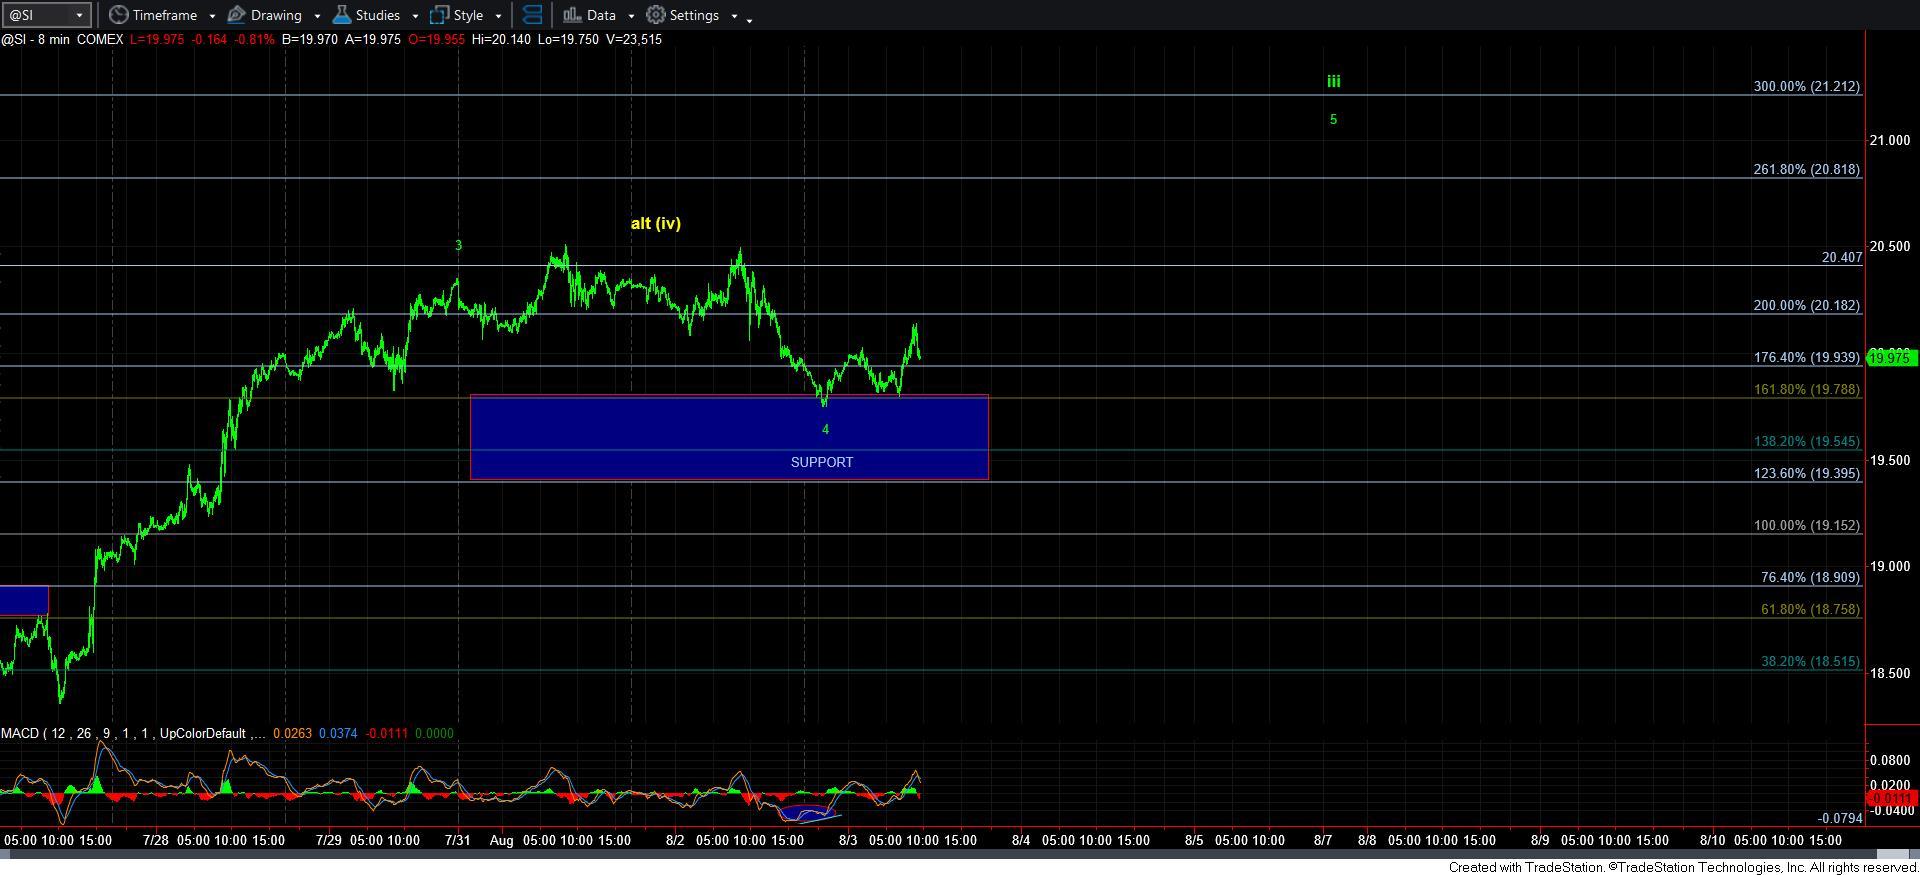
silver-8min
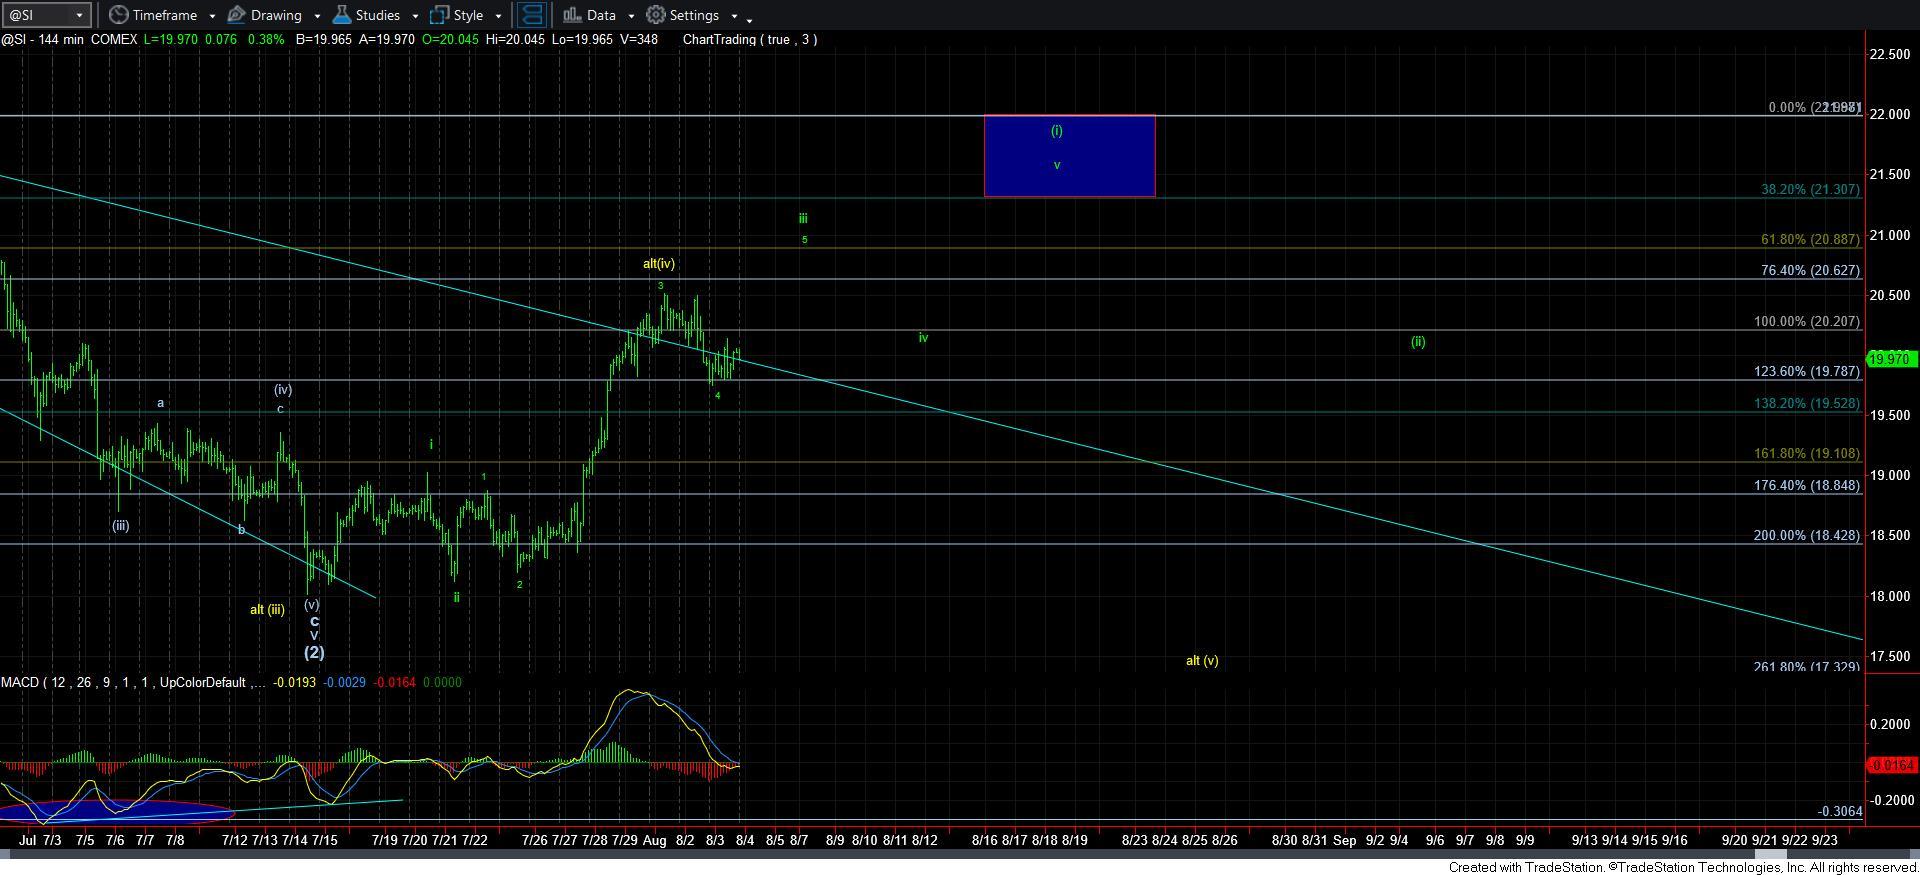
Silver-144min
Read Full Story »»»
DiscoverGold
Forecast: Key Gold Inflection Point Coming Due
By: Jim Curry | August 7, 2022
Recapping Last week
Following early-week strength, Gold formed its low for last week in Wednesday's session, here doing so with the spike down to the 1770.00 figure. From there, a firm push higher was seen into Thursday, with the metal running up to a peak of 1812.00 - before backing off the same to end the week.
Gold Market, Short-Term
From the comments made in past articles, Gold was seen as forming a key price low - which came from the combination of 10, 20 and 34-day cycles. That low was later confirmed to be set in place in our Gold Wave Trader report, and with that called for a significant short-term rally. Shown below again is our 34-day cycle component:
From my 7/10/22 article: "Once the next 10, 20 and 34-day combination low is in place, then the probabilities should favor a very nice rally in the days/weeks to follow. In terms of price, Gold has a very strong tendency (i.e., 85% odds) to revert back to a moving averages which is in line with the cycle length(s). With that, the upside potential for the next rally is back to the 20 and 34-day moving averages - with highest (34-day) average nearly 85-90 points above current price levels."
As mentioned in prior articles, with a cycle having the strong tendency to revert back to a moving average of the same length, the upside potential for Gold was back to the 34-day moving average - which has now been met with the action into last week. In terms of price, Gold has rallied some 116 points from the July low (1696) to last week's high of 1812.00 - which is right in line with the noted potential upside.
I mentioned that - if the move higher were going to end up as an immediate failure - then it would likely do so at or near the same 34-day moving average. Having said that, I also pointed out the alternate path - which was later moved to the preferred scenario - which had the July low also ending up as a contracted trough for our larger 72-day cycle, which is shown on our next chart:
In terms of price with the above, the 72-day moving average was mentioned as the ideal upside magnet - which is around 36 points above current price levels. With that, the overall assumption is that Friday's pullback will end up as countertrend, giving way to strength again - and higher highs for the move - on the next minor swing up, ideally lasting into mid-month or later.
Gold's Stepped-Back View
Stepping back slightly, higher highs for the swing should peak, at minimum, the aforementioned 34-day cycle. However, there is the potential the move could also top the larger 72-day wave, since we expect a left-translated 72-day cycle upward phase - due to the position of the larger 310-day component, shown below:
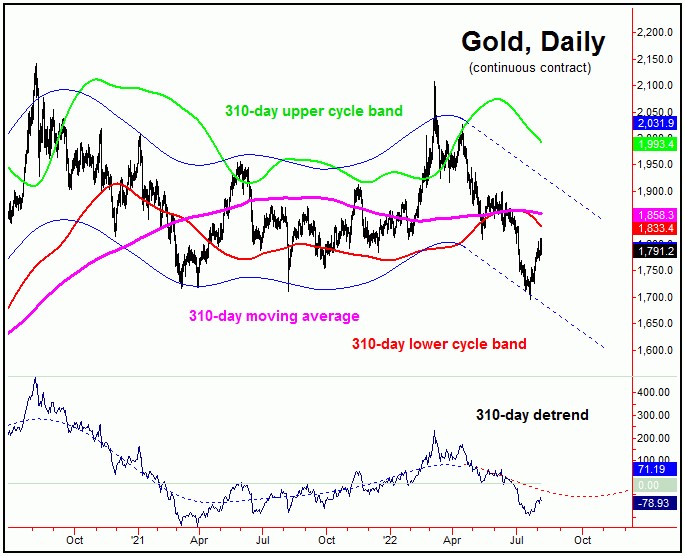
Stepping back further, the next trough for the 72-day cycle should be primed to bottom the larger 310-day component, which is seen as pointing lower into October - against the upward phasing of the smaller-degree waves.
With that, the assumption is that the current upward phase of the 72-day cycle will end up as countertrend, giving way to a drop back lower lows for the larger swing into October. The next trough for this 72-day cycle - if made on schedule - is also due to form around mid-October of this year.
For the bigger picture then, the next major low is expected to come from the 72 and 310-day cycles (as well as an in-between 154-day wave), and is due around October of this year, plus or minus. Once this bottom does form, what follows is expected to be a rally of some 20-25% or more, lasting into well into what looks to be late-Spring of next year. The overall lack of interest from Gold traders tends to add weight to the idea of a major rally coming, once the next mid-term upward phase does assume control. More on all as we continue to move forward.
Read Full Story »»»
DiscoverGold
NY Gold Futures »» Weekly Summary Analysis
By: Marty Armstrong | August 6, 2022
The NY Gold Futures closing today at 179120 is immediately trading down about 2.04% for the year from last year's settlement of 182860. This price action here in August is suggesting that this has been a bear market trend on the monthly level.
ECONOMIC CONFIDENCE MODEL CORRELATION
Here in NY Gold Futures, we do find that this particular market has correlated with our Economic Confidence Model in the past. The Last turning point on the ECM cycle low to line up with this market was 2015. The Last turning point on the ECM cycle high to line up with this market was 2020 and 2011 and 1996.
MARKET OVERVIEW
NEAR-TERM OUTLOOK
The historical perspective in the NY Gold Futures included a rally from 2015 moving into a major high for 2020, the market has been consolidating since the major high with the last significant reaction low established back in 2015. The market is still holding above last year's low but is trading rather weak at this moment. The last Yearly Reversal to be elected was a Bullish at the close of 2020.
This market remains in a positive position on the weekly to yearly levels of our indicating models.
Looking at the indicating ranges on the Daily level in the NY Gold Futures, this market remains moderately bullish currently with underlying support beginning at 178460 and overhead resistance forming above at 180250. The market is trading closer to the support level at this time.
On the weekly level, the last important low was established the week of July 18th at 167840, which was down 5 weeks from the high made back during the week of June 13th. We have been generally trading up for the past 2 weeks from the low of the week of July 18th, which has been a move of .0768%.
INTERMEDIATE-TERM OUTLOOK
YEARLY MOMENTUM MODEL INDICATOR
Our Momentum Models are declining at this time with the previous high made 2020 while the last low formed on 2021. However, this market has rallied in price with the last cyclical high formed on 2020 and thus we have a divergence warning that this market is starting to run out of strength on the upside.
Critical support still underlies this market at 175200 and a break of that level on a monthly closing basis would warn that a sustainable decline ahead becomes possible. Immediately, the market is trading within last month's trading range in a neutral position.
DiscoverGold Jack Chan: Gold Price Exclusive Update
By: Jack Chan | August 6, 2022
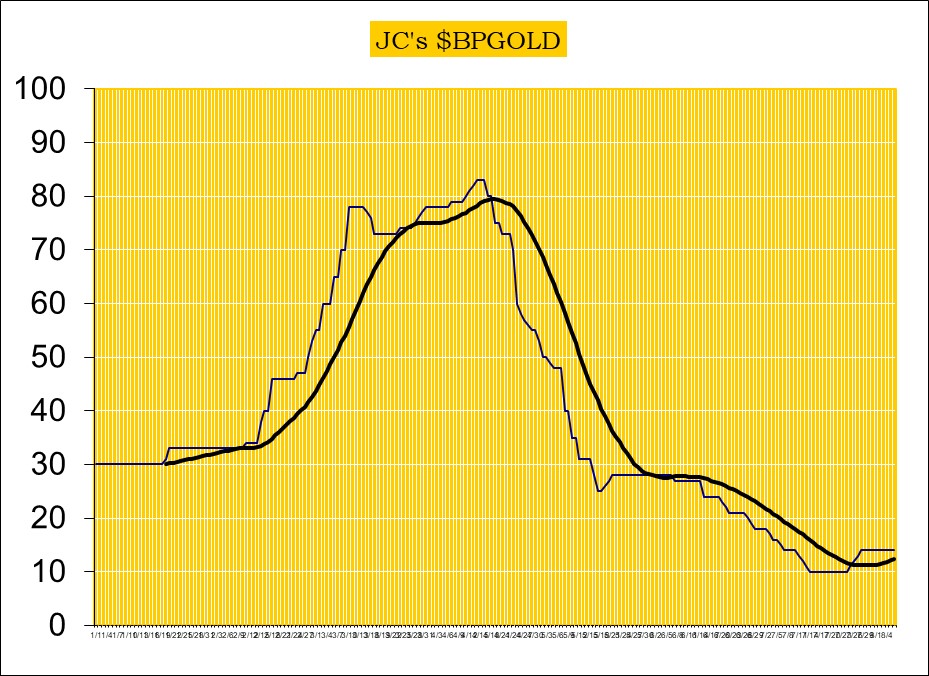
Our proprietary cycle indicator is UP.
To public readers of our updates, our cycle indicator is one of the most effective timing tool for traders and investors. It is not perfect, because periodically the market can be more volatile and can result in short term whipsaws. But overall, the cycle indicator provides us with a clear direction how we should be speculating.
Investors
During a major buy signal, investors can accumulate positions by cost averaging at cycle bottoms, ideally when prices are at or near the daily 200ema.
During a major sell signal, investors should be hedged or in cash.
Traders
Simply cost average in at cycle bottoms when prices are at or near the daily 200ema; and cost average out at cycle tops when prices are above the daily 50ema.
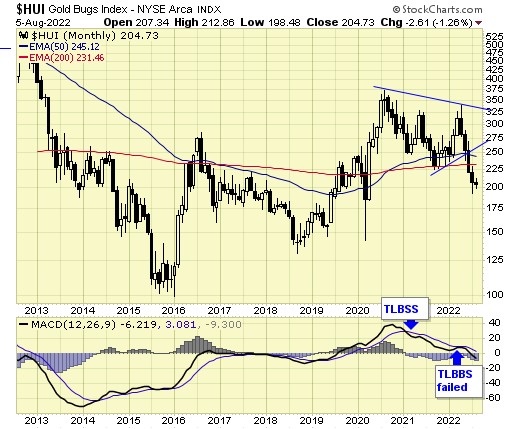
Gold sector is on long term SELL signal as the recent buy signal has failed.
The correction since 2020 drags on.
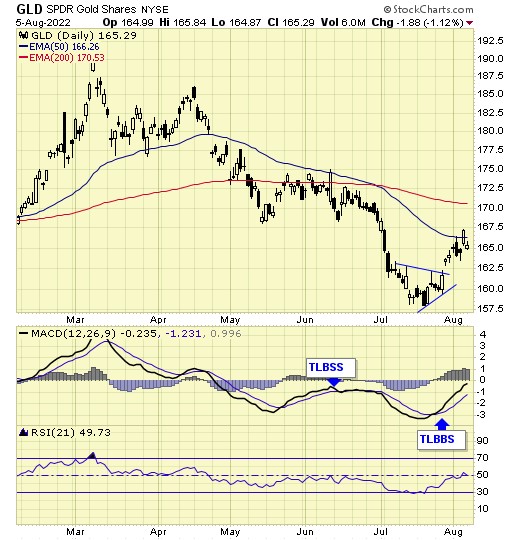
GLD is on short term buy signal.
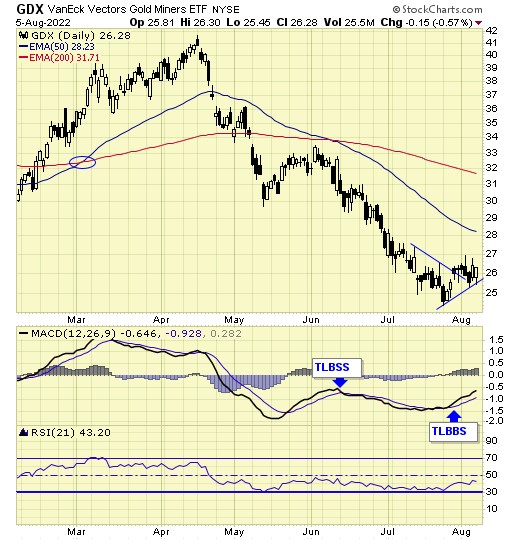
GDX is on short term buy signal.
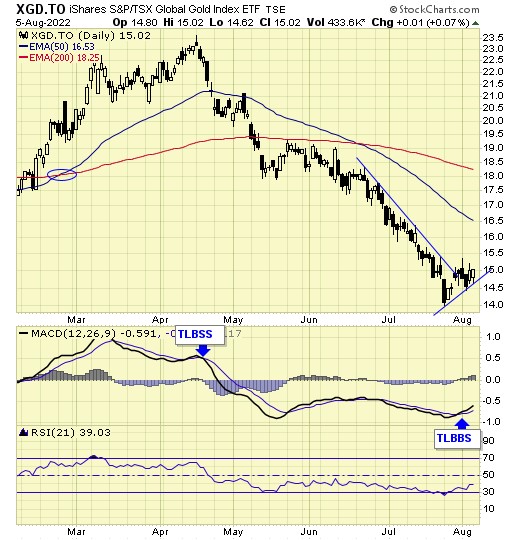
XGD.to is on short term buy signal.
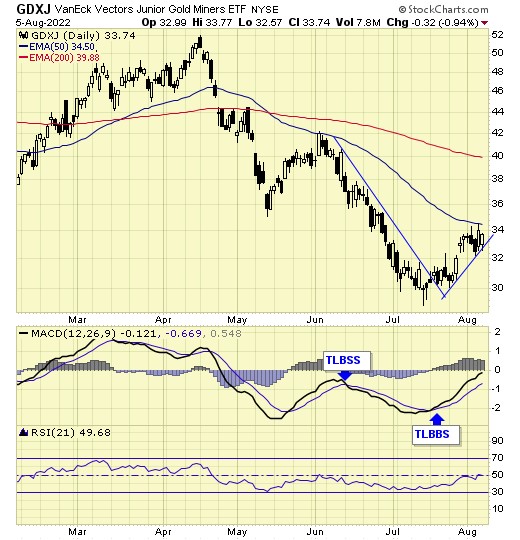
GDXJ is on short term buy signal.
Analysis
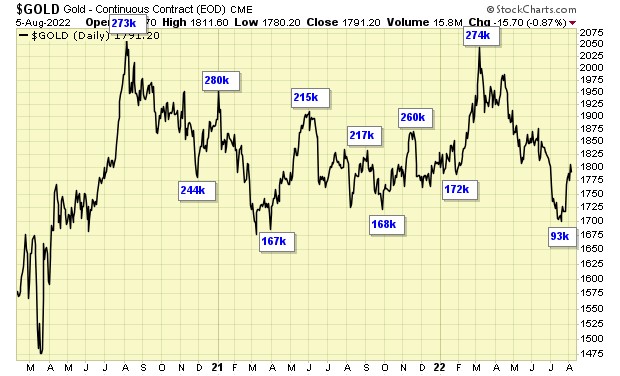
Current data supports overall higher gold prices.
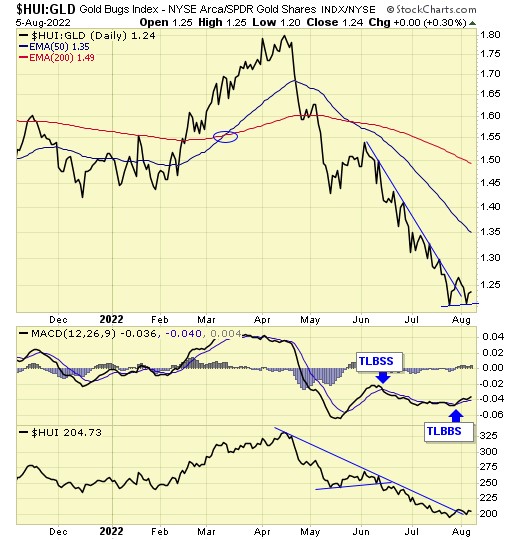
Our ratio is on a new BUY signal.
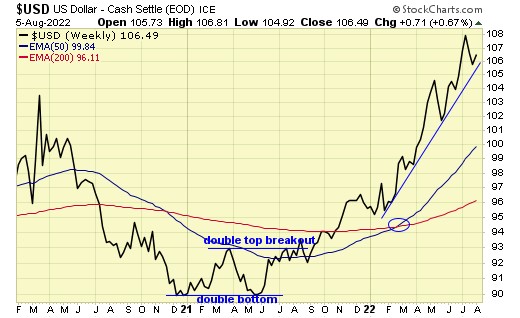
Trend is up for the dollar.
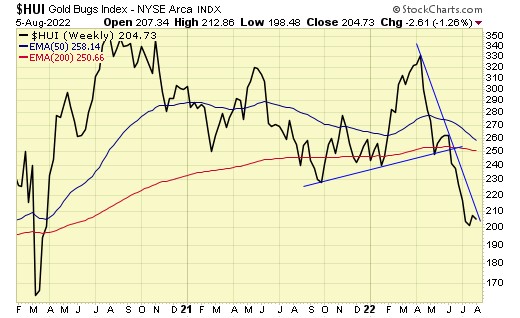
Trend is down for gold stocks.
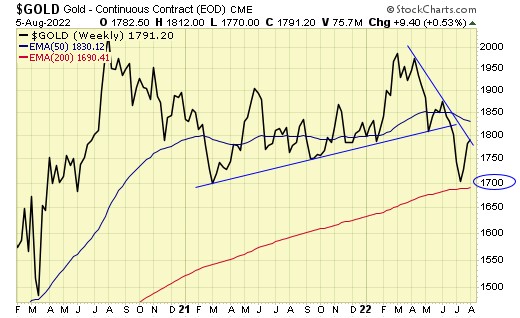
Trend is down for gold also.
Downside target achieved.

The decade long cup with handle remains in progress.
Summary
Long term – on SELL signal.
Short term – on buy signals.
Gold sector cycle is UP.
$$$ We are now holding trading positions as no core positions should be held during a long term sell signal.
Read Full Story »»»
DiscoverGold
Gold Stocks Deeply-Undervalued
By: Adam Hamilton | August 5, 2022
The gold miners’ stocks have been hammered to deeply-undervalued levels in recent months. Slammed by heavy gold-futures selling driven by an extreme parabolic US-dollar surge, the gold stocks have been largely abandoned. That left their stock prices anomalously low relative to gold, which overwhelmingly drives their earnings. This portends a massive mean-reversion higher to normalize gold-stock levels to gold.
Traders would be hard-pressed to find a sector more out-of-favor these days than the gold miners! That is evident in the dreadful price action of their leading sector benchmark and trading vehicle. Between mid-April to late July, the GDX VanEck Gold Miners ETF cratered a bullishness-slaying 39.8%! Since sentiment is driven by performance, that brutal walloping has left gold stocks mired in universal bearishness.
Big stock-price swings are generally assumed to be fundamentally-righteous, that recent newsflows must have justified them. But endless waves of herd greed and fear often temporarily distort prices away from normal valuations based on underlying corporate earnings. Imagine fair-value as a straight line, with actual stock prices oscillating around that like a sine wave. Gold stocks are now in a fear-driven trough.
This unsustainable anomaly was fueled by gold plunging 14.3% between mid-April to mid-July. That in turn was driven by a monster 8.8% US-Dollar-Index rally within that span, on the Fed’s most-extreme hawkish pivot in its entire century-plus history! That unleashed enormous gold-futures dumping, leaving speculators’ positioning at anomalous extremes after their capital firepower available for selling was spent.
As this unprecedented deviation from market norms unfolded in recent months, I wrote multiple essays on the US dollar’s parabolic spike and the resulting extreme gold-futures selling. But our focus today is the deeply-undervalued gold stocks left in that exceedingly-unusual event’s wake. Normally the major gold stocks of GDX amplify material gold moves by 2x to 3x, which is exactly what happened since mid-April.
That 39.8% GDX plummeting leveraged gold’s parallel 14.3% plunge by 2.8x, which is on the higher side of that usual historic range. This relationship between gold stocks and the metal they mine is driven by ironclad fundamentals. Gold miners’ profits magnify underlying moves in gold. Those are the difference between prevailing gold prices and mining costs, which are best considered in all-in-sustaining-cost terms.
That extreme gold-futures selling climaxed on July 20th, pummeling gold as low as $1,695 on close. As the major gold miners dominating GDX haven’t all reported their new Q2’22 results yet, the latest sector-wide AISC data remains Q1’s. During that previous quarter, the top-25 GDX gold miners averaged AISCs of $1,133 per ounce. Those would’ve yielded correction-trough sector earnings of $562 per ounce.
With gold rallying sharply since, that looks like a major bottoming. Gold’s current secular bull was born back in mid-December 2015. Since then there have been six uplegs, averaging hefty gains of 27.6% each. If this gold bull’s likely-underway seventh upleg merely clocks in at this precedent, gold would power up to $2,163. The GDX gold miners’ AISCs probably wouldn’t change much as gold’s gains mounted.
That’s because mining costs are largely fixed during planning stages, with nameplate ore-processing capacities that don’t change quarter-to-quarter. They require similar levels of infrastructure, equipment, and employees to keep running regardless of prevailing gold prices. So after another average gold upleg, the major gold miners’ unit profits could hit $1,030 per ounce. That’s soaring 83.3% on a 27.6% gold surge!
The GDX gold miners’ earnings would leverage this bog-standard gold advance around 3.0x. That’s why their stock prices similarly amplifying gold’s price swings is totally righteous fundamentally. Because the gold stocks’ profits are so closely intertwined with gold’s fortunes, the ratio between gold-stock prices to gold’s is a great proxy for sector valuation. One measure compares GDX with the dominant gold ETF.
That of course is the mighty American GLD SPDR Gold Shares. According to the latest data from the World Gold Council, at the end of Q2 GLD commanded a whopping 27.7% of all the gold held by all the world’s physically-backed gold ETFs! That dwarfed the 13.5% second place held by another American giant, the IAU iShares Gold Trust. Together their capital flows dominate global gold investment demand.
Simply dividing daily GDX closes by GLD ones yields the GDX/GLD ratio or GGR. When charted over time, that reveals when gold stocks are undervalued and overvalued compared to prevailing gold prices. Again if gold-stock fair-value is linear, the GGR captures those sentiment-driven oscillations around that baseline. As this chart shows, gold-stock valuations have just been bludgeoned to deeply-undervalued levels.
GDX apparently bottomed at $24.59 on July 25th, capping that miserable 39.8% selloff over 3.2 months. That day the battered gold-stock prices were so darned low that the GGR collapsed to 0.153x! In other words, GDX’s closing price that day was just 15.3% of GLD’s. That was the most-extreme undervaluation gold stocks had suffered relative to their metal since during March 2020’s pandemic-lockdown stock panic.
Defined as stock markets plummeting 20% in two weeks or less, these violent maelstroms of selling are exceedingly-rare. In March 2020, the world was trying to figure out how dangerous the new COVID-19 virus was. Unsure of mortality rates, governments mandated lockdowns to try and slow that virus’s spread. Those threatened to drastically slow the US economy, potentially even forcing it into a full-blown depression.
With the extreme uncertainty of a potential pandemic, the flagship US S&P 500 stock index collapsed a staggering 33.9% in just over a month! A 22.8% cratering during two weeks within it qualified as a stock panic. Naturally fear was off-the-charts, as traders didn’t know what to expect with corporate earnings, the US economy, or even their own families’ safety. So they aggressively dumped stocks and fled to cash.
In less than a couple weeks, the US Dollar Index skyrocketed a breathtaking 8.2% on safe-haven buying. That unleashed epic gold-futures selling bashing the metal 12.1% lower in that short span. That sounds familiar, eh? So in just several weeks, GDX crashed a horrific 38.8%! The major gold stocks amplified gold’s downside, pummeling the GGR all the way down to 0.133x. I warned then that extreme wasn’t sustainable.
Remember how unsettled you felt in March 2020 as lockdowns went into effect? Because it wasn’t just a markets or economic crisis but a potentially-lethal health one, that was the most-extreme fear event of our lifetimes. No one knew how that pandemic would play out, how many people would lose their lives or health to the scourge of COVID-19 and governments’ heavy-handed responses to it. That episode was crazy.
Unbelievably, those recent deeply-undervalued gold-stock levels relative to gold in late July 2022 almost rivaled those of March 2020! Let that sink in. Gold stocks were so overwhelmingly out-of-favor and left-for-dead that they challenged the most-extreme market fear event we’ll likely ever witness. Throughout that entire pandemic-lockdown stock panic, the GDX/GLD ratio only closed under 0.153x on five trading days!
So it is utterly absurd the GGR cratered to 0.153x in late July 2022. Today we aren’t facing a looming pandemic, we haven’t seen a stock panic, and the US economy isn’t threatening to roll over into a new depression. Instead all that has happened is a few months of heavy gold-futures selling spawned by a monster parabolic US-dollar surge on the Fed’s most-extreme hawkish pivot ever. Now all that’s behind us.
After the Federal Open Market Committee’s massive 50-basis-point, 75bp, and 75bp federal-funds-rate hikes at its last three meetings, this fierce rate-hike cycle’s shock-value has passed. After these big-and-fast hikes and Fed officials’ hawkish jawboning previously ignited big US-dollar buying and crushing gold-futures selling, that is exhausted. The wildly-overcrowded long-dollar and short-gold trades ran out of steam.
In three days starting with the Fed’s huge late-July hike, the US Dollar Index fell 1.2% while gold surged 2.7%! Speculators’ gold-futures positioning had grown so crazy-bearish that they had run out of capital firepower to keep dumping longs and adding shorts. The lopsided situations in US-dollar futures and opposing euro futures are similar. So the dollar peaked in mid-July while gold bottomed four trading days later.
Since then the US Dollar Index has retreated 2.6% at worst while gold has surged 4.5% at best. At its normal historical leverage to gold of 2x to 3x, GDX should’ve rallied between 9% to 14% with gold mean-reverting higher. Yet as of the middle of this week, the battered major gold stocks had merely recovered 6.8% at best. The gold miners have lagged gold’s young V-bounce, languishing at deeply-undervalued levels.
So far the GGR has only regained 0.160x at best, still exceedingly low based on gold-bull precedent. In that terrifying pandemic-lockdown stock panic, the GGR only closed at or under 0.160x on ten trading days! These recent crushed gold-stock prices relative to gold are ridiculous and unsustainable. The gold stocks have blasted far higher in massive mean-reversion rallies out of past episodes of excessive fear.
That last time GGR levels collapsed so low is a great example. After March 2020’s stock-panic anomaly, GDX skyrocketed 134.1% higher over the next 4.8 months! That proved a textbook mean-reversion and overshoot out of radically-oversold levels. The major gold stocks could easily more than double again in this next upleg out of their latest deeply-undervalued extremes. There’s lots of precedent supporting big gains.
That can start with this GDX/GLD-ratio valuation proxy itself. Since 2020 which includes that stock panic and recent capitulation, the GGR averaged 0.200x. If this gold bull’s likely-underway seventh upleg again reaches the previous six’s 27.6% average gains, GLD shares would power up near $201.66. At recent years’ skewed-low average GGR, GDX would hit $40.33 which would make for strong 64% gold-stock gains.
But like those sentiment-fueled valuation sine waves oscillating around that linear baseline, GGR mean-reversions after extremes tend to keep running towards the opposite ones. So as gold stocks surge high enough to eventually fuel popular greed, traders chasing big upside should catapult the GGR way above its average. It peaked at 0.241x in late July 2020, overshooting after that pandemic-lockdown stock panic.
Plug that into an average gold upleg in GLD terms and it yields a $48.60 GDX target, which would make for fantastic 98% upleg gains! That’s in-line with precedent during this secular gold bull, as GDX’s six previous uplegs paralleling gold’s have averaged rich 77.7% gains. And those are skewed low by the last couple, which were prematurely truncated by heavy gold-futures selling as Fed hawkishness drove up the dollar.
And major-gold-stock gains out of these recent deeply-undervalued levels could grow far larger. All that extreme gold-futures selling since mid-April made investors forget gold has proven the ultimate inflation hedge. Thanks to this profligate Fed effectively more than doubling the US monetary base by ballooning its balance sheet 115.6% higher in just 25.5 months into mid-April, a terrible inflation super-spike is underway.
Relatively-far-more money chasing and bidding up the prices on relatively-way-less goods and services is fueling general-price surges unlike anything seen since the 1970s. That decade’s monetary excesses forced the last two inflation super-spikes. Gold skyrocketed during both on soaring investment demand, as raging inflation ravaged stock prices and investors’ purchasing power. Diversifying into gold was essential.
During that first inflation super-spike into the mid-1970s, monthly-average gold prices soared 196.6% higher in 30 months from trough to peak US Consumer-Price-Index inflation reads! Then during the second in the late 1970s, this same conservative gold measure rocketed 322.4% higher in 40 months! With inflation raging again at 1970s levels, gold’s next upleg has high odds of seeing gains far above average.
Plug in 50%+ gold gains and a resulting bigger GGR mean-reversion overshoot as traders rush back to chase soaring gold stocks, and their upside potential is breathtaking. Interestingly after gold itself was pummeled to radically-oversold levels in March 2020’s stock panic, its rebound upleg clocked in at huge 40.0% gains! And that was with no meaningful inflation, nothing but upside momentum to attract back investors.
The gold miners’ improving operating fundamentals could accelerate their next upleg too. While plenty are suffering higher consumables costs driven by this furious inflation, many are still forecasting rising production in the second half of this year. Better ores yielding more ounces to spread the mining costs across could actually lower average all-in sustaining costs despite inflation! That would boost profits leverage.
Gold-stock valuations relative to gold meander in cycles, and this GGR chart reveals gold-stock prices have been losing ground for a couple years. But this GGR downtrend is overdue to reverse, ushering in a glorious multi-year stretch of gold stocks outperforming gold! And the fundamentally-superior mid-tiers and juniors better able to consistently grow their outputs will see gains trouncing those of the GDX majors.
It’s certainly hard being contrarian, fighting the herd to buy low when sectors are seriously out-of-favor and deeply-undervalued. But that’s the surest way to multiply capital in the markets, buying really low then later selling much higher. After the last time gold stocks were pummeled to such crazy-low levels relative to gold during March 2020’s stock panic, GDX soared 134.1% in 4.8 months in a mean-reversion overshoot!
If you regularly enjoy my essays, please support our hard work! For decades we’ve published popular weekly and monthly newsletters focused on contrarian speculation and investment. These essays wouldn’t exist without that revenue. Our newsletters draw on my vast experience, knowledge, wisdom, and ongoing research to explain what’s going on in the markets, why, and how to trade them with specific stocks.
That holistic integrated contrarian approach has proven very successful, yielding massive realized gains during gold uplegs like this latest getting underway. We extensively research gold and silver miners to find cheap fundamentally-superior mid-tiers and juniors with outsized upside potential as gold powers higher. Their gains are already mounting in our full trading books. Subscribe today and get smarter and richer!
The bottom line is gold stocks are deeply-undervalued today relative to the metal they mine. They were pummeled relentlessly lower in recent months, as extreme gold-futures selling slammed gold. That left this sector the cheapest and most-oversold it has been since March 2020’s pandemic-lockdown stock panic! But with futures speculators’ capital firepower for selling exhausted, gold is starting to mean-revert higher.
Emerging from unsustainable lows fueled by anomalous fear, gold stocks’ upside potential is huge. After that last similar episode a couple years ago, GDX skyrocketed 134% in less than 5 months in a massive mean-reversion-overshoot upleg. And with inflation now raging in its first super-spike since the 1970s, gold’s coming upleg gains ought to prove way bigger than their 40% last time around. So gold stocks should fly!
Read Full Story »»»
DiscoverGold
COT - Commitments of Traders in Metals Futures Market Reports
By: Software North | August 5, 2022
Gold
Silver
Read Full Story »»»
DiscoverGold
GDX - The rally out of the July 25 low should last at least until September 12.
By: CyclesFan | August 4, 2022
• $GDX - The typical duration of a rally after a significant decline in the last 2 years has been either 34 trading days or 54 trading days. This means that the rally out of the July 25 low should last at least until September 12.

Read Full Story »»»
DiscoverGold
Rally Targets in Gold & Gold Stocks
By: Jordan Roy-Byrne | August 4, 2022
Two weeks ago, I wrote about the potential for a rally in gold stocks. They were extremely oversold, trading at support, and the selling was abating.
Precious Metals bottomed before the Fed decision last week and jumped higher following the decision. This week they have retreated a bit thanks to Fed jawboning.
Nevertheless, the path of least resistance in August should be higher.
Below we start with GDX and GDXJ.
Merely rallying back to previous resistance could take GDX to $29-$30 and GDXJ to $37. Additional upside could entail a test of the 200-day moving averages at $32 and $41.
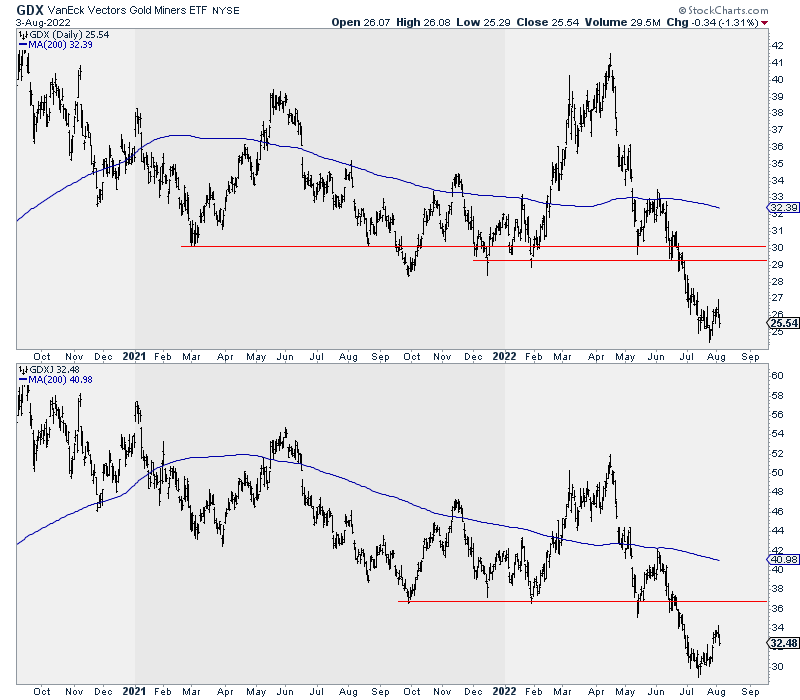
Turning to the metals, note that Gold has already rallied by over $100/oz. It has pulled back but remains some $100/oz off the low. There is a confluence of resistance at $1830 and $1841, the 200-day moving average.
Silver already rebounded from $18 to $20. It closed Wednesday at $19.89. The next strong resistance target is $22.
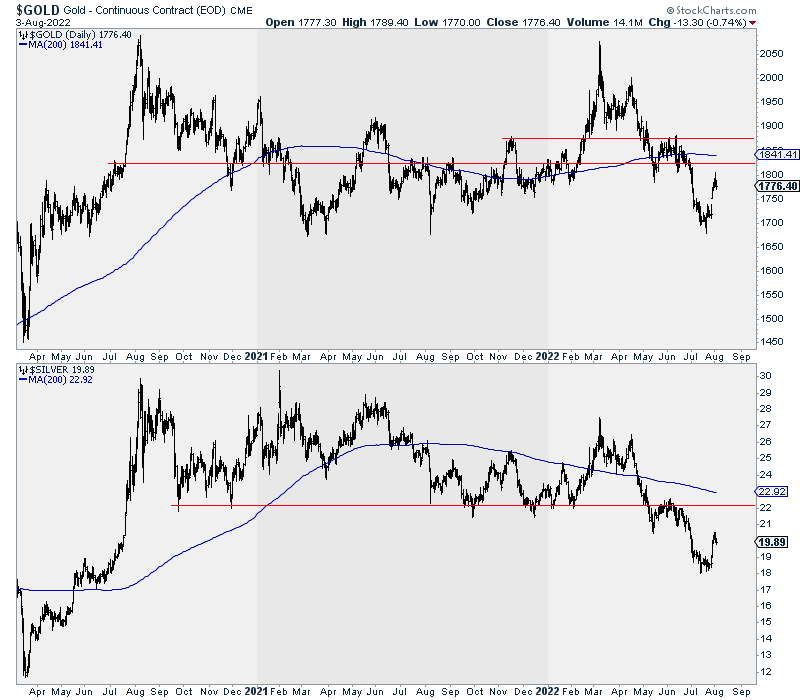
Whether precious metals have hit bottom or the bottom is ahead depends on economic data, market movements, and Fed policy.
We are approaching a turning point and an important shift in Fed policy, but it is too early to pinpoint the timing.
If the economic data does not deteriorate and bond yields don’t plunge over the coming weeks, the market could continue to discount the Fed hiking in September and November. That scenario is negative for precious metals.
However, if the economic data worsens and the 10-year yield and Oil plunge lower (because both have started to crack), the Fed could be forced to pivot in September. As a result, the current fledgling rally would have legs.
Regardless of the outcome over the next six weeks, precious metals remain in a very strong position for the next six to 12 months. A Fed policy shift and rate cuts are inevitable, and that will spur, at worst, an incredible rebound for several quarters.
Read Full Story »»»
DiscoverGold
Earnings Preview: Barrick Gold Corp. (NYSE: GOLD)
By: 24/7 Wall St. | August 4, 2022
• Here are previews of four earnings reports due out first thing Monday morning.
Barrick Gold
Over the past 12 months, the price of gold has dipped by about 1.3%. Barrick Gold Corp. (NYSE: GOLD) has seen its share price plunge by 30% over the same period. Since June 10, Barrick stock has dropped by nearly 28%. Lower gold prices played a role, of course, but the bigger problem for Barrick was a July announcement that its costs were going to be 3% to 5% higher in the second quarter than previously forecast.
Analysts remain bullish on Barrick stock, with 19 of 24 brokerages having a Buy or Strong Buy rating while the rest have Hold ratings. At a recent price of around $15.20 per share, the upside potential based on a median price target of $27.00 is about 77.6%. At the high price target of $29.00, the upside potential is nearly 91%.
Second-quarter revenue is forecast at $2.85 billion, which would be flat sequentially and down about 1.4% year over year. Adjusted EPS are forecast at $0.22, down 14.4% sequentially and down 24.1% year over year. For the full 2022 fiscal year, estimates call for EPS of $1.01, down 12.7%, on sales of $11.89 billion, down 0.8%.
Barrick stock trades at 15.0 times expected 2022 earnings, 14.1 times estimated 2023 earnings of $1.08 and 14.1 times estimated 2024 earnings of $1.08 per share. The stock’s 52-week range is $14.80 to $26.07. Barrick pays an annual dividend of $0.40 (yield of 2.54%). Total shareholder return for the past year was negative 27.4%.
Read Full Story »»»
DiscoverGold
Lows for GDX have formed when both indicators traded below -20
By: Tim Ord | August 2, 2022
• Lows have formed when both indicators traded below -20; noted with red vertical lines. previous signals lead to a sideways or up and down pattern before the rally began, that condition may happen here. These signals where intermediate term.

Read Full Story »»»
DiscoverGold
Newmont Corporation (NEM) 2.30 Million Share at $44.84 #darkpool print
By: Money Flow Mel | August 2, 2022
• $NEM 2.30 million share #darkpool print at $44.84.

Read Full Story »»»
DiscoverGold
$GDX bottomed only this week and therefore still has to close above 26.39 next week to confirm that the 40 week cycle low is in
By: CyclesFan | August 1, 2022
• $GDX bottomed only this week and therefore still has to close above 26.39 next week to confirm that the 40 week cycle low is in, but since gold has already confirmed it, it's obvious that the low is in on week 43. The minimal target for the next weekly cycle high is likely 30.

Read Full Story »»»
DiscoverGold
Did GDX and GOLD recently hit the bottom for the rest of this century, a week or so ago?
gold goes steadily down for 18 months and bounces 3 percent for a couple of days and people start writing that this great rally "has more room to run"
Gold Forecast: Predicted Gold Rally Has More to Run
By: Jim Curry | July 31, 2022
Recapping Last week
Last week's trading saw Gold forming its low in Tuesday's session, here doing so with the tag of the 1727.00 figure. From there, a sharp rally was seen into late-week, with the metal pushing all the way up to a Friday peak of 1784.60 - also ending the week at or near the same. Note: We move to the December, 2022 contract for our numbers.
Gold's Short-Term View
As pointed out in recent articles, Gold was looking for a key short-term low to form, with that low coming from the 10, 20 and 34-day cycles. As noted last weekend, that bottomed looked to have formed - and with that suggested that a very sharp rally was in store for Gold. The chart below shows our 34-day time cycle:
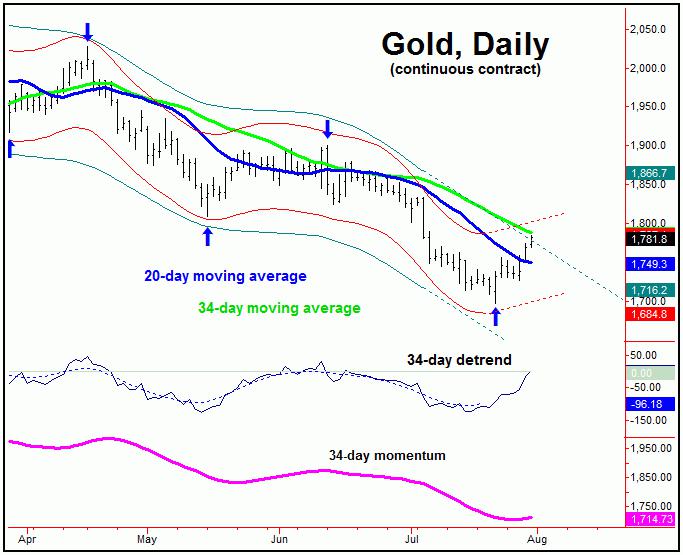
From last weekend: "the probabilities now tend to favor this short-term combination low to be set in place. Going further, that action suggests the potential for a sharp rally in the coming weeks, with the 34-day moving average or better acting as the ideal magnet."
As mentioned above, the minimum upside potential for the metal was back to the 34-day moving average for Gold - which has nearly been met with the action seen into Friday's session.
If the move is going to end up as an immediate failure, then it would do so at or near this same 34-day average - which is also near the upper (and declining) 72-day cycle channel. From there, a drop back to or below the lows would be possible into the mid-to-late August timeframe, before bottoming the larger 72-day cycle:
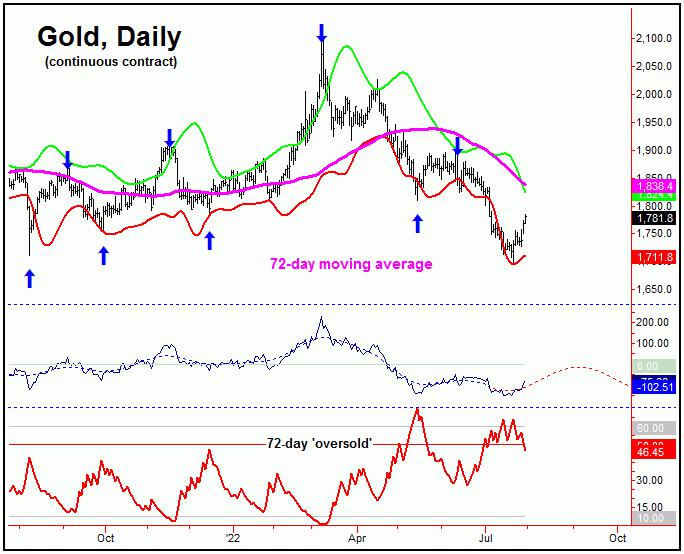
From last weekend: "there is one alternate that I am considering - and a strong case can actually be made for the same. That is, the most recent low was not only a bottom for the 10, 20 and 34-day cycles, but will also end up as a contracted trough for our larger 72-day wave. If this were to end up as correct, then the current rally would have the potential to rise as high as the 72-day moving average, and/or the upper 72-day cycle band - each of which are well over 100 points above current price levels. In other words, there is the potential for a huge amount of upside for Gold, at least for the short-term."
The alternate path noted last weekend has moved to the preferred scenario going forward. In other words, our larger 72-day cycle looks to have seen a contracted low at the July 21st bottom - and with that is headed on higher in the near-term, with the 72-day upper cycle band acting as the magnet.
There were several factors supporting a contracted low with the 72-day wave, with the first being our 72-day detrend, which had been projecting a shortened (contracted) time trough for this particular cycle.
Going further with the above, at the July 21st low our 72-day 'oversold' indicator (which moves inverse to price) was already back above its upper reference line, along with price being below the lower 72-day cycle band. This setup is normally seen near key bottoms with this 72-day component.
Gold's Mid-Term View
For the mid-term picture, however, the overall assumption is that the rally phase of the 72-day cycle will end up as a countertrend affair, giving way to lower lows into mid-to-late October of this year or later. This again is due to the current position of the larger 310-day cycle, shown again on the chart below:
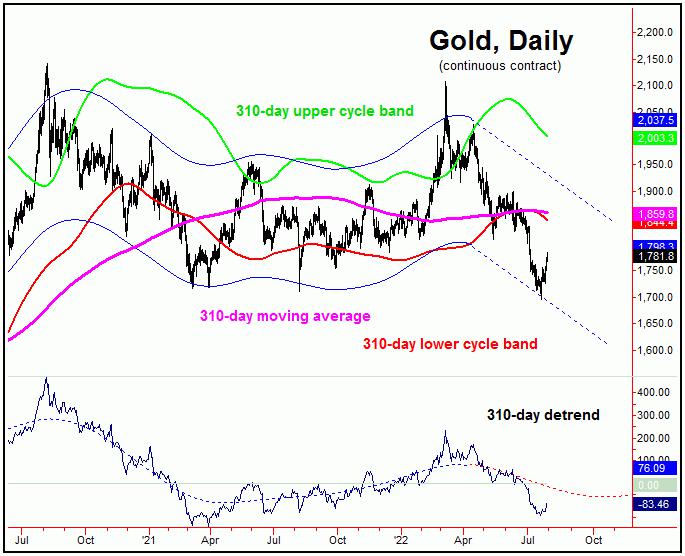
The upward phase of this 72-day wave is projected to end up as countertrend - holding below the June peak of 1900.50 - the last labeled top for this particular cycle. If correct, the next downward phase of that cycle would be favored to give way to lower lows for the larger swing into mid-October or later.
Going further with the above, the mid-October timeframe is when the next trough is projected with our larger 310-day component, with the potential for Gold to push down to the 1650's or below as this bigger wave attempts to trough. From there, we will need to be on the lookout for key technical indications of a mid-term bottom forming - as what follows is expected to be a rally of some 20-25% or more, lasting into well into the Spring of 2023. Stay tuned.
Read Full Story »»»
DiscoverGold
GDX appears to be turning the corner to the upside
By: Tim Ord | July 29, 2022
• Good sign short term for both 18 day average of the Up down volume and A/D indicators above "0" which happens when GDX starts uptrend. $GDX appears to be turning the corner to the upside.

Read Full Story »»»
DiscoverGold
Really JC, i hope you dont sell that stuff. Anyone can claim direction after the turn.
Jack Chan: Gold Price Exclusive Update
By: Jack Chan | July 30, 2022

Our proprietary cycle indicator is now UP.
To public readers of our updates, our cycle indicator is one of the most effective timing tool for traders and investors. It is not perfect, because periodically the market can be more volatile and can result in short term whipsaws. But overall, the cycle indicator provides us with a clear direction how we should be speculating.
Investors
During a major buy signal, investors can accumulate positions by cost averaging at cycle bottoms, ideally when prices are at or near the daily 200ema.
During a major sell signal, investors should be hedged or in cash.
Traders
Simply cost average in at cycle bottoms when prices are at or near the daily 200ema; and cost average out at cycle tops when prices are above the daily 50ema.

Gold sector is on long term SELL signal as the recent buy signal has failed.
The correction since 2020 drags on.
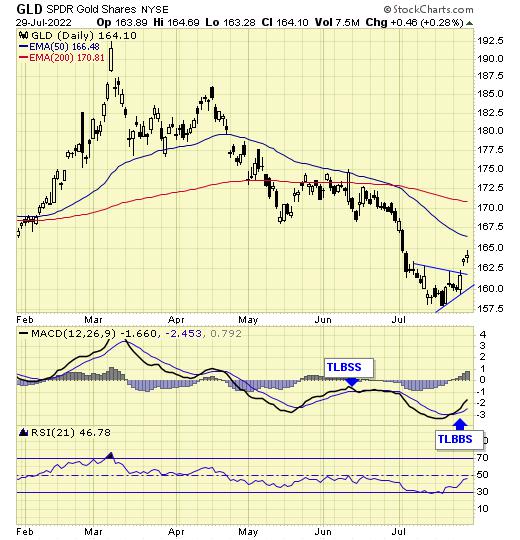
GLD is on short term buy signal.
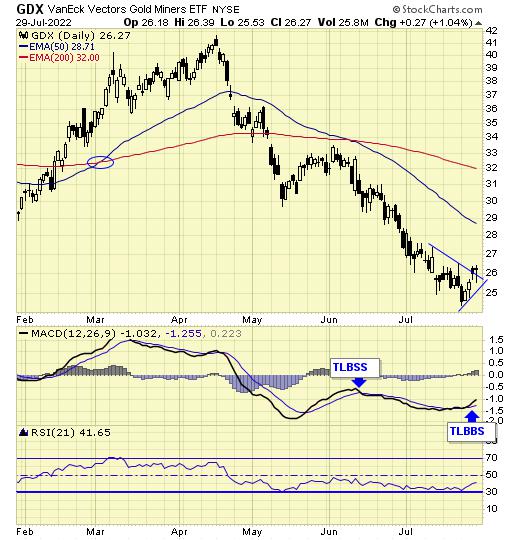
GDX is on short term buy signal.
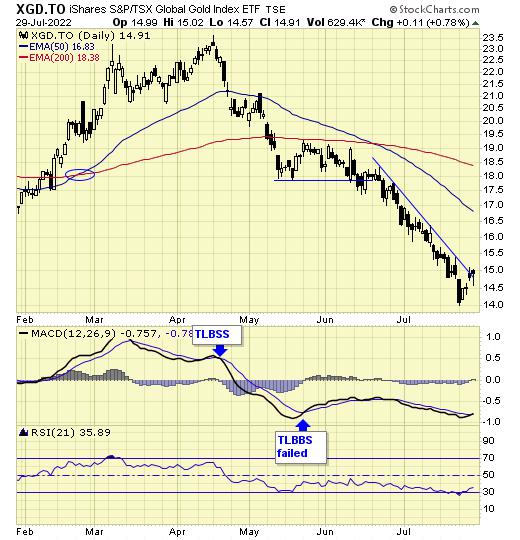
XGD.to is on short term sell signal.
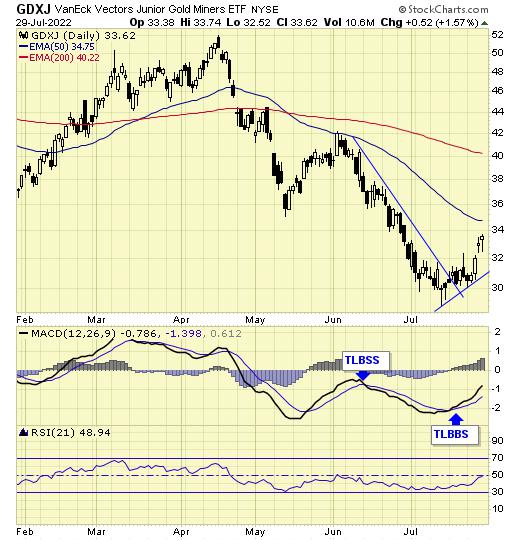
GDXJ is on short term buy signal.
Analysis
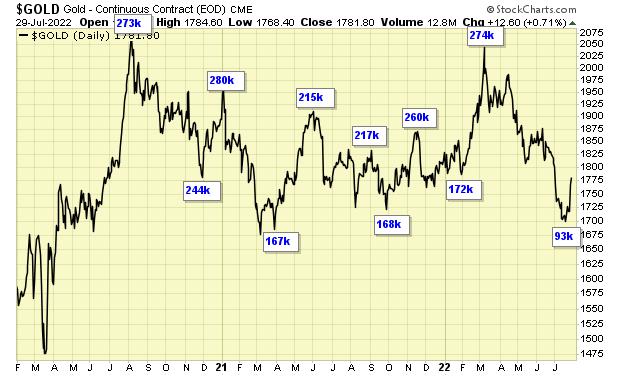
Speculation at the lowest level in two years.
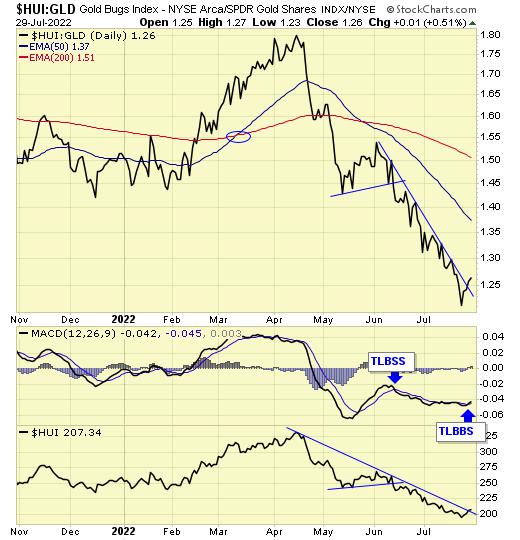
Our ratio is on a new BUY signal.

Trend is up for the dollar.
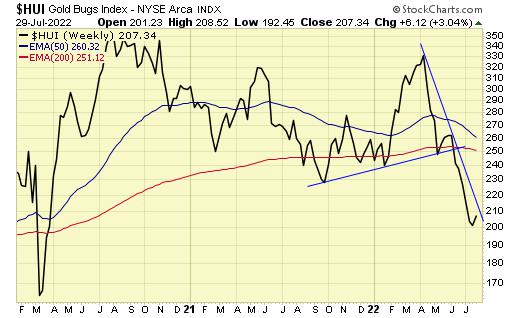
Trend is down for gold stocks.
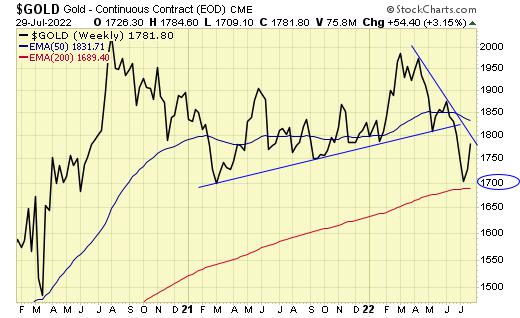
Trend is down for gold also.
Downside target achieved.
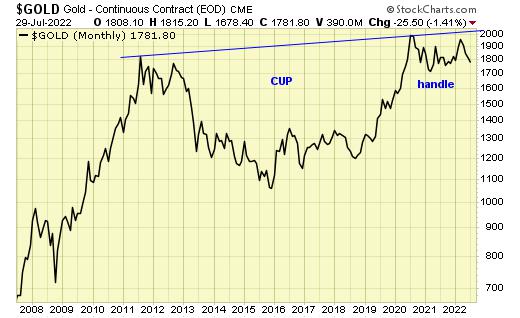
The decade long cup with handle remains in progress.
Summary
Long term – on SELL signal.
Short term – on mixed signals.
Gold sector cycle is UP.
$$$ We are now holding trading positions as no core positions should be held during a long term sell signal.
Read Full Story »»»
DiscoverGold
NY Gold Futures »» Weekly Summary Analysis
By: Marty Armstrong | July 30, 2022
The NY Gold Futures has been in an uptrend for the past 2 days closing above the previous session's high. Currently, the market is trading in a neutral position on our indicators but it is trading strongly higher up some 1.95% from the previous session low. Our projected target for closing resistance for the next session stands at 18223, we need to close above that target to imply a further advance. Failure to even exceed this intraday warns that the upward momentum is starting to decline. Nevertheless, this session closed below our ideal projection for closing resistance warning that the market which stood at 18397 is forming a high. A break of this session's low of 17684 will warn that we have a potential temporary high in place.
ECONOMIC CONFIDENCE MODEL CORRELATION
Here in NY Gold Futures, we do find that this particular market has correlated with our Economic Confidence Model in the past. The Last turning point on the ECM cycle low to line up with this market was 2015. The Last turning point on the ECM cycle high to line up with this market was 2020 and 2011 and 1996.
MARKET OVERVIEW
NEAR-TERM OUTLOOK
The NY Gold Futures has continued to make new historical highs over the course of the rally from 2015 moving into 2022, which has been a run of 7 years warning that timing wise a pause remains possible. Currently, the market has dropped back and is trading beneath the previous year's close warning of a potential correction in play. This is especially true since we are facing an outside reversal to the downside by penetrating the previous year's low as well.
This market remains in a positive position on the weekly to yearly levels of our indicating models.
The perspective using the indicating ranges on the Daily level in the NY Gold Futures, this market remains moderately bearish position at this time with the overhead resistance beginning at 171170 and support forming below at 17264. The market is trading closer to the support level at this time.
On the weekly level, the last important high was established the week of June 13th at 188250, which was up 4 weeks from the low made back during the week of May 16th. We have been generally trading down for the past 6 weeks, which has been a very dramatic move of 90.92%.
Looking at this from a broader perspective, this last rally into the week of June 13th reaching 188250 failed to exceed the previous high of 200300 made back during the week of April 18th. That rally amounted to only four weeks. Subsequently, the market has breached that low of the week of May 16th and has closed beneath it warning the market is weak. Since then, the market has consolidated for the past 6 weeks. Right now, the market is below momentum on our weekly models casting a bearish cloud over the price action. Looking at this from a wider perspective, this market has been trading up for the past 2 weeks overall.
INTERMEDIATE-TERM OUTLOOK
YEARLY MOMENTUM MODEL INDICATOR
Our Momentum Models are declining at this time with the previous high made 2020 while the last low formed on 2021. However, this market has rallied in price with the last cyclical high formed on 2020 and thus we have a divergence warning that this market is starting to run out of strength on the upside.
The NY Gold Futures opened within last year's trading range which was 196250 to 167330. However, at this moment, it is currently trading below last year's low of 167330. The last time such a similar pattern took place was 1996. Right now, the market is trading below where it opened for the year. As long as this market remains trading below 112486 on a closing basis, then a year-end closing in this posture will warn that we could have a temporary high in place this year.
This market is trading well beneath that high of March which was 207880 by more than 10 percent. This warns that the trend is weak moving forward. Nevertheless, at this time, the market is still weak.
DiscoverGold Metals Have Their Chance
By: Avi Gilburt | July 28, 2022
• Following the Elliott Wave analysis:
As I have been saying for some time, I have been looking at silver for a major catch up move once we confirm the next bullish trend has indeed begun. And it is simply because silver has a lot of catching up to do to the rest of the complex as to where it resides in its wave count. So, with silver taking the lead today, I am expecting it to continue, that is, as long as we are able to complete a full 5 waves up for wave (i).
So, as promised, I provided a micro pivot on the silver chart today, before we broke out. And, as we are now through the pivot, the pivot now becomes IMPORTANT support over which we must remain to keep the pressure up.
Now, in truth, if this is the real deal in silver, and we have indeed begun the 3rd wave of wave (i), then we should be seeing some serious extensions over the coming week or so, as outlined on the 144-minute silver chart. So, clearly, I want to see some serious follow through this week to prove this is the real deal.
As far as gold is concerned, well, it is a bit lackluster, and seems to still need to complete wave i of 3 of the low. So, until it also breaks out over its pivot, it will likely lag a bit.
Then the ultimate laggard is GDX. While the GDX has a GORGEOUS bottoming structure in place, with the supporting technicals to back it up, I cannot get excited until I see an impulsive move through 26.50. Otherwise, yes, there is still some potential for a dreaded lower low. So, watch that 26.50 level in the coming days.
Overall, I am tracking silver very carefully here, as it is at a point of no return. It must keep pressure up and continue to prove that a bottom has been struck. I am assume it will pull the rest of the charts up with it if it can maintain upside pressure over support.

GC5min

GLDdaily

GDXdaily

silver-8min

Silver-144min
Read Full Story »»»
DiscoverGold
|
Followers
|
149
|
Posters
|
|
|
Posts (Today)
|
0
|
Posts (Total)
|
5670
|
|
Created
|
06/29/08
|
Type
|
Free
|
| Moderators DiscoverGold trunkmonk | |||

http://www.vaneck.com/index.cfm?cat=3192&tkr=GDX&LN=3-02
The Gold Miners ETF seeks to replicate as closely as possible, before fees and expenses, the price and yield performance of the NYSE Arca Gold Miners Index. The Index provides exposure to publicly traded companies worldwide involved primarily in the mining for gold, representing a diversified blend of small-, mid- and large-capitalization stocks. As such, the Fund is subject to the risks of investing in this sector.
| ||||||||||||||||||||||||||||||||||||||||||||||||||||||||||||||||||||||||||||||||||||||||||||||||||||||
| DAILY |
| WEEKLY |
| Volume | |
| Day Range: | |
| Bid Price | |
| Ask Price | |
| Last Trade Time: |


