 News
News  Market Data
  Discover
Support: 888-992-3836
Copyright © 2023 InvestorsHub Inc.


Register for free to join our community of investors and share your ideas. You will also get access to streaming quotes, interactive charts, trades, portfolio, live options flow and more tools.
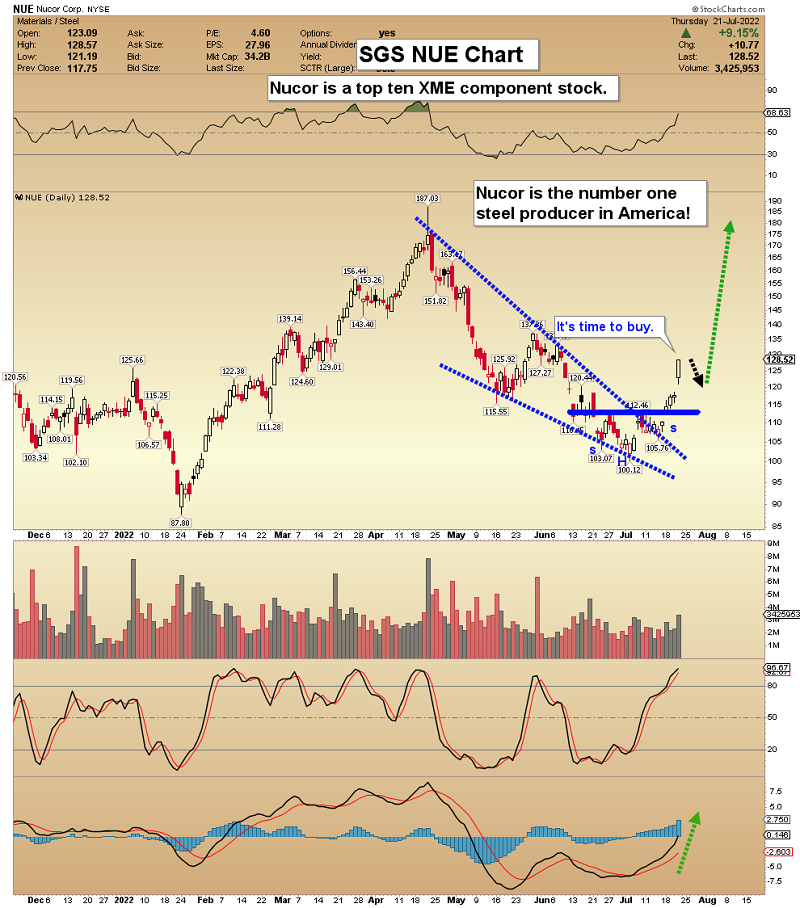
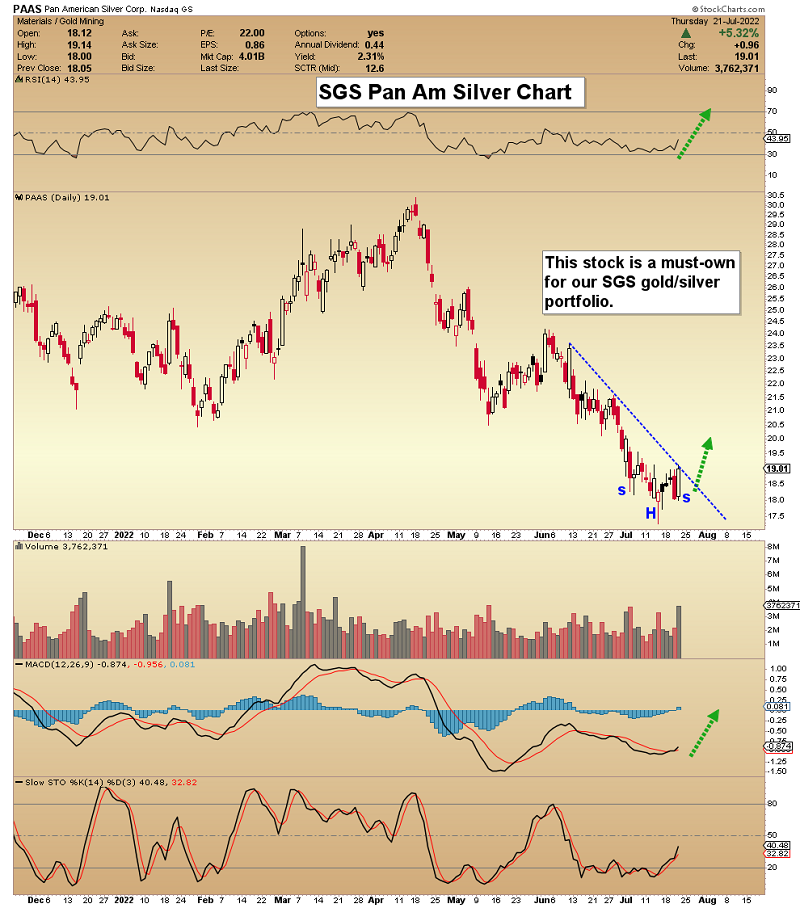
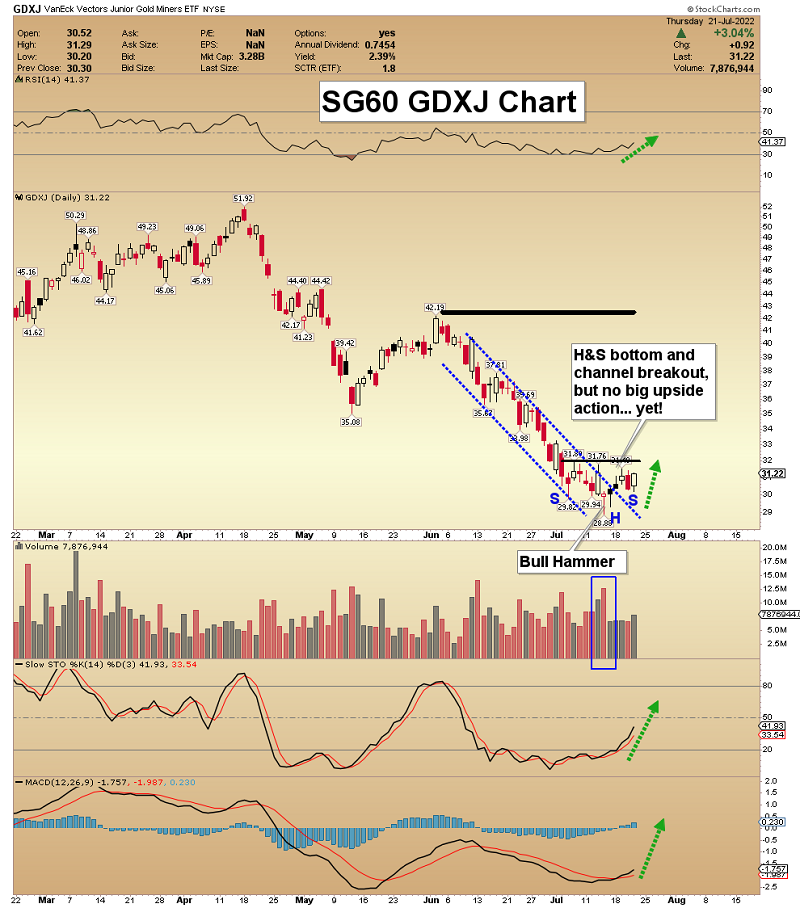
Gold & Silver: Rocket Launch Now
By: Morris Hubbartt | July 30, 2022
Super Force Signals (SFS) is being rebranded as Super Gold Signals (SGS at https://supergoldsignals.com), to reflect the growing global importance of gold.
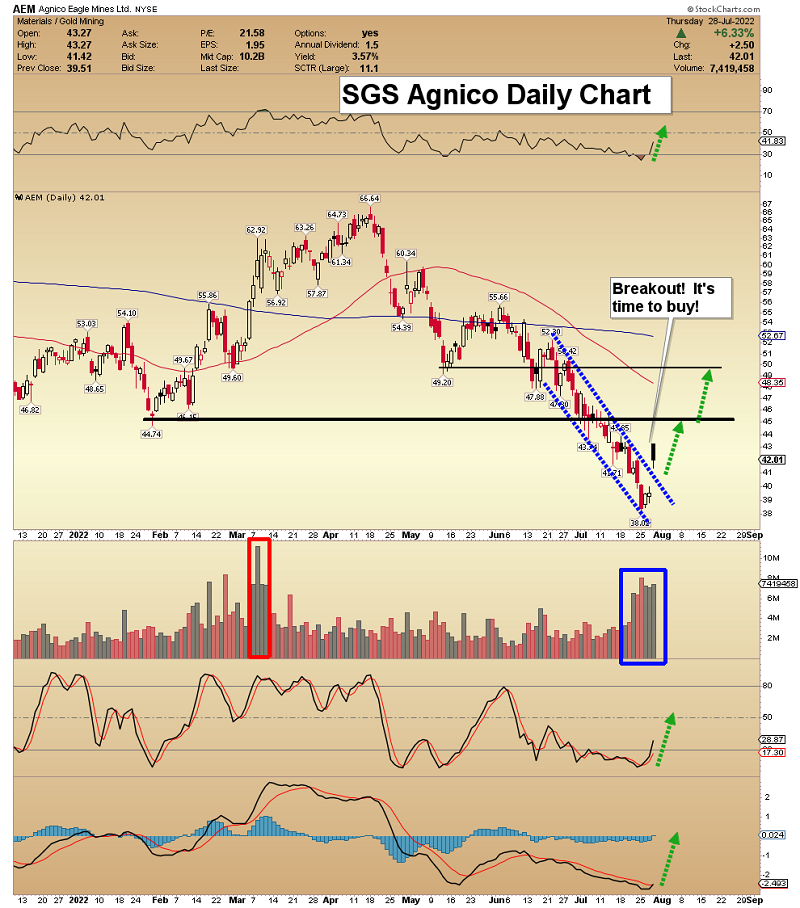
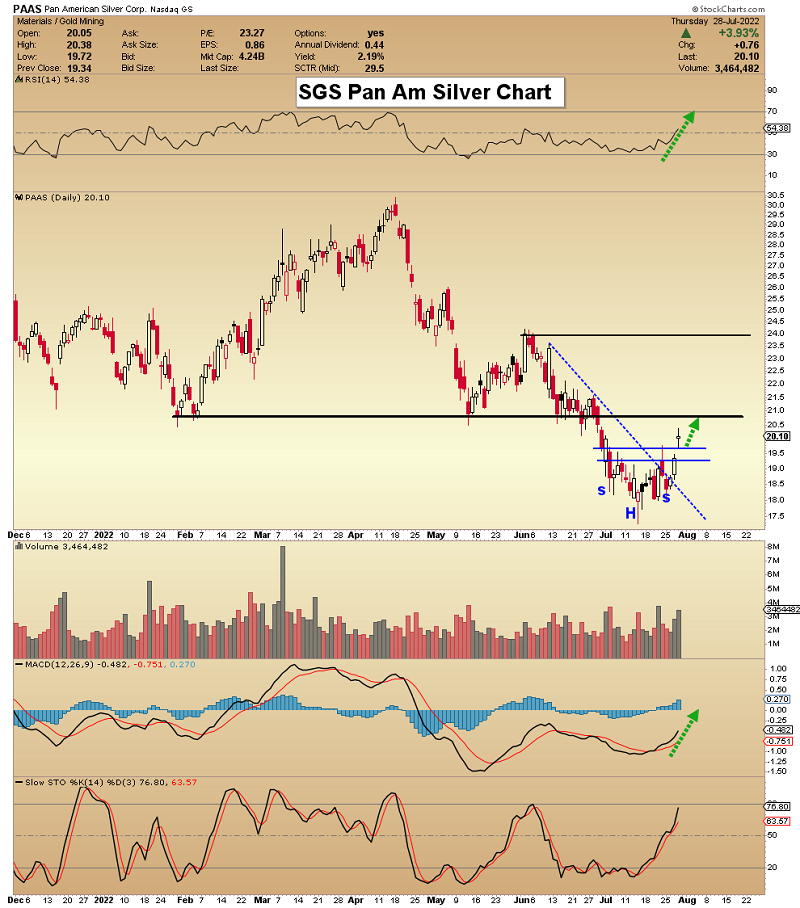
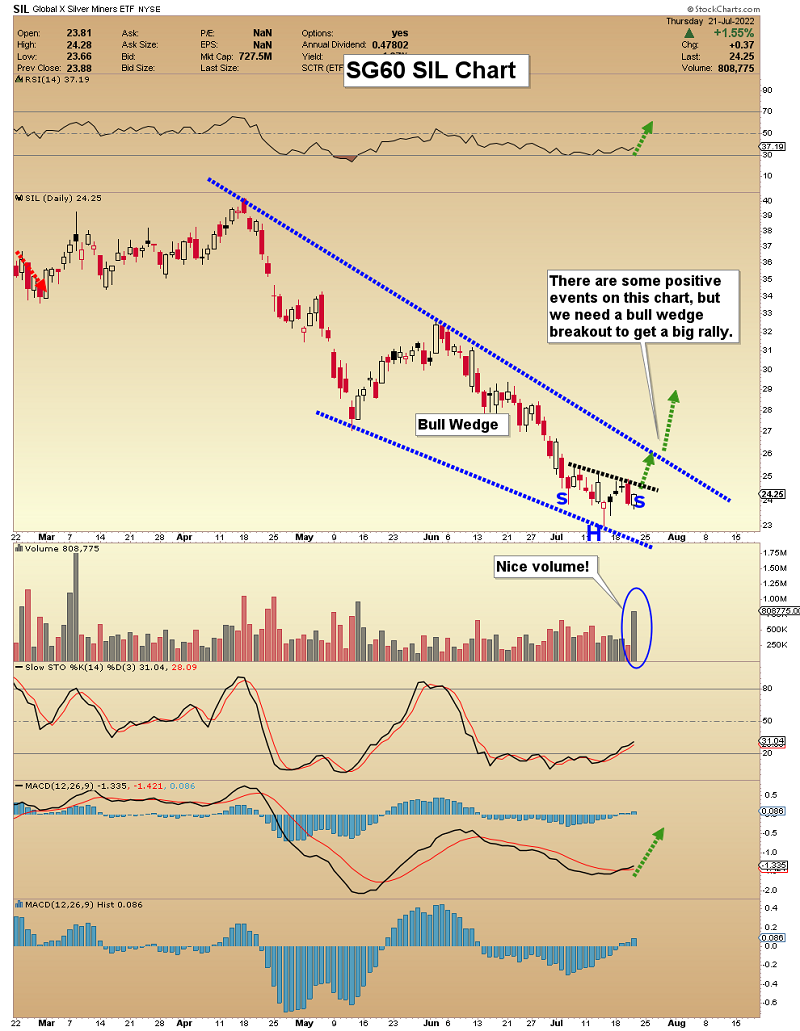
SG60 Key Charts, Signals, & Video Analysis
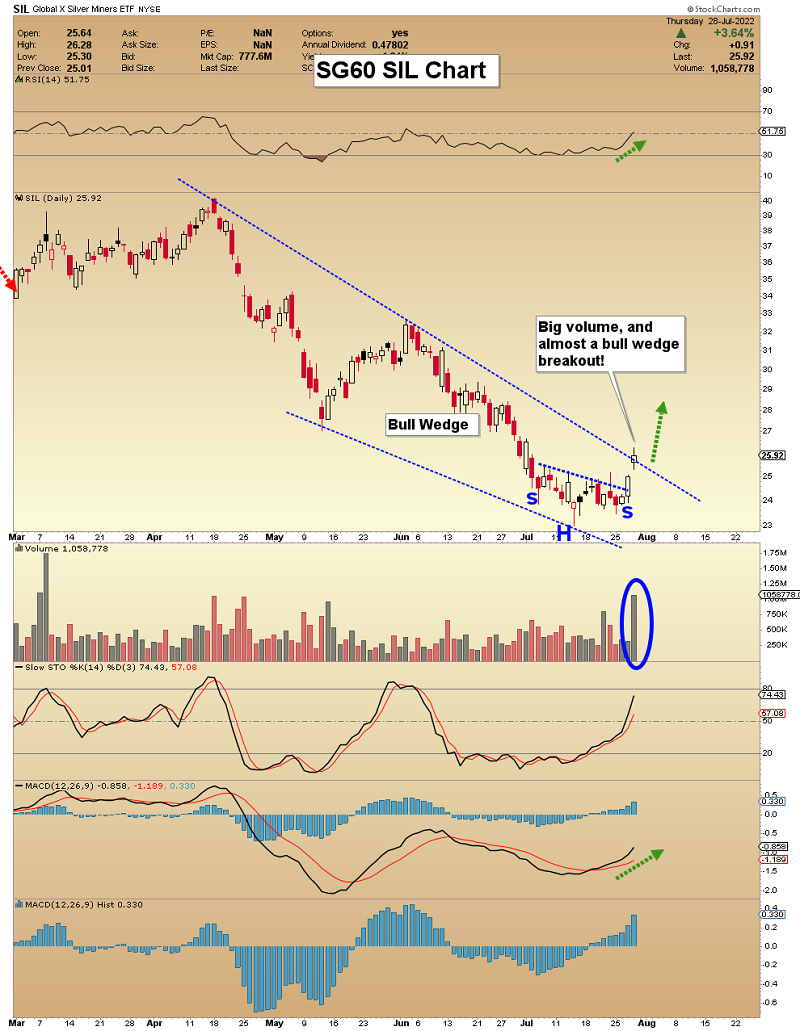
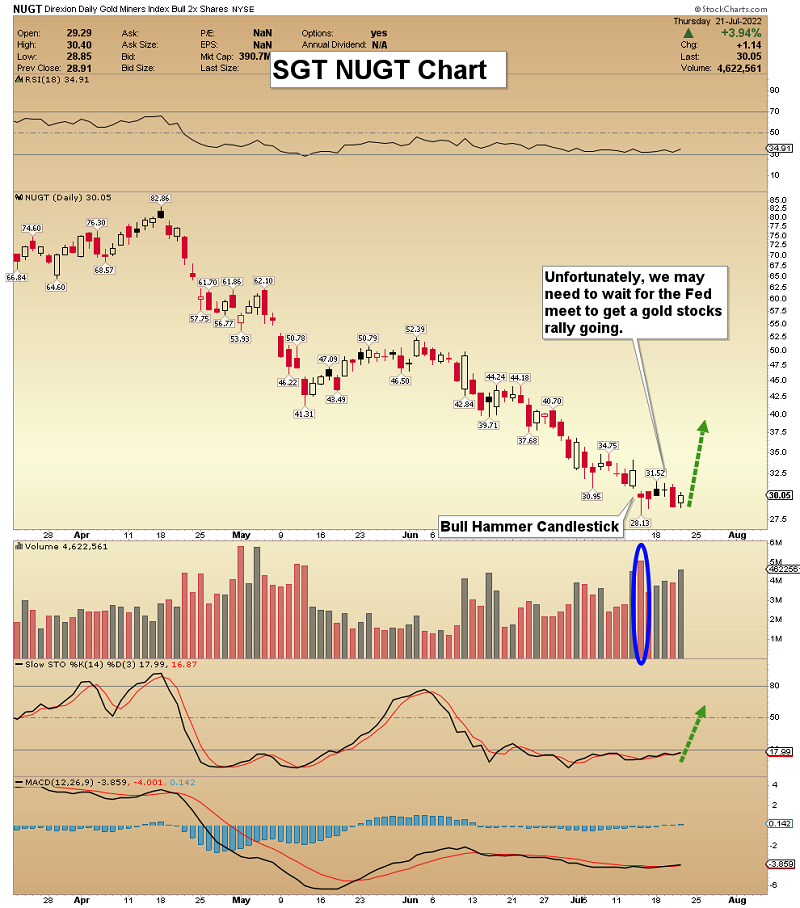
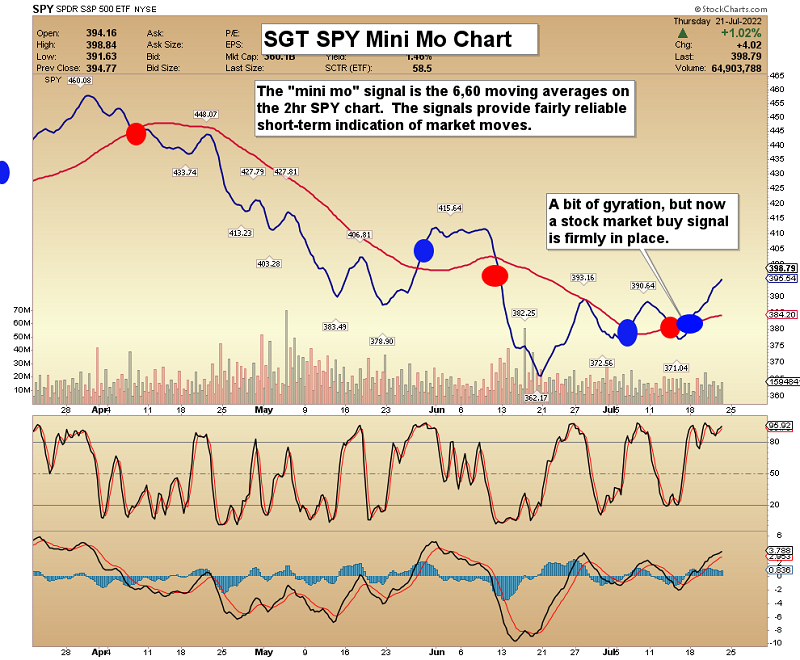
SGT Key Charts, Signals, & Video Analysis
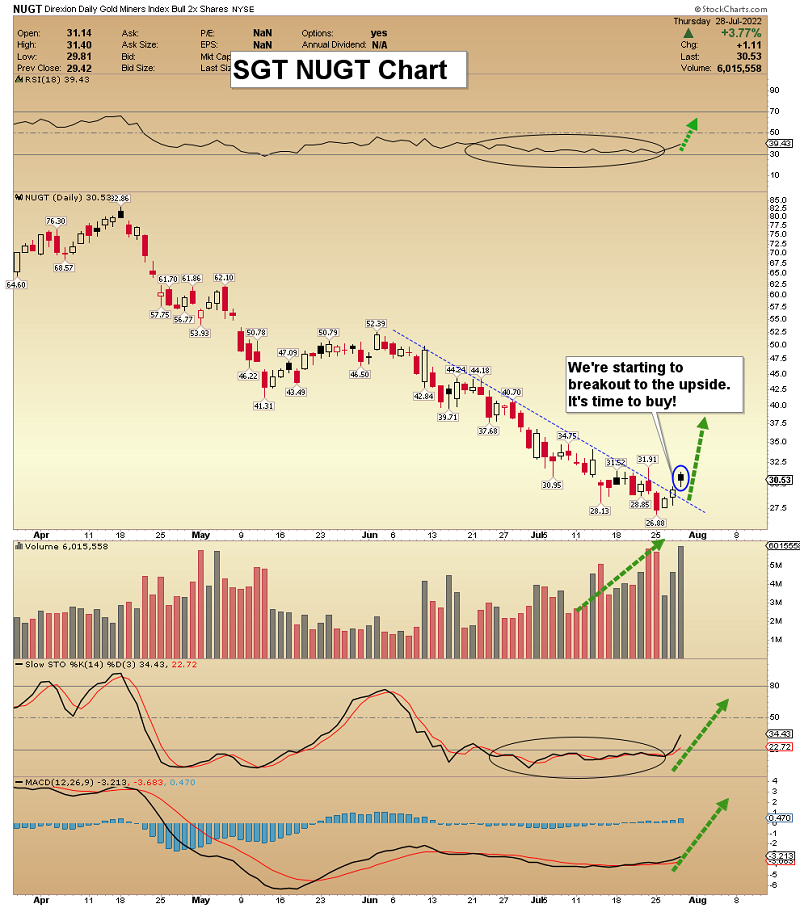
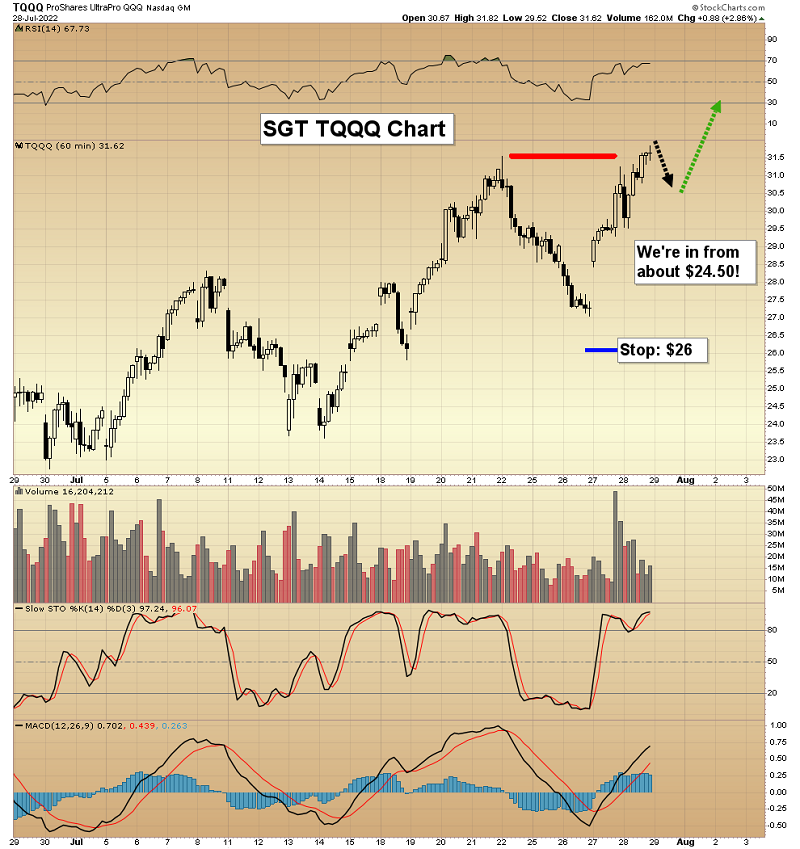
SGT is mostly leveraged ETFs trading, with alerts by email or text, and we’re on a roll! The service is a must-have for gold investors who want action. SGT at $99 a month is a good price, but with all this inflation, I'm offering a 14month SGT subscription for just $249! Please send me an email if you want the offer and I’ll get you onboard for the next hot trade. Thank-you!
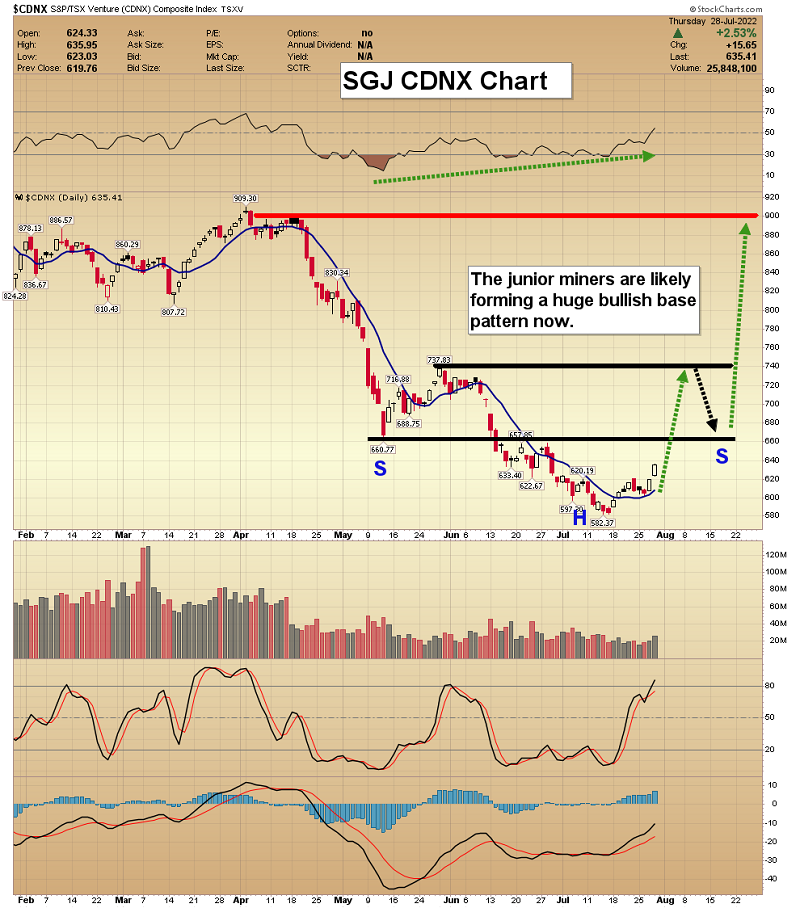
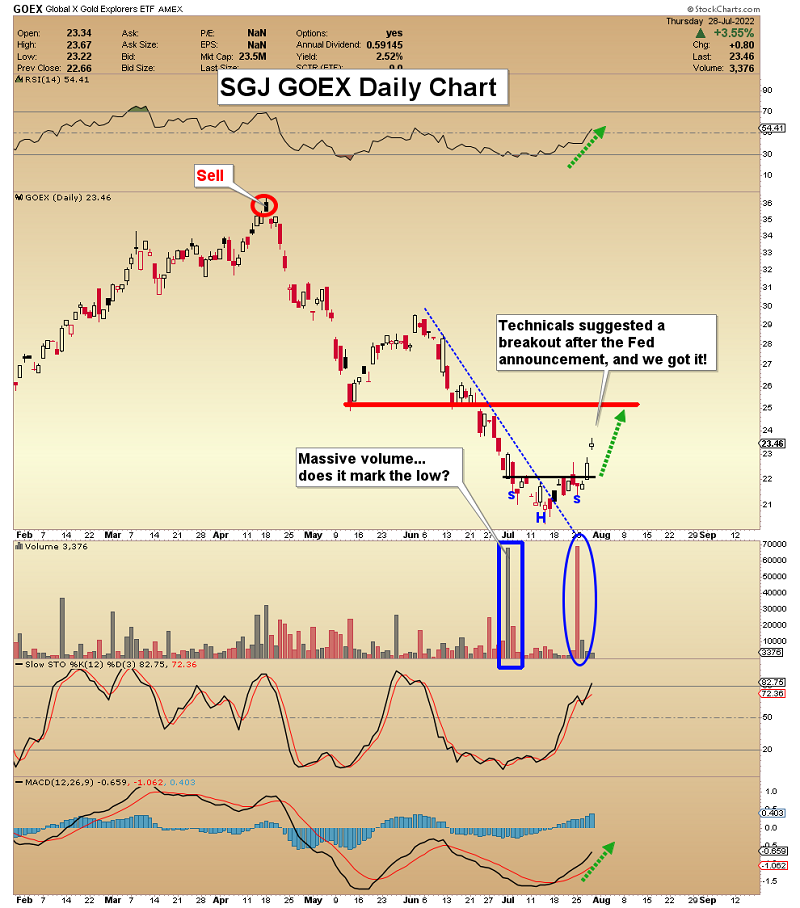
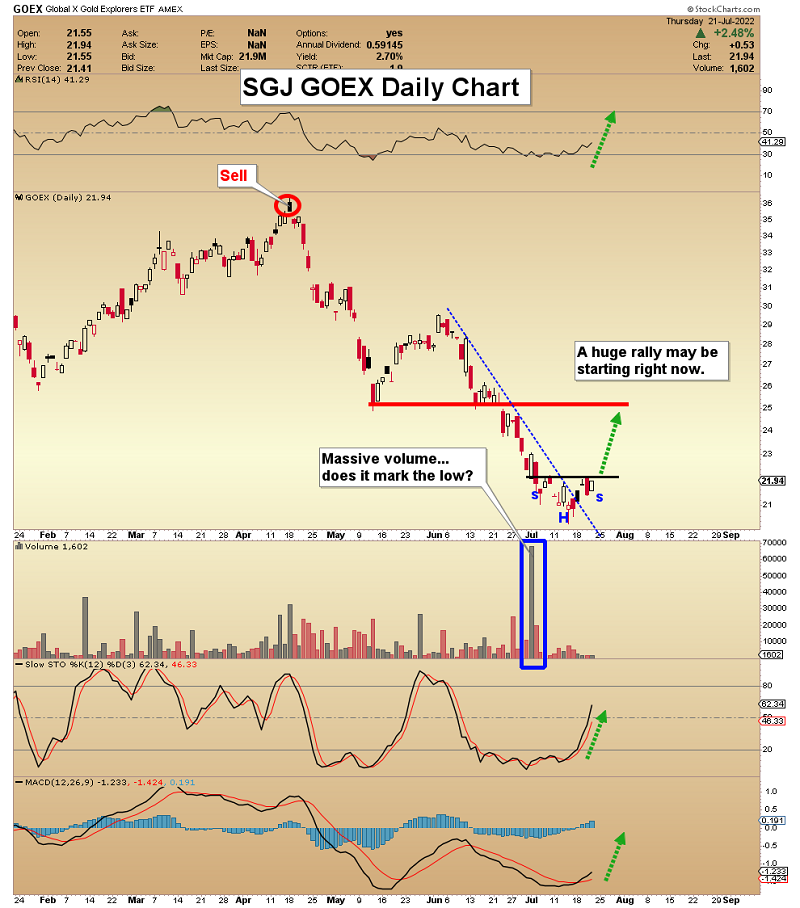
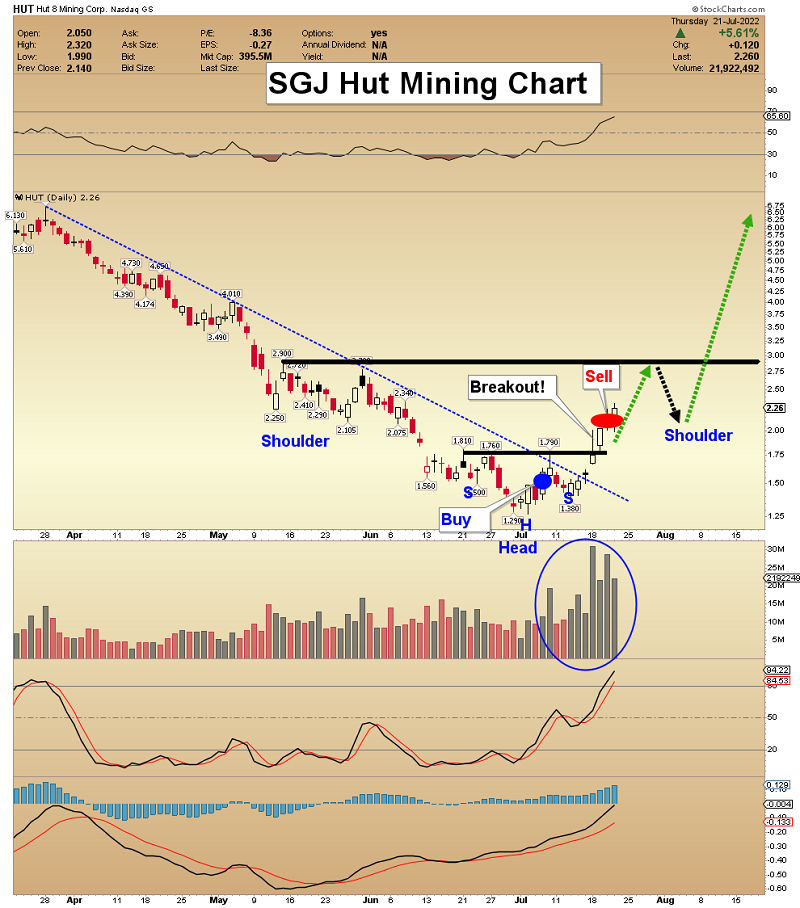
SGJ Key Charts, Signals, & Video Analysis
Read Full Story »»»
 DiscoverGold
COT - Commitments of Traders in Metals Futures Market Reports
By: Software North | July 29, 2022
Gold

Silver

Read Full Story »»»
DiscoverGold
Gold – Summer Rally Has Started
By: Florian Grummes | July 29, 2022
It’s been three and half tough months for gold and silver investors. Stock market and crypto investors have been suffering since November 2021 already, though. Now, after a bloodbath of almost 400 USD in the gold market, last week’s reversal looks promising. Gold – Summer rally has started.
Review
Gold prices reached an important high on March 8th, 2022, at around 2,070 USD and have since then slid into a brutal sell-off over the course of the last three and a half months. The final low of this wave down has been seen on Thursday, 21st of July, at 1,681 USD. Thus, gold has lost almost 400 USD or 18.8% in a rather short period of time.
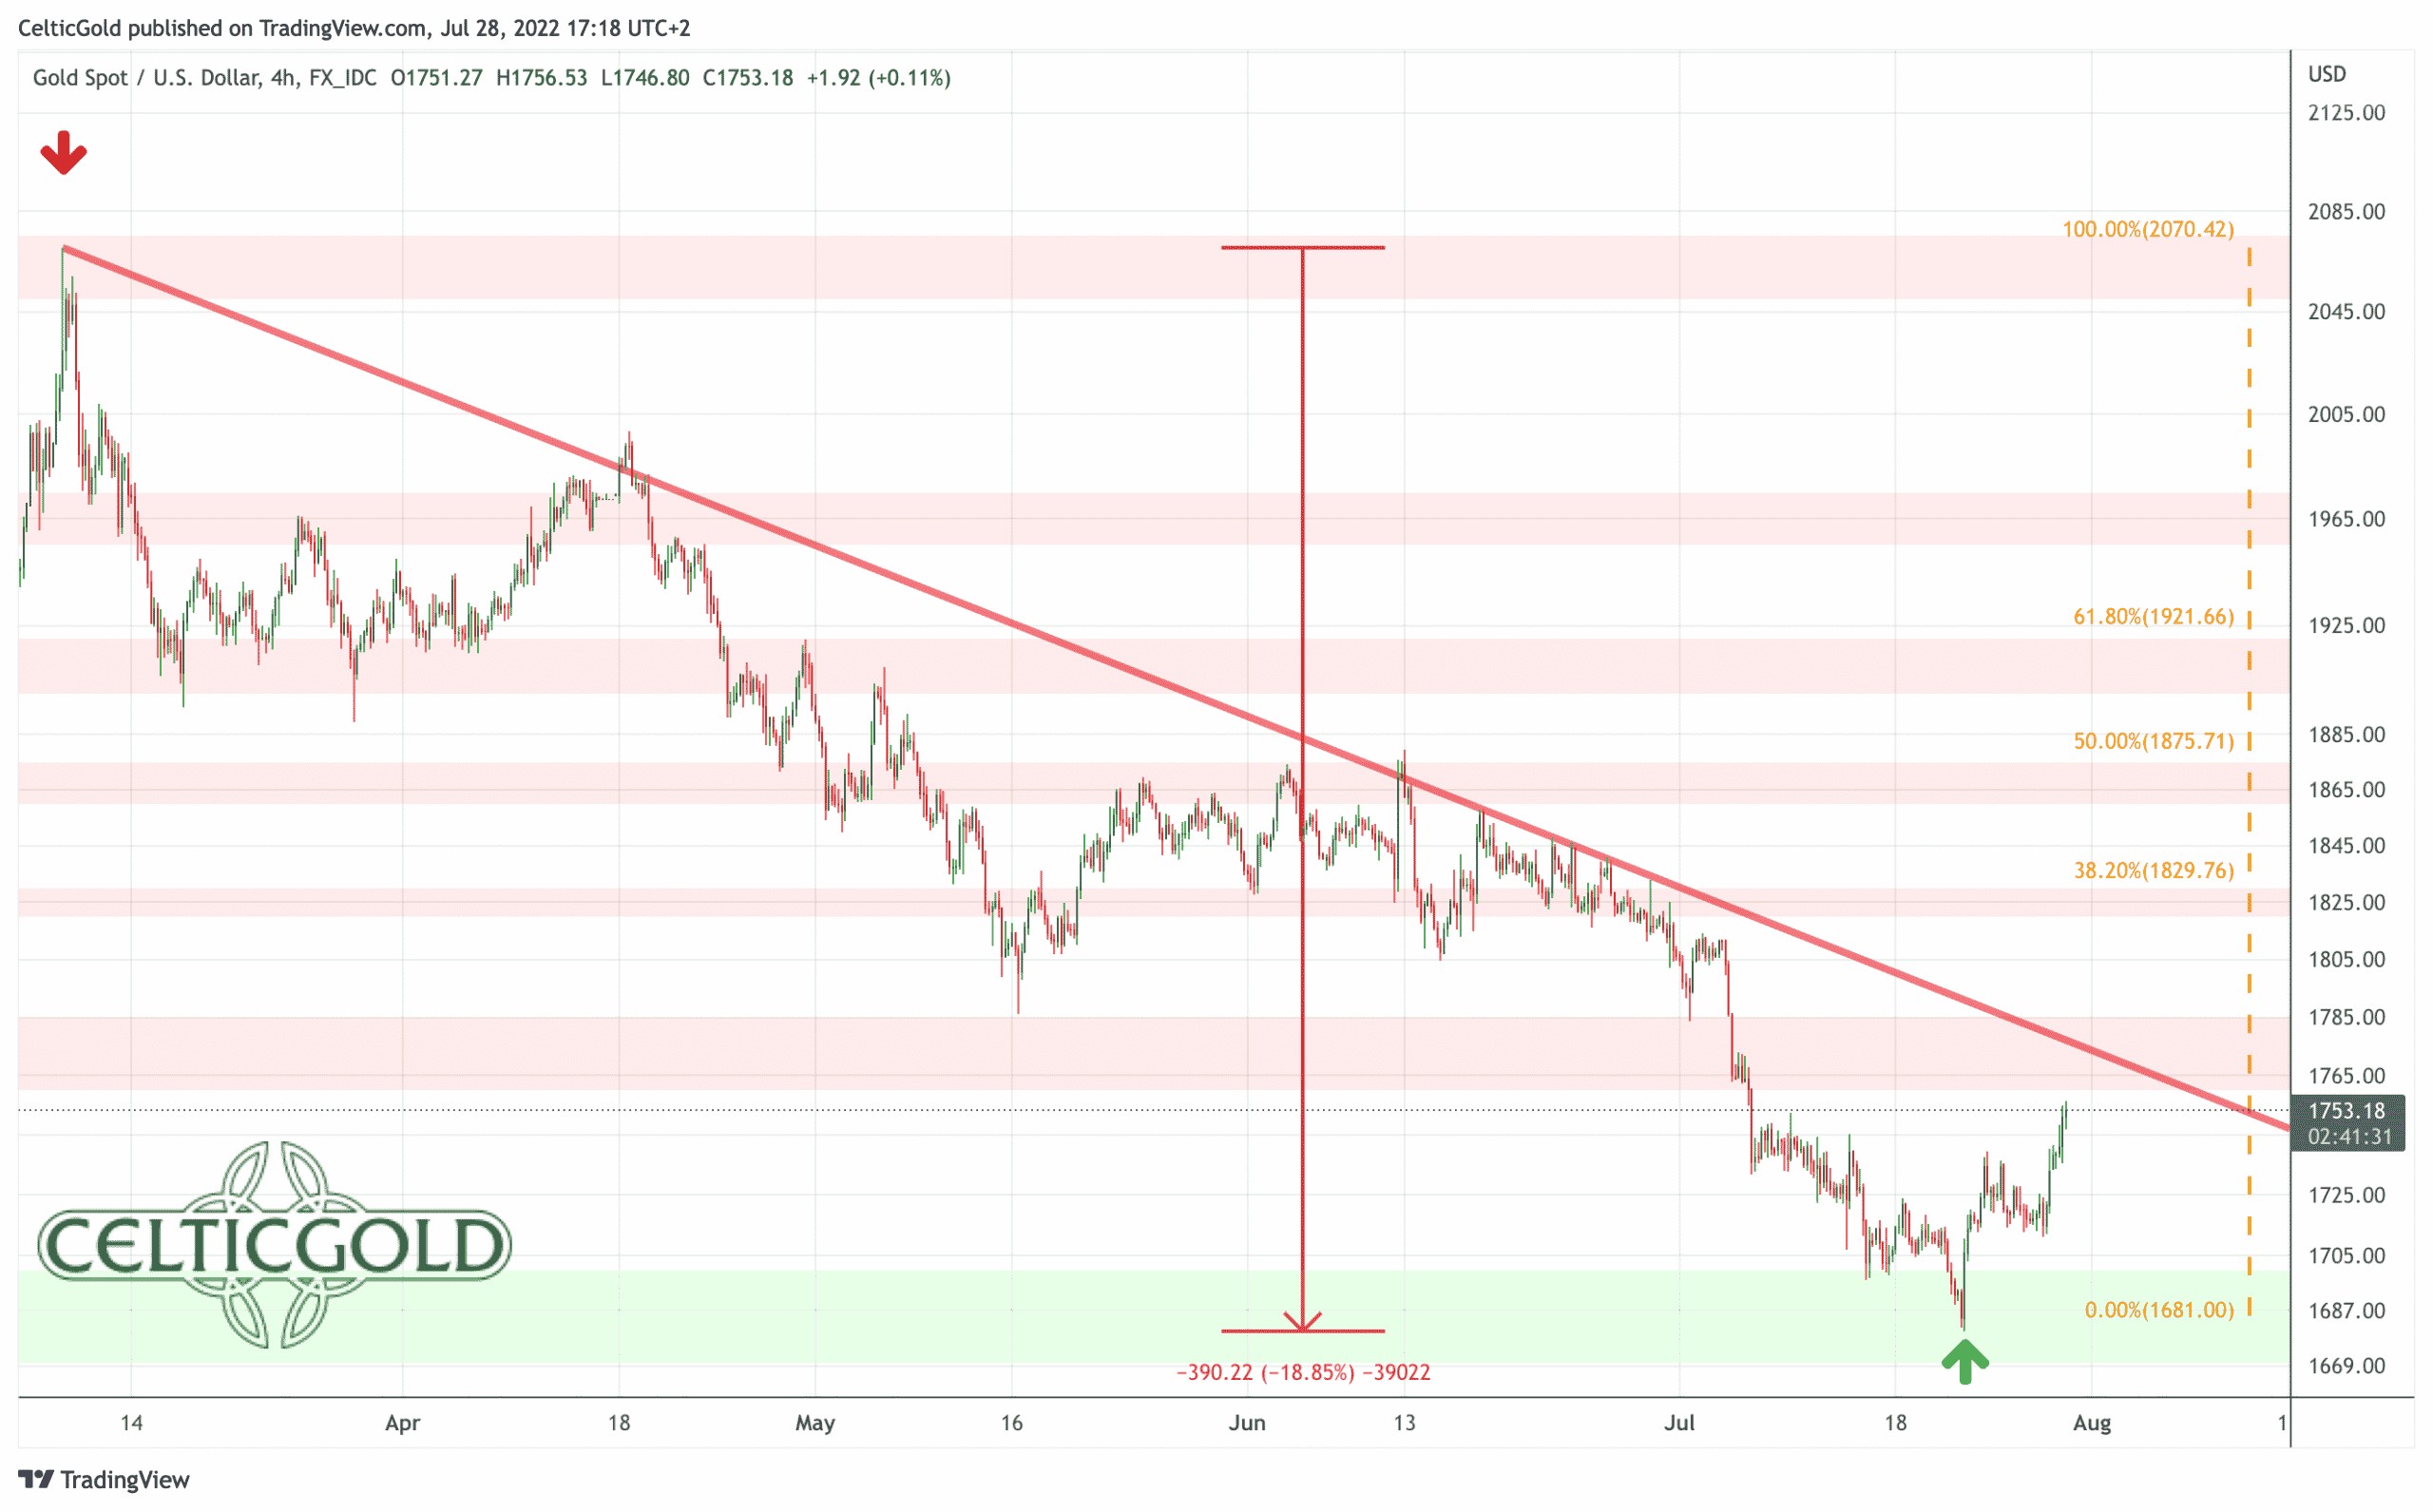
Gold in USD, 4-hour chart as of July 28th, 2022. Source: Tradingview
Besides the clearly overbought situation and the euphoric sentiment in March combined with the fact that precious metals are already within a correction since August 2020, the toxic mix of interest rate hikes & quantitative tightening of U.S. monetary policy, as well as high inflation data and collapsing stock & crypto markets, and thus a rampant recession, were primarily responsible for this selling pressure and the nasty downward spiral, which unfolded in the gold market. More and more investors plagued by the stock and crypto crash were thus forced to sell their physical precious metal holdings in order to access much needed liquidity.
The “summer doldrums” we had hoped for have therefore not materialized this year. Rather did gold opt for our alternative scenario, which was a further price slide. After all, however, gold was able to recover quite impulsively over the last week and touched 1,750 USD this morning. Hence, yesterday’s FOMC meeting seems to have amplified a wave of short covering in the gold market. This could very likely develop into the typical summer rally over the coming one to three months, at least.
Technical Analysis: Gold in US-Dollar
Weekly Chart – At the upper edge of the 4-year uptrend channel
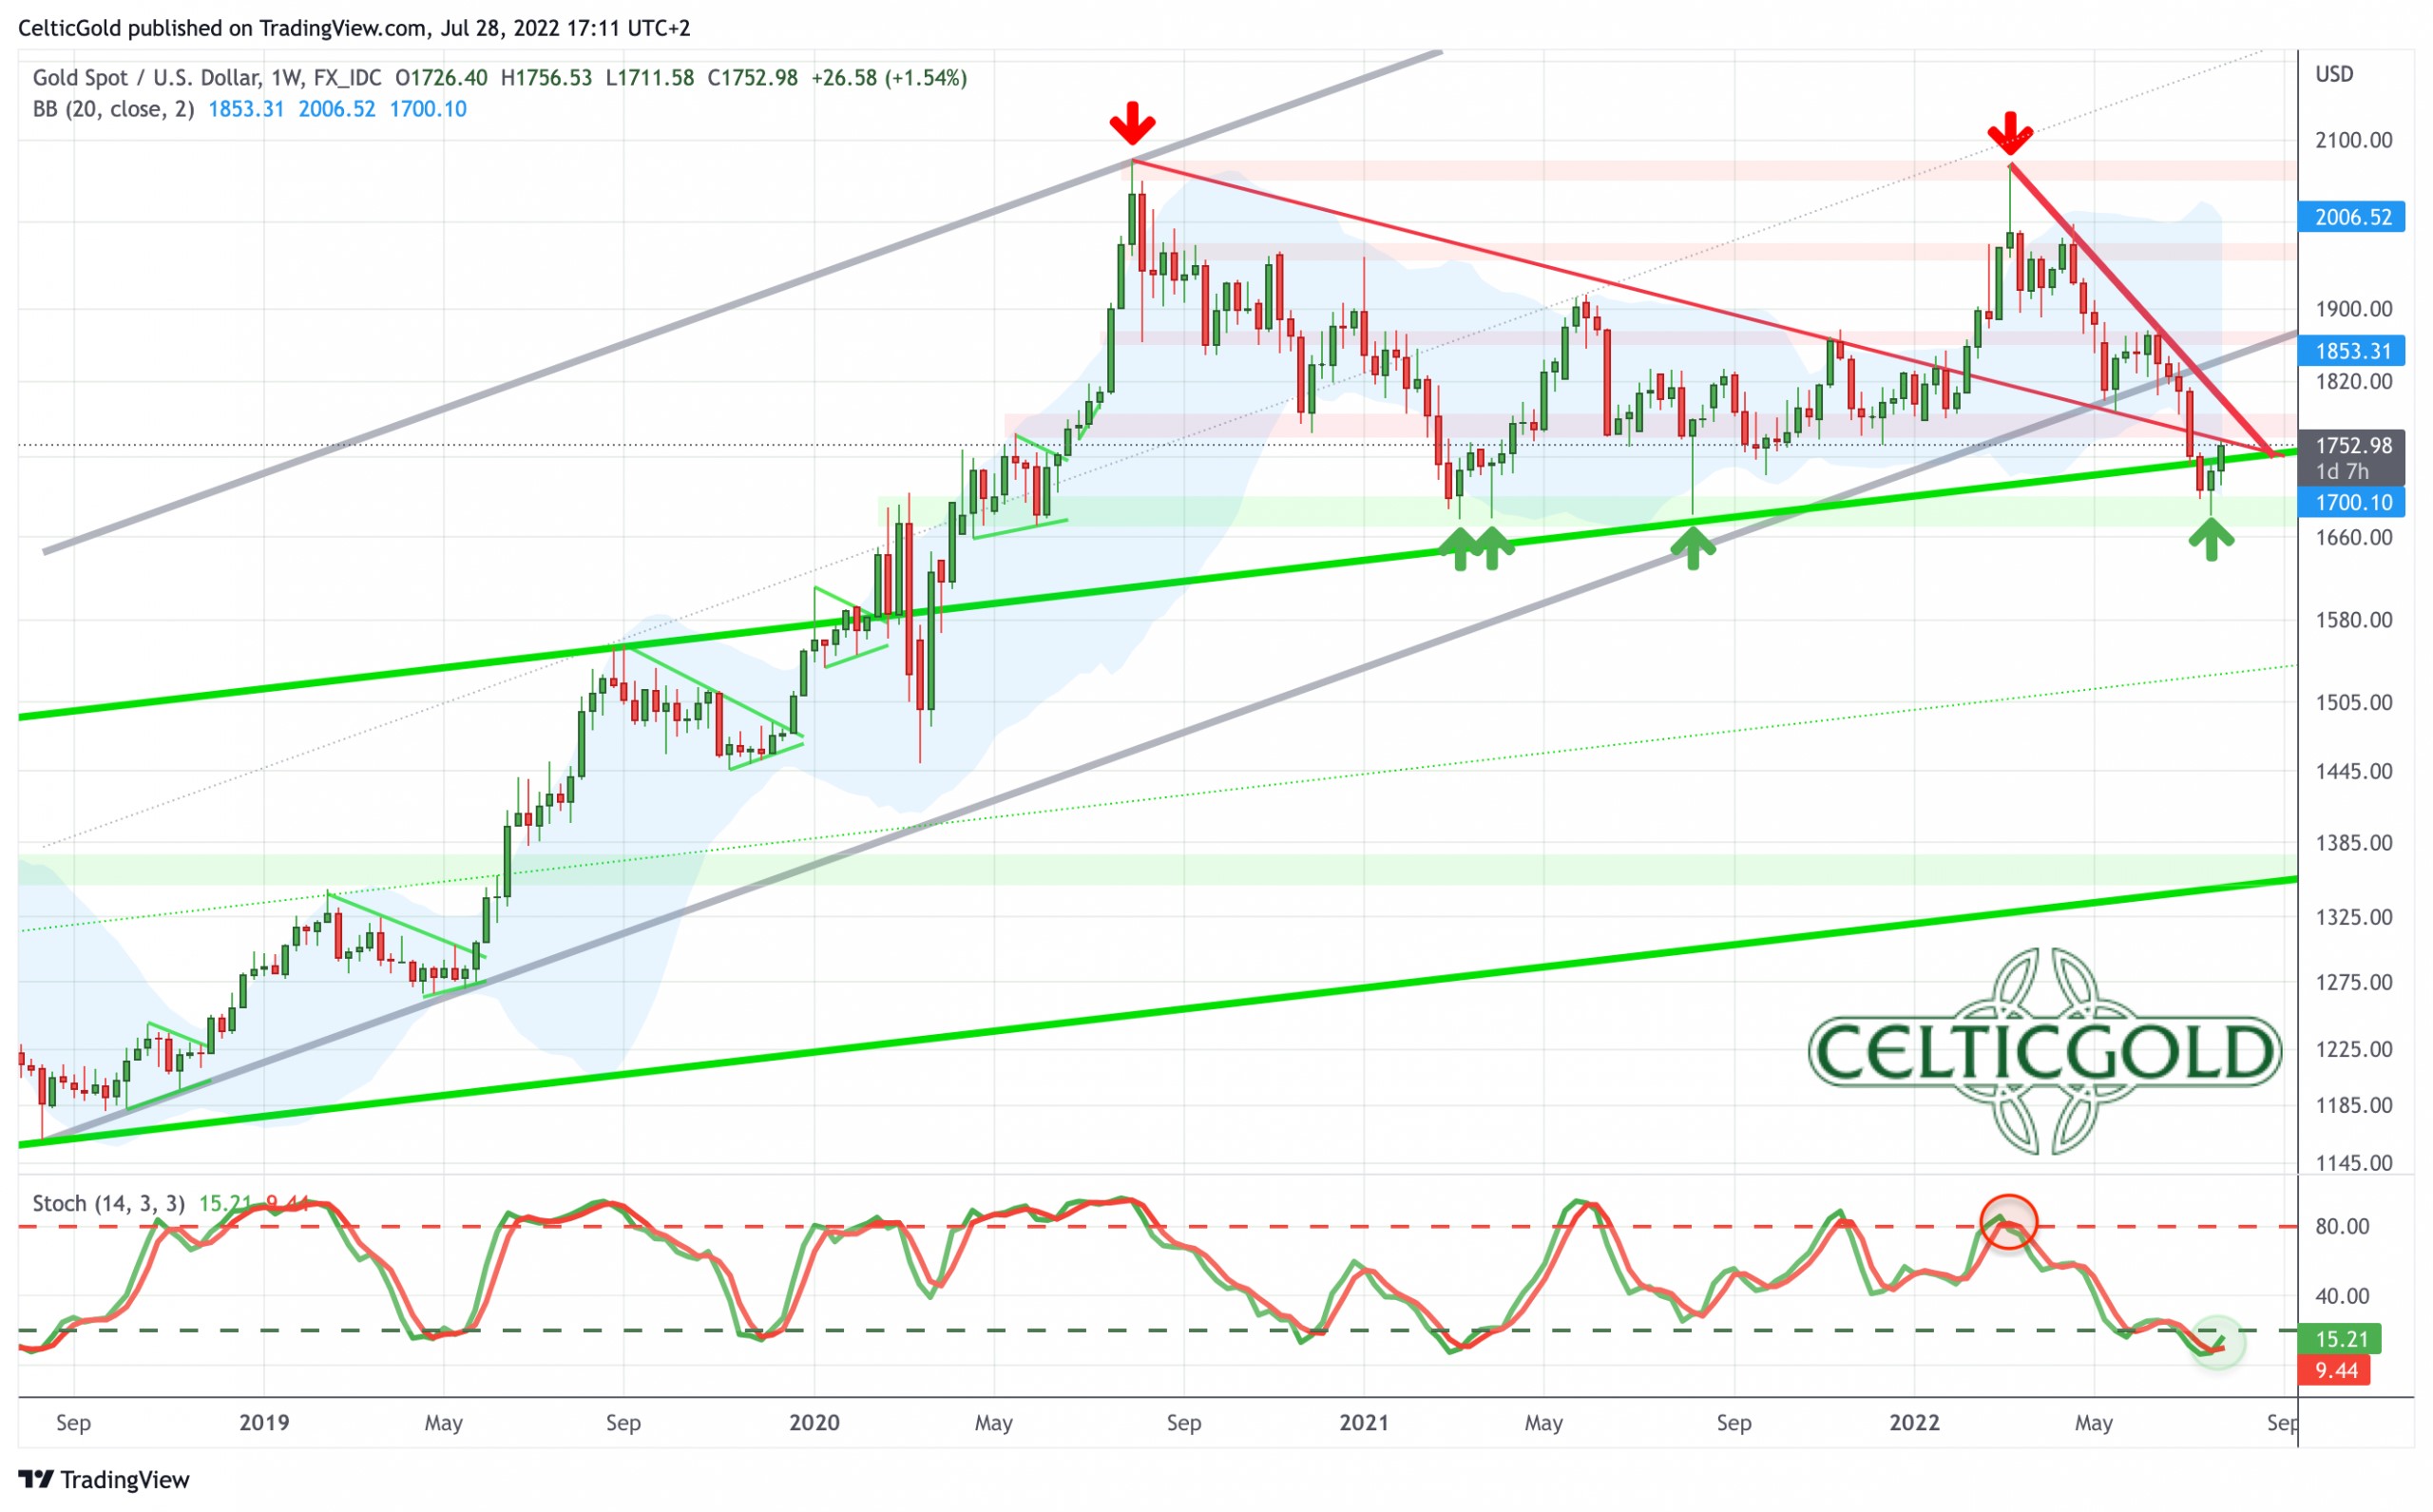
Gold in US-Dollars, weekly chart as of July 28th, 2022. Source: Tradingview
On the weekly chart, gold corrected mercilessly over the last three and a half months. Finally, prices even dropped slightly below the upper edge of the flat uptrend channel established since August 2018 (in green). Only here, at the triple bottom (1,678 USD) from last year, gold bulls managed to stabilize the price action. And judging from a candlestick perspective, those last two green candles signaling a reversal. On top, the strongly oversold stochastic oscillator looks pretty promising. The oscillator has a lot of room for a strong rally lasting several weeks to several months. However, there is no clear “buying signal” yet from the weekly oscillator.
Overall, the weekly chart is still in a downtrend. A clear trend reversal is not yet present. But a stabilization is definitely succeeding. If this is indeed a sustainable bottom, a bounce or even a strong recovery should make up quite some ground in the coming two to three months.
Daily Chart – Stochastic buy signal
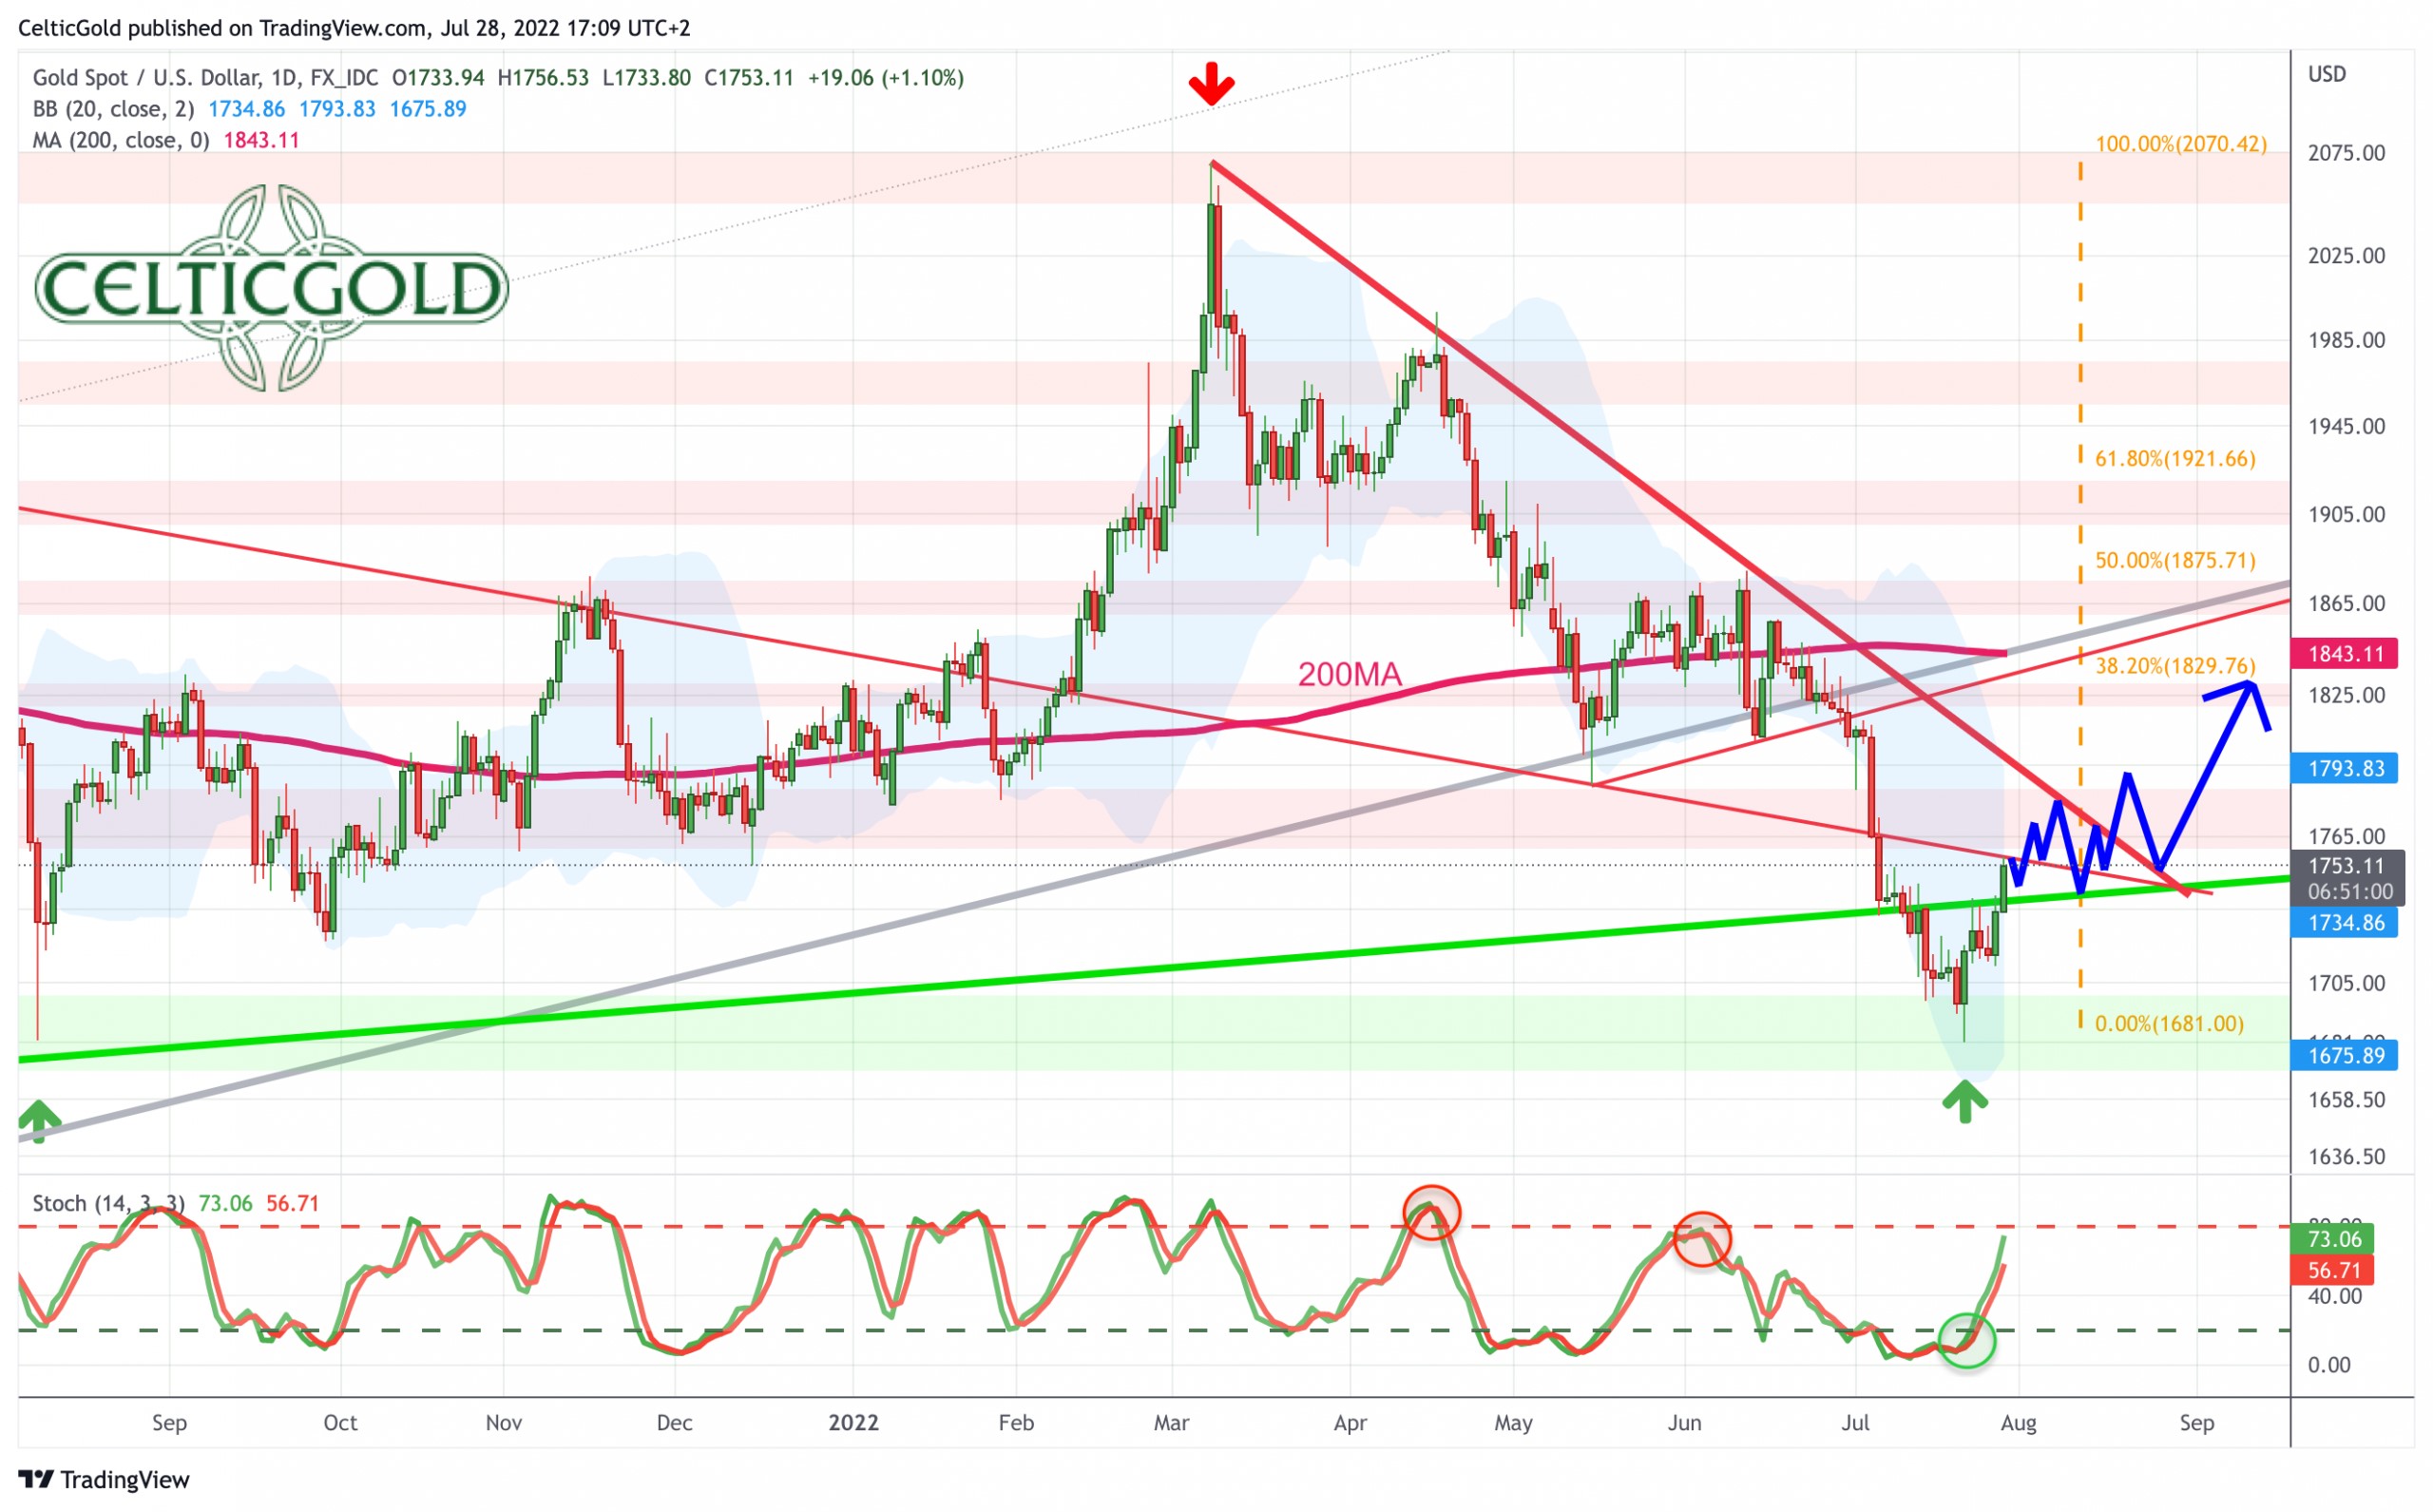
Gold in US-Dollars, daily chart as of July 28th, 2022. Source: Tradingview
On the daily chart, the trend reversal is clearly visible. Since the low at 1,681 USD, gold is up more than 70 USD. This confirms our assumption that the bottom is in, and that gold has started some form of a recovery, at least. Now, the falling 200-day moving average (1,842 USD) will act as magnet and likely attract prices towards approx. 1,830 USD. Exactly here would also wait the 38.2% retracement of the entire wave down since March, which typically represents the minimum target of a countertrend move.
All in all, the daily chart has been bullish for a week now and still provides a buy signal. However, the way up is paved with strong resistances. Around 1,755 to 1,760 USD, an older downtrend line is waiting. Here also begins the well-known resistance zone between 1,750 and 1,785 USD. Even stronger resistance is likely to come from the downtrend line of the last three and a half months (currently around 1,800 USD and falling fast). Below 1,700 USD and especially below 1,680 USD, however, the sell-off continues. In that unlikely case, prices around 1,625 USD must be expected.
Commitments of Traders for Gold – Summer rally has started
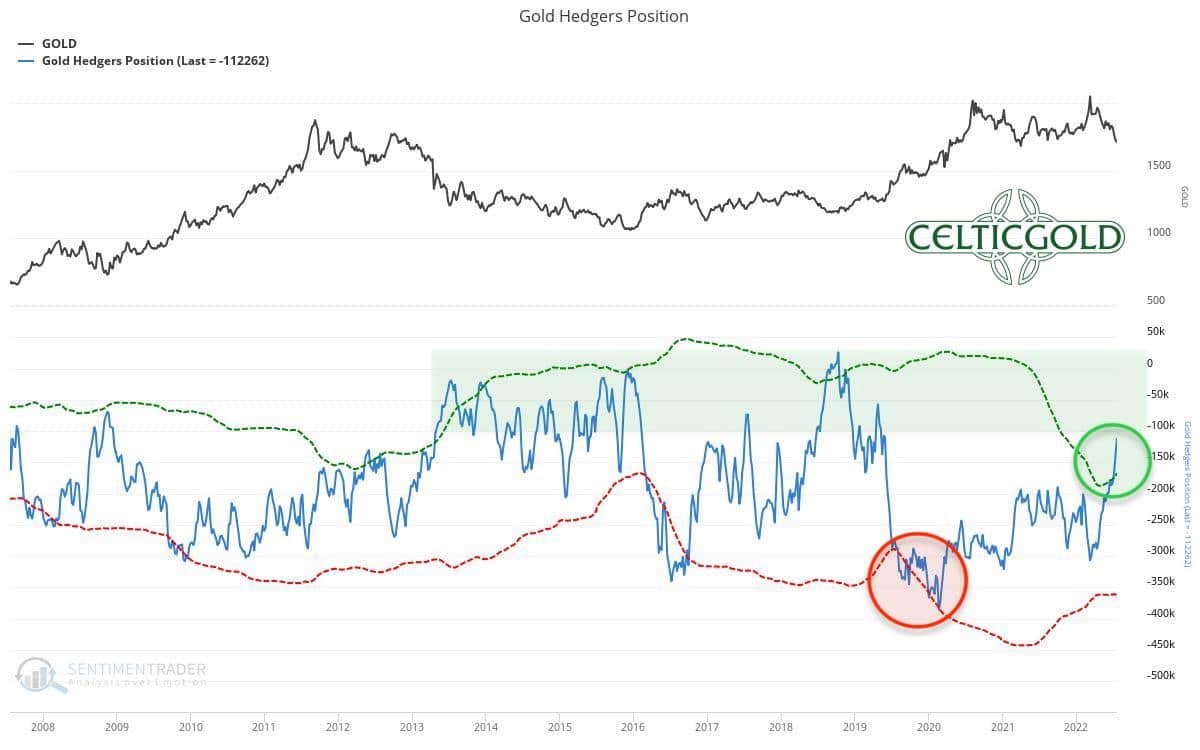
Commitments of Traders for Gold as of July 25th, 2022. Source: Sentimentrader
Over the last four weeks, the cumulative net short position of the commercial market participants has dropped by another 66,307 contracts to “only” 112,262 gold contracts sold short. The commercial net short position is thus just slightly above the threshold of 100,000 short contracts, at which one can speak of a positive or bullish gold CoT report. In other words, professional market participants see less and less need to hedge against a falling gold price but are increasingly switching to the buy side due to the low gold prices.
In summary, the CoT report can be classified as cautiously bullish.
Sentiment for Gold – Summer rally has started
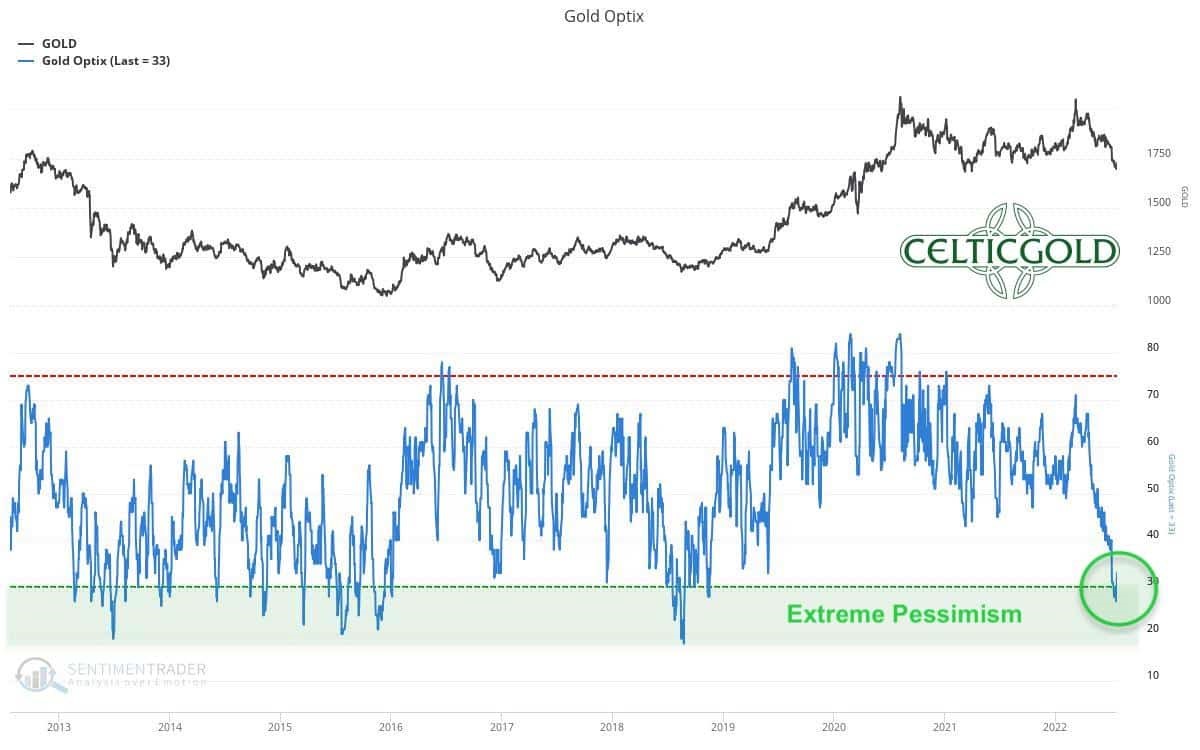
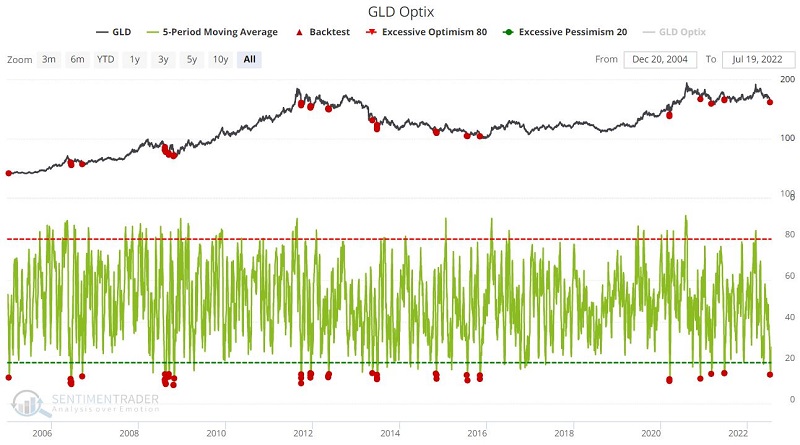
Sentiment Optix for Gold as of July 25th, 2022. Source: Sentimentrader
The latest sentiment data for gold measure an extremely pessimistic sentiment for the first time since the fall of 2018! For almost four years, patient gold bugs had to wait for this promising contrarian setup!
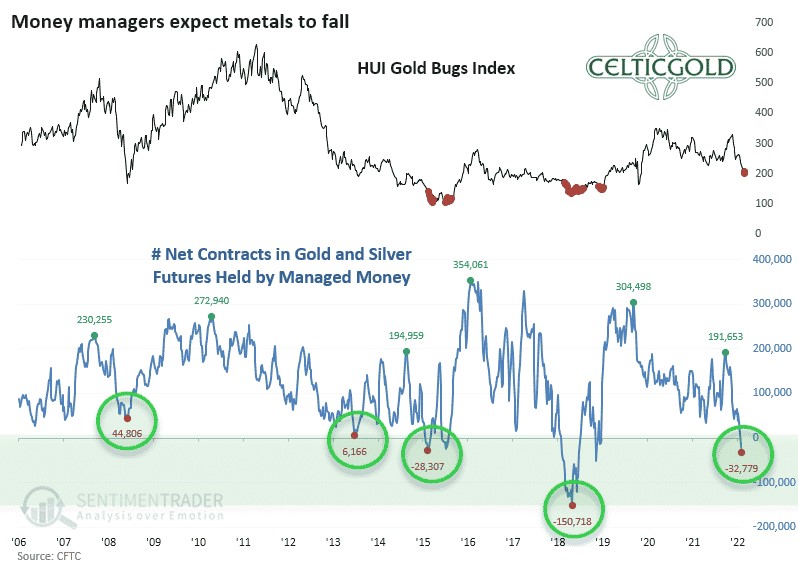
Gold & Silver future contracts held by managed money as of July 25th, 2022. Source: Sentimentrader
Not surprisingly, asset managers currently hold the lowest cumulative number of gold and silver futures contracts in their client portfolios since August 2018, and this is the second-lowest positioning in a long-term comparison over the past 16 years. This low allocation is evidence of a very negative expectation for precious metals prices.
Overall, the “sentiment traffic light” is now green and provides a contrarian buy signal!
Seasonality for Gold – Summer rally has started
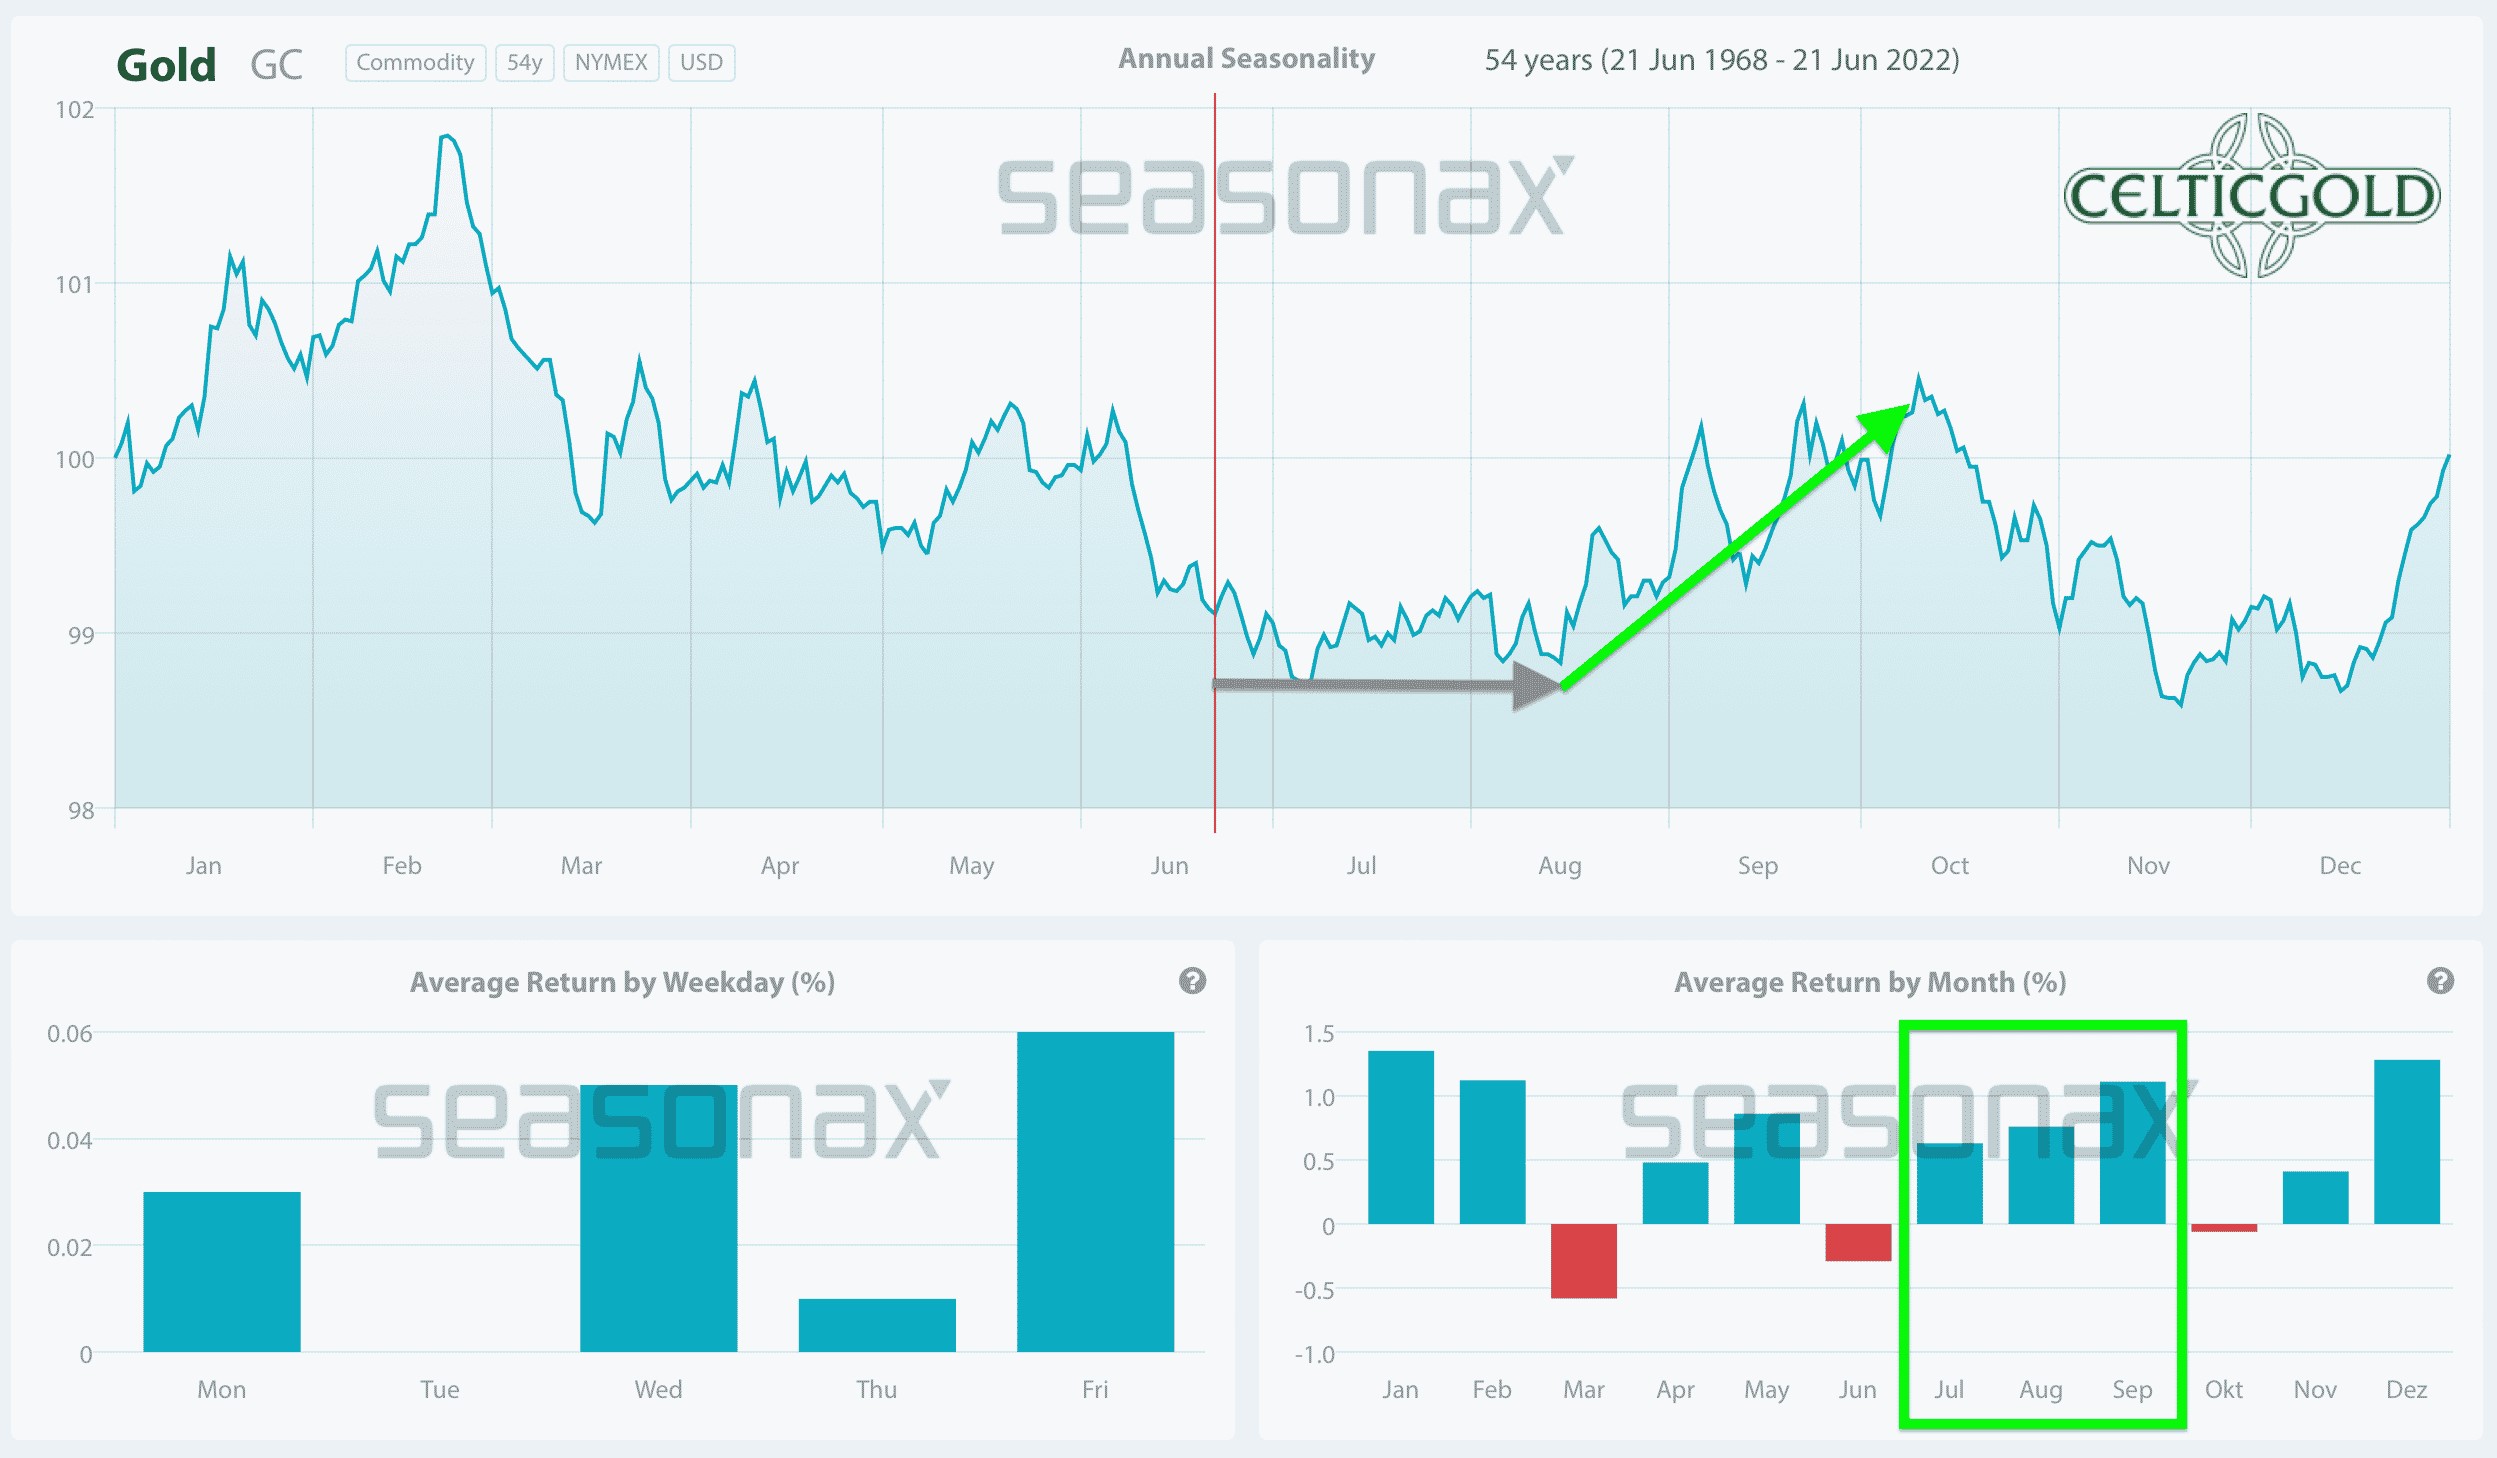
Seasonality for Gold over the last 53-years as of June 22nd, 2022. Source: Seasonax
From a seasonal perspective, gold is about to begin its typical summer rally, which statistically has usually caused precious metal prices to rise sharply in August and September over the past 54 years.
Seasonality for gold and silver is strongly bullish from now on until early October.
Macro update: Panic, recession, and stagflation
Ever since the financial crisis of 2008, all central banks have been gradually providing the banking system and thus the entire financial system with huge amounts of additional liquidity through low interest rates and “quantitative easing”. This was intended to counteract deflation. Since the beginning of the Corona crisis, the U.S. Federal Reserve had once again significantly increased its holdings of government and mortgage bonds by 120 billion USD every month. However, after central bankers had long refused to acknowledge the resulting sharp rise in inflation, there have been no excuses since the official inflation rate topped 6-8% since the beginning of this year.
Accordingly, the U.S. Federal Reserve had ended its bond purchases in March 2022 and announced its intention to reduce its balance sheet, which now weighs almost 9 trillion USD. Among other things, the monthly proceeds of up to 30 billion USD from maturing government bonds and up to 17.5 billion USD from maturing mortgage-backed securities were no longer to be reinvested from June 1st.
Whether central bankers will succeed in a measured and slow exit from their ultra-soft monetary policy is anyone’s guess. So far, at any rate, the financial markets have reacted like a “junkie in withdrawal” to the change in central bank policy over the past seven months.
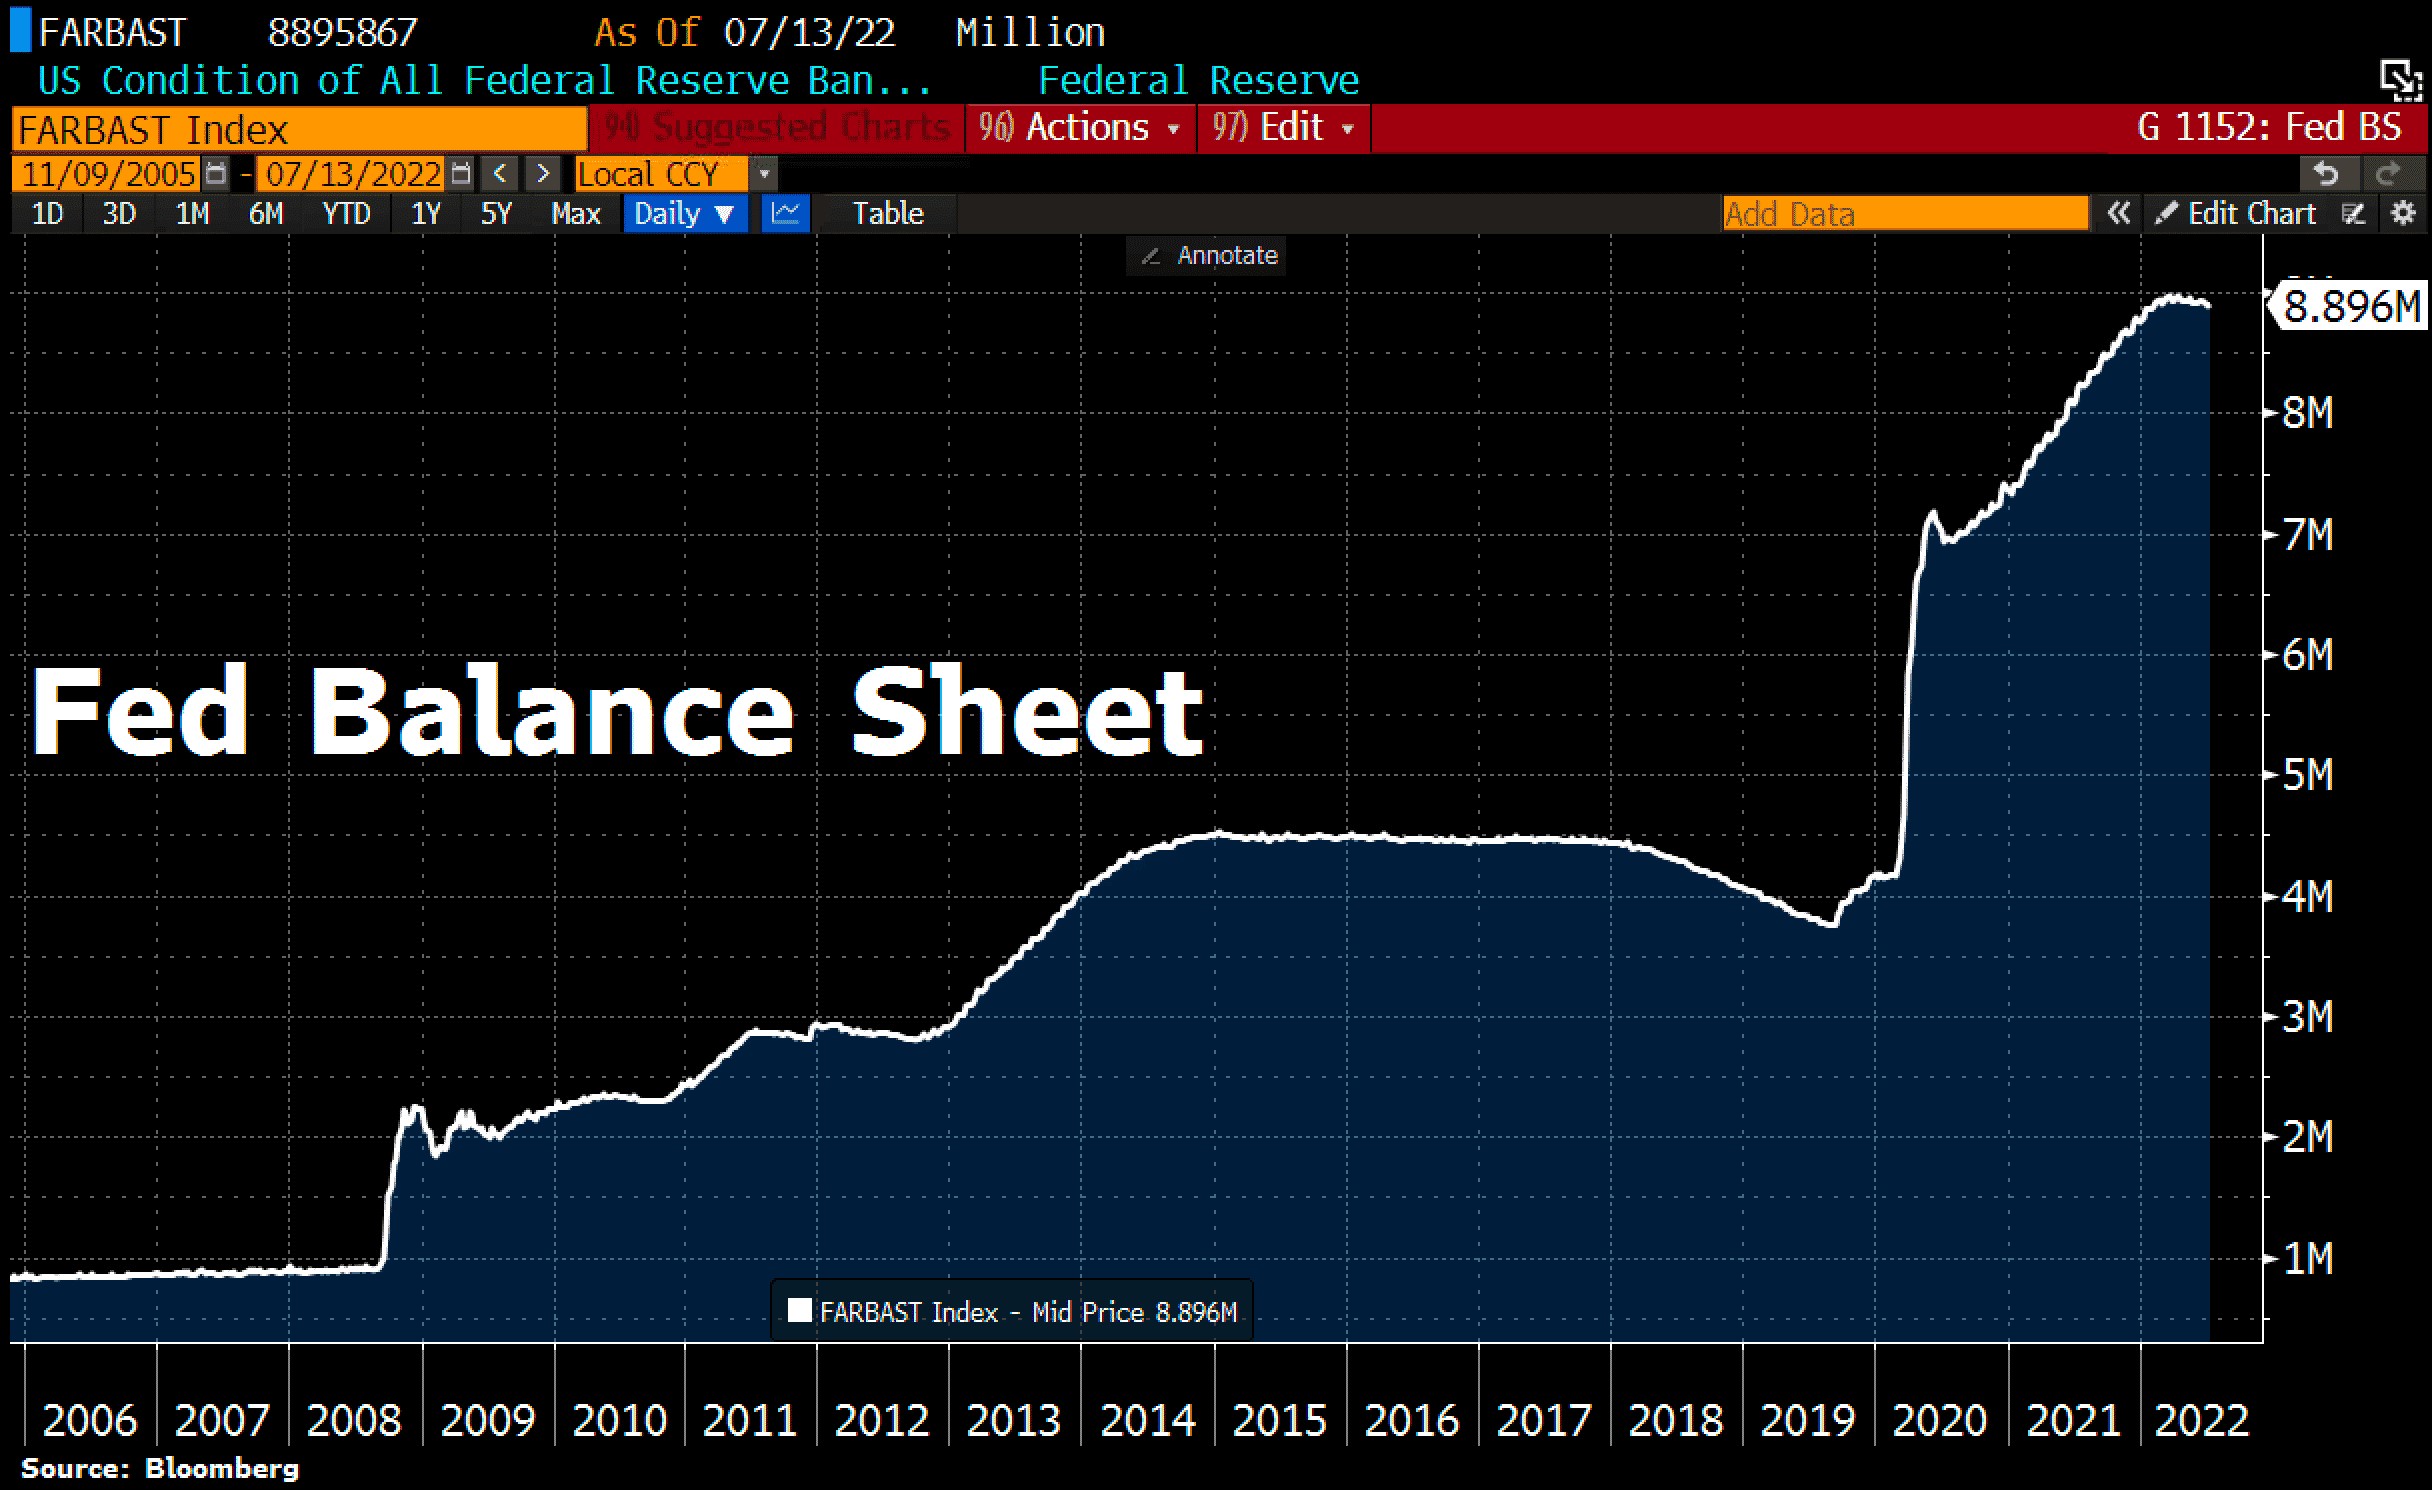
FED Balance Sheet Total as of July 13th , 2022, ©Holger Zschaepitz
According to the official data released as of July 13th, the Fed has therefore already stopped shrinking its balance sheet again, as total assets increased by 4 billion USD to 8.896 billion USD as of July 13th. The Fed’s balance sheet now represents 36.5% of U.S. GDP, compared to 82% for the ECB and 135% for the BoJ.
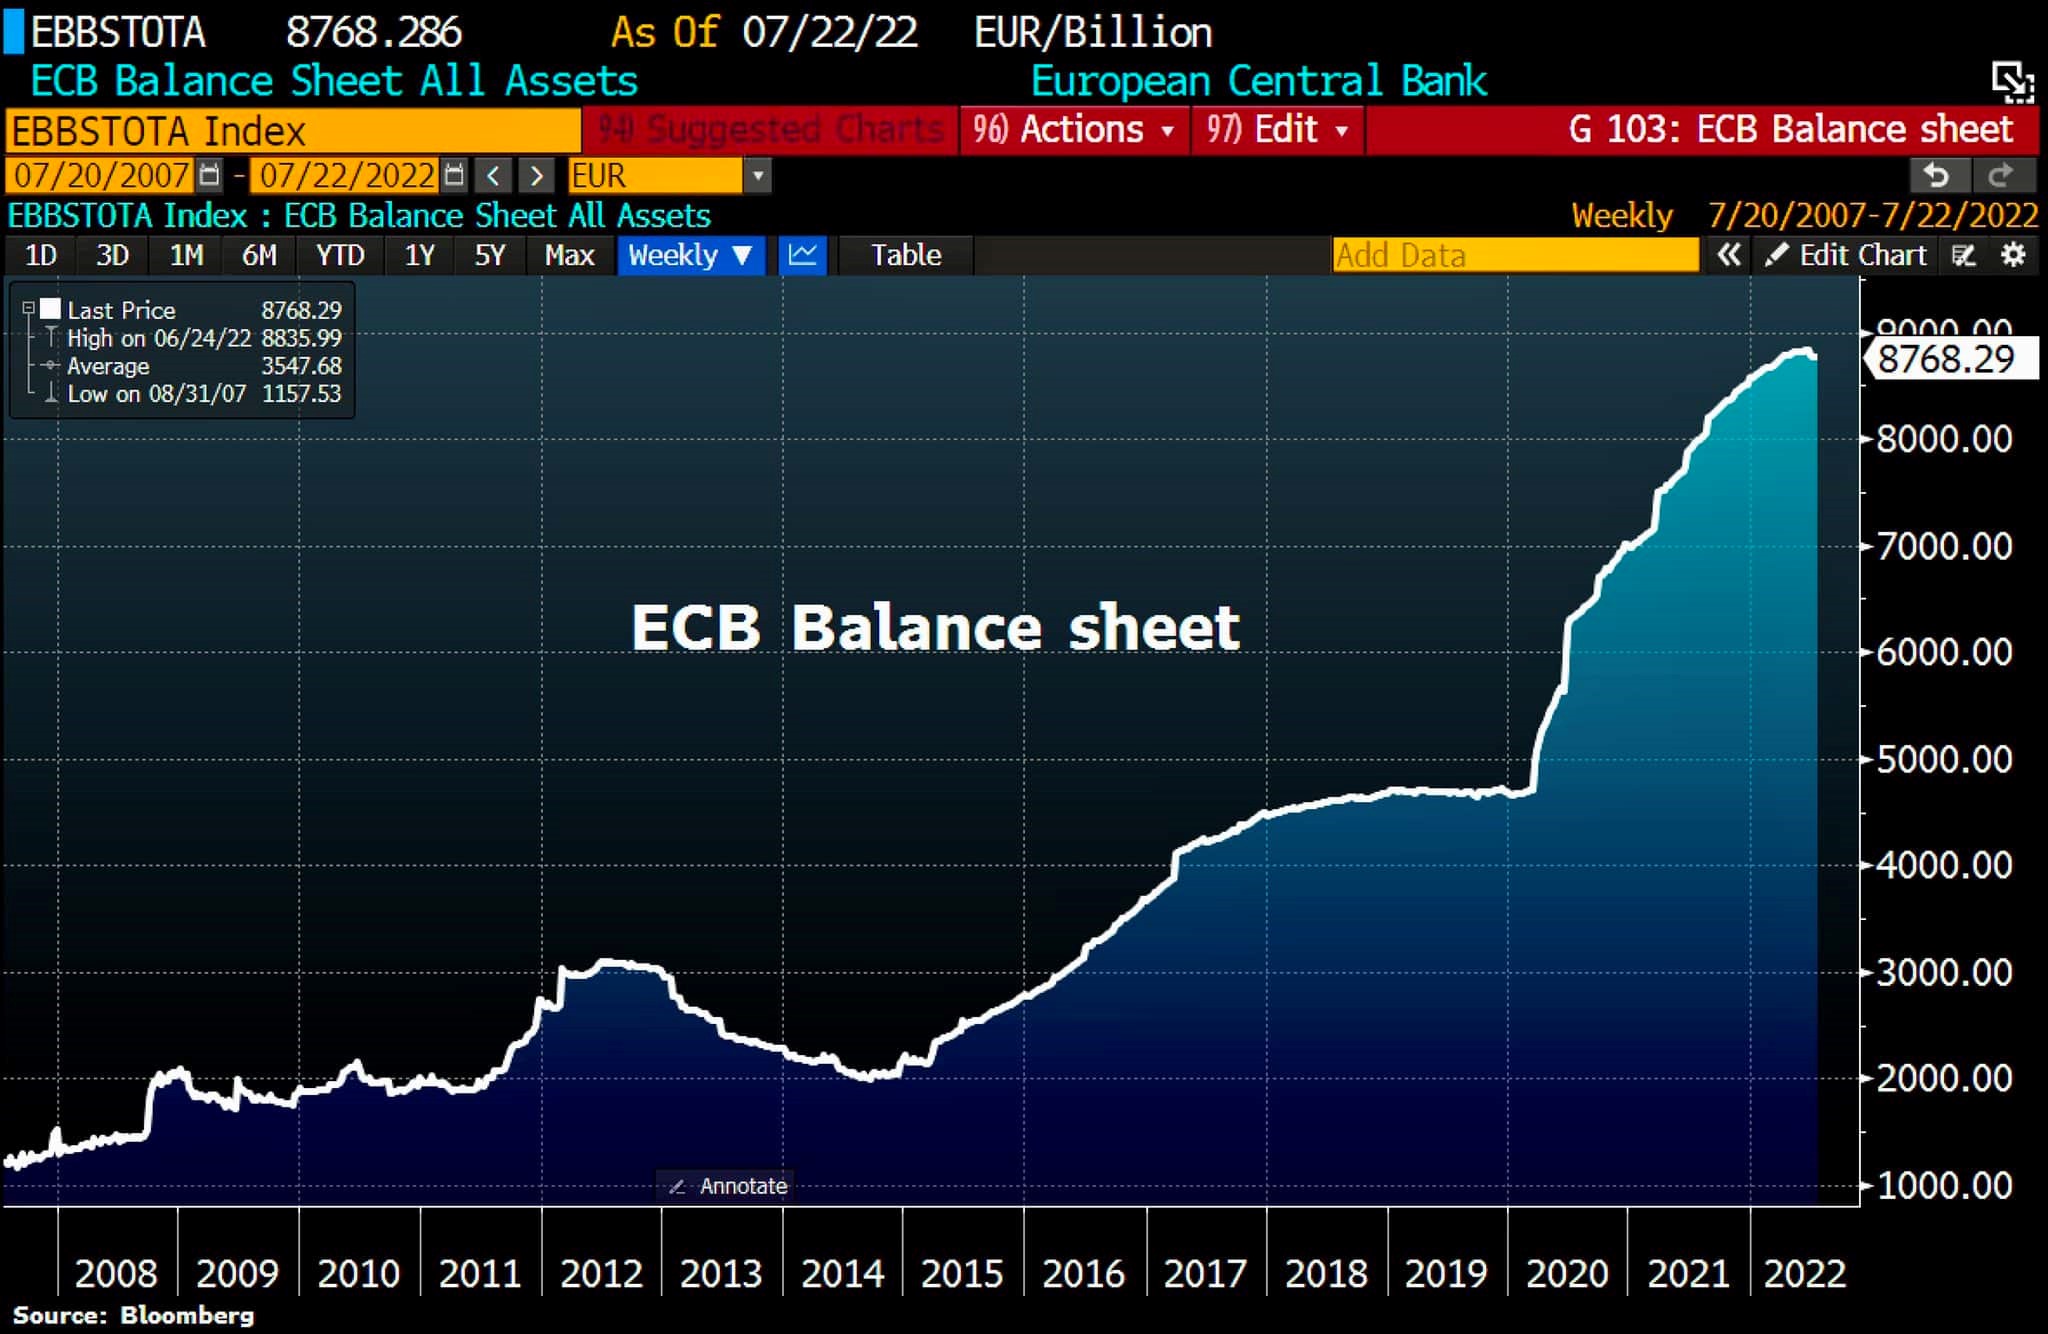
ECB Balance Sheet Total as of July 22nd , 2022, ©Holger Zschaepitz
And the ECB’s balance sheet has also grown again recently after three weeks of contraction. Total assets rose by 2.6 billion EUR last week to 8,769.3 billion EUR. This means that the ECB balance sheet is still close to its all-time high and is now equivalent to 82% of eurozone GDP.
In any case, the damage to the global economy has already been done and will likely worsen in the coming months, as the recession increasingly reaches the real economy after more than seven months of falling stock prices. Not only have valuations of almost all companies dropped significantly, but layoffs are on the rise and pay raises, bonuses and job offers are being canceled. In addition, start-ups are finding it very difficult, if at all, to obtain financing.
Real estate markets have also long since peaked, with asking prices already falling and demand for mortgages lower than at any time since 2000. Home sales are currently declining most sharply for the cheapest properties, as potential buyers here are more price-conscious and generally more affected by changes in interest rates. But luxury home sales also fell nearly 18% between February and May.
I.e. the Fed will hardly be able to raise interest rates any further into the fall without completely destroying the economy. But at the same time, inflation will remain elevated, so the stagflationary environment will continue to tighten. These are excellent conditions for a rising gold price. However, commodities and precious metals typically come under significant pressure in the early stages of an economic slowdown. This is exactly what has happened now. At the latest, when the U.S. Federal Reserve has to return to a loose stance as well as quantitative easing and interest rate cuts next year, gold prices will very likely break out to new all-time highs.
Conclusion: Gold – Summer rally has started
With a buy signal on the daily chart, a bombed-out sentiment and the very favorable seasonal component, there are currently three strong arguments on the table for an imminent summer rally in the gold market. The completely oversold weekly chart and the quite constructive CoT report also support this thesis. However, the financial markets have been in a contraction à la 2008 for months, which has dragged down all asset classes. Calling a bottom early on can be dangerous in this environment.
Nevertheless, the chances of a summer recovery to around 1,830 USD are very good. Higher recovery targets are also conceivable. In the short term it is important that the bottom is confirmed, and that gold can continue its recovery towards approx. 1,770 to 1,775 USD, where a breather for one to three weeks can be expected.
Read Full Story »»»
DiscoverGold
Interest Rates Rose, But The Result Is Bullish For The GDXJ
By: P. Radomski | July 28, 2022
As expected, the Fed raised interest rates again—and Powell's dovish stance was a gift to gold miners. The USD fell, giving the GDXJ more room to rise.
Powell Strikes Again
With all eyes on Fed Chairman Jerome Powell on Jul. 27, the central bank chief took his perpetually dovish rhetoric to a new 2022 high. Moreover, while the FOMC raised interest rates by 75 basis points – which was widely expected – Powell was Mr. Friendly. He said:
“While another unusually large increase could be appropriate at our next meeting that is a decision that will depend on the data we get between now and then (...). As the stance of monetary policy tightens further, it will likely become appropriate to slow the pace of increases while we assess how our cumulative policy adjustments are affecting the economy and inflation.”
He added:
"Recent indicators of spending and production have softened. Nonetheless, job gains have been robust in recent months, and the unemployment rate has remained low."
Thus, while Powell reiterated comments like ‘rate hikes will continue’ and ‘we’re dedicated to achieving our 2% inflation goal,’ he continued to demonstrate his lack of inflation understanding. For example, he noted that “the public doesn’t distinguish between headline and core inflation,” and that a sustained period of supply shocks caused by bottlenecks and the pandemic “can start to undermine and work on de-anchoring inflation expectations.”
Therefore, he still assumes that inflation is mainly a supply-side phenomenon and that the Fed has to balance both sides of the equation delicately. However, while his uniformed assessment will likely be his undoing, the rhetoric is bullish for our GDXJ ETF long position.
Please see below:
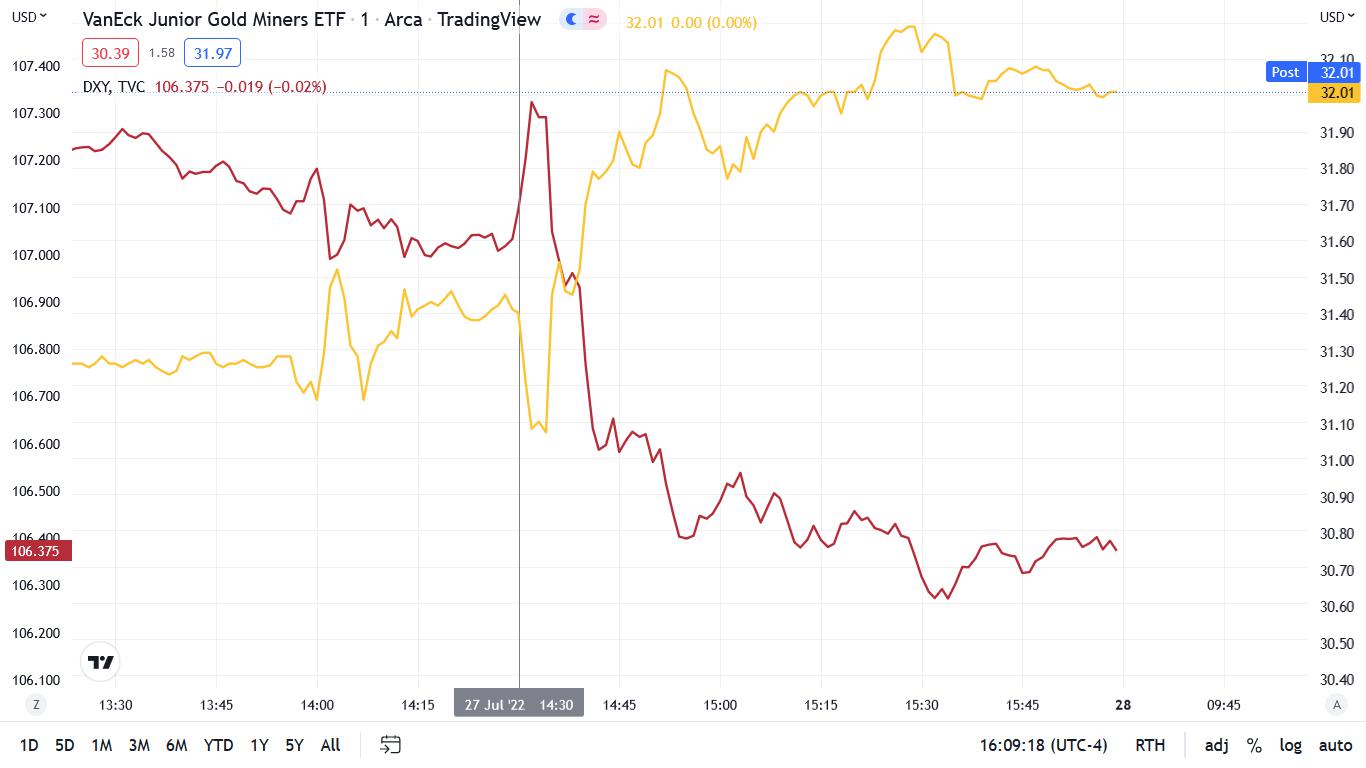
To explain, the gold line above tracks the one-minute movement of the GDXJ ETF, while the red line above tracks the one-minute movement of the USD Index. If you analyze the vertical gray line, you can see that volatility struck when Powell began his press conference at 2:30 p.m. ET.
Moreover, with his dovish disposition sinking the dollar basket and uplifting the junior miners, the price action unfolded as expected. To explain, I wrote before the opening:
With Powell taking center stage today, intraday volatility may be amplified. However, with risk assets often rallying during Powell’s pressers, another re-enactment would help our long position. Moreover, if he decides to talk down the USD Index and U.S. Treasury yields, it would only brighten the GDXJ ETF’s short-term outlook. As such, while unanchored inflation should shift sentiment over the medium term, we still expect higher prices in the days ahead.
To that point, with Powell making it a trifecta and also talking down U.S. Treasury yields, the central bank chief made it his mission to loosen financial conditions.
Please see below:
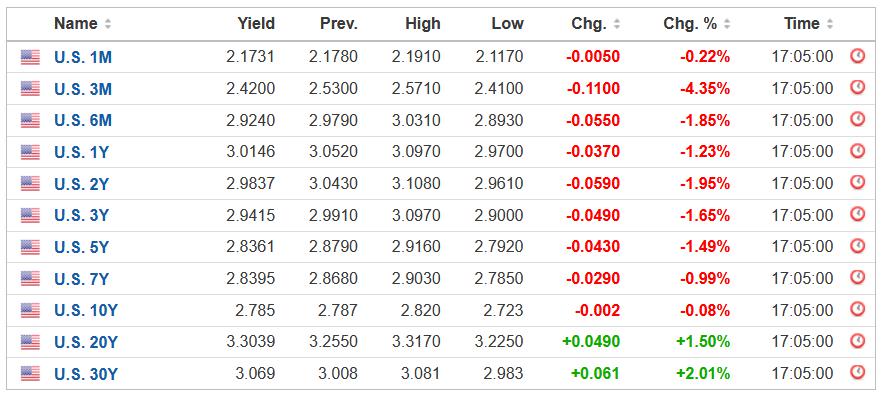
Source: Investing.com
Thus, while Powell’s monetary missteps have been on display for 24+ months, he continues to repeat the same blunders. However, with the old Wall Street adage of ‘take what the market gives you’ proving prescient on Jul. 27, we don’t mind being long the GDXJ ETF and profiting from the short-term sugar high. Therefore, we expect the junior miners’ uprising to continue in the days ahead.
In contrast, with Powell’s preference for patience poised to prove extremely costly over the medium term, we’ll be careful not to overstay our welcome.
Powell’s Freight Train to Ruin
While Powell’s dovish rhetoric was met with applause on Jul. 27, his willingness to push up asset prices and loosen financial conditions is like offering needles to drug addicts. In a nutshell: he provides what they want, not what they need. Therefore, while sentiment moves markets and the current environment is bullish for the GDXJ ETF, the medium-term consequences should be dire.
For example, I’ve noted how billionaire hedge fund manager Bill Ackman aligns with our way of thinking about inflation. However, with our view in the extreme minority, the consensus sees things overwhelmingly differently. Moreover, Ackman was spot on when he wrote on Jul. 26 that “the biggest risk to the U.S. economy is not the Fed raising rates. It is inflation.”
Furthermore, while he referenced the sharp drop in U.S. Treasury yields, the drop in investment grade and high yield credit spreads, and the rise in stock prices, (add the USD Index decline, though Ackman didn’t mention that), he noted prior to the FOMC release on Jul. 27 that “financial conditions have eased materially, which has made the inflation problem worse.”
He added:
“What I don’t understand is why Powell is reluctant to say that the Fed will stop inflation in its tracks by raising rates and keeping them as high as they need to be for as long as they need to be until we have durable evidence (not a few months of lower inflation) that inflation has been licked. That is what it is going to take to kill off inflation and preserve the economy and the equity markets for the long term.”
Thus, while Ackman should know that Powell always leans dovish during his press conferences, the six-to-12-month assessment should prove prescient. However, since opponents of the thesis believe that “the market is smarter,” the consensus (for some reason) opines that rampant inflation is preferable to a rate-hike-induced recession...
* * *
Read Full Story »»»
DiscoverGold
Has Chan changed his indicator?
$GDX - The lower low on Monday turned out to be the final low of this daily cycle
By: CyclesFan | July 28, 2022
• $GDX - The lower low on Monday turned out to be the final low of this daily cycle which bottomed on day 49 assuming it closes above the 10 day MA today. The dovish Powell provided the necessary trigger to confirm that bottom yesterday.

Read Full Story »»»
DiscoverGold
GDX Daily. #GDX aggressive falling wedge to watch
By: ReciKnows | July 28, 2022
• $GDX Daily. #GDX aggressive falling wedge to watch.

Read Full Story »»»
DiscoverGold
if monetary reset subject comes up again, i decided to calculate the true value of gold, and in this plan that BRICS is planning. for all things equal they would have to value gold at $50,000 us dollars/oz. whatever that comes to in new currency i dont know.
I can’t stop watching it, little bots hitting after very large buys. The Fed is whipping them good to bother. Bots only work after real trade volume slows. Too funny.
Wow the minute I said it the bots dropped price from 1726 to 1719 in 4 minutes. They must be showing their maker that see, we can drop it anytime, even with the worst Fed, treasurer, and president of all time messing everything up.
75 point hike, still clueless er I mean cautious. No solid response by gold that and self respecting bot can’t control.
Unless something changes today, the month of July in 2022 may turn out to be the worst July ever for gold. But knowing the market is completely manipulated down for the sake of a dollar that is on life support I’m not really surprised at anything other than the allowed manipulation. It’s not gonna solve the problem.
The Fed is so caught up in inflation, only thing he can do is prop up dollar through gold bots. Which really has given BRICS the ability to buy much more gold for when they roll out new global currency. So Fed is actually helping them destroy the dollar by empowering them with what will do it, back BRICS with real money, gold. All nations involved are hoarding gold right now. The Fed is either clueless or anti American.
Bad breakdown for GDX
By: CyclesFan | July 25, 2022
• Bad breakdown for $GDX. The lower low today means the daily cycle that last bottomed on May 12 is on day 49 and the daily cycle low will likely occur on day 54/55(August 1/2). The next significant support goes back to April 1, 2020 and is located at 23.

Read Full Story »»»
DiscoverGold
Traders bet that gold and miners will continue a historic plunge
By: Jason Goepfert | July 25, 2022
• Gold and mining stocks have quite a few factors pointing to a rally. The biggest problem with that is they also had these a few weeks ago, and yet miners continue to see selling pressure. This is one of those markets where "extreme can always get more extreme" gets proven with regularity, and traders are betting the decline will continue.
Read Full Story »»»
DiscoverGold
Spoofing looks kinda obvious too. But iron grip by bots is absolute.
Bots are in complete control of gold this morning. If u can’t see the signals then just give them the sign like I do.
Newmont (NEM) gold production increased 3%
By: Kitco | July 25, 2022
Newmont gold posted its second-quarter results and the attributable gold production increased 3 percent to 1,495 thousand ounces from the prior year's quarter. The firm suffered slightly due to lower gold prices during the quarter. Net income from continuing operations dropped to $379 million vs $640 million a year earlier.
The firm produced 1.5 million attributable ounces of gold and 330 thousand attributable gold equivalent ounces (GEO) from co-products, an increase of more than 130 thousand total gold equivalent ounces from the first quarter. The average realized gold price for the quarter was $1,836/oz vs last quarter's $1,892/oz.
The firm generated $1.0 billion of cash from continuing operations and $514 million of Free Cash Flow (97 percent attributable to Newmont).
Elsewhere the company updated its full-year guidance for development capital spending to $1.1 billion. Provided trends on development capital costs and timeline related to Tanami Expansion 2 and Ahafo North
Newmont declared a second-quarter dividend of $0.55 per share, consistent with the previous seven quarters. There is also a $1 billion share repurchase program to be used opportunistically in 2022, with $475 million remaining.
Tom Palmer, Newmont President, and Chief Executive Officer "Newmont delivered a solid second quarter performance, producing 1.5 million gold ounces and generating $514 million in free cash flow. Through our industry-leading portfolio of assets and projects, our proven integrated operating model, our balanced and disciplined approach to capital allocation, and our values-driven commitment to our purpose of creating value and improving lives through sustainable and responsible mining, Newmont remains well-positioned to safely manage through the evolving and unprecedented challenges that face our industry and the world at large."
Read Full Story »»»
DiscoverGold
Forecast: Gold's Natural Magnet & Potential Upside
By: Jim Curry | July 24, 2022
Recapping Last week
Following a consolidation into early-week, Gold saw its low registered in Thursday's session, here doing so with the spike down to the 1678.40 figure. From there, a sharp reversal to the upside was seen to end the week, with the metal hitting a Friday peak of 1738.30 - before backing slightly off the same into the weekly close.
Gold Market, Short-Term
From the comments made in recent articles, Gold was looking for a key low to form, with that low coming from the combination of 10, 20 and 34-day cycles. The chart below shows the larger 34-day cycle:
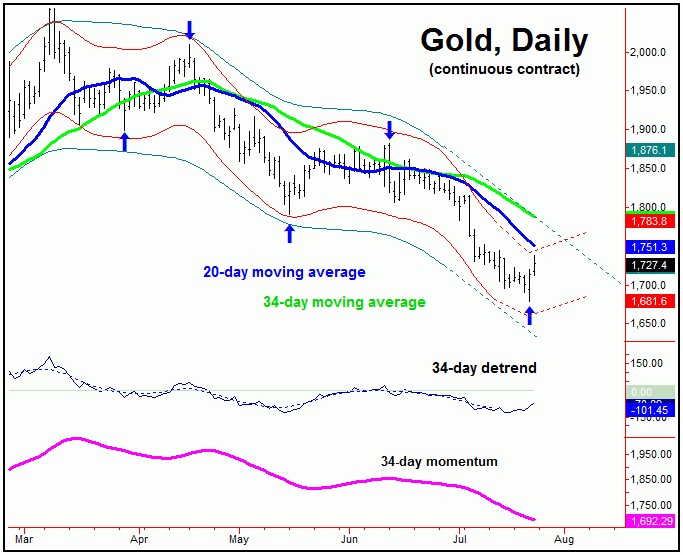
With the action seen into Thursday/Friday, the probabilities now tend to favor this short-term combination low to be set in place. Going further, that action suggests the potential for a sharp rally in the coming weeks, with the 34-day moving average or better acting as the ideal magnet.
Until proven otherwise, the overall assumption is that the current short-term rally phase will end up as a countertrend affair, with resistance around the 34-day moving average - which is also at or near our upper (and declining) 72-day cycle channel. Here again is our larger 72-day cycle:
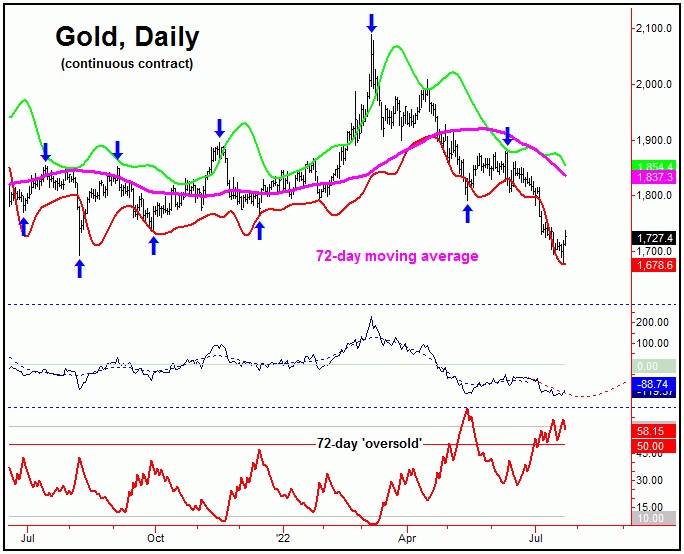
In terms of time, the ideal path for the current short-term rally to play out into the early-August period. If the move does end up as countertrend, then a drop back to or below the lows can be seen into mid-August or later, before bottoming this larger 72-day component.
Having said the above, there is one alternate that I am considering - and a strong case can actually be made for the same. That is, the most recent low was not only a bottom for the 10, 20 and 34-day cycles, but will also end up as a contracted trough for our larger 72-day wave. I do see this as having at least some validity, simply due to the fact that the smaller 34-day wave was recently into extended territory.
If the above alternate were to end up as correct, then the current rally would have the potential to rise as high as the 72-day moving average, and/or the upper 72-day cycle band - each of which are well over 100 points above current price levels. In other words, there is the potential for a huge amount of upside for Gold, at least for the short-term picture.
Gold's Stepped-Back View
For the mid-term picture, the overall assumption is that the next rally phase of the 72-day cycle - if and when seen - will end up as a countertrend affair, giving way to lower lows into mid-to-late October of this year. This is due to the current position of the larger 310-day cycle, shown again on the chart below:
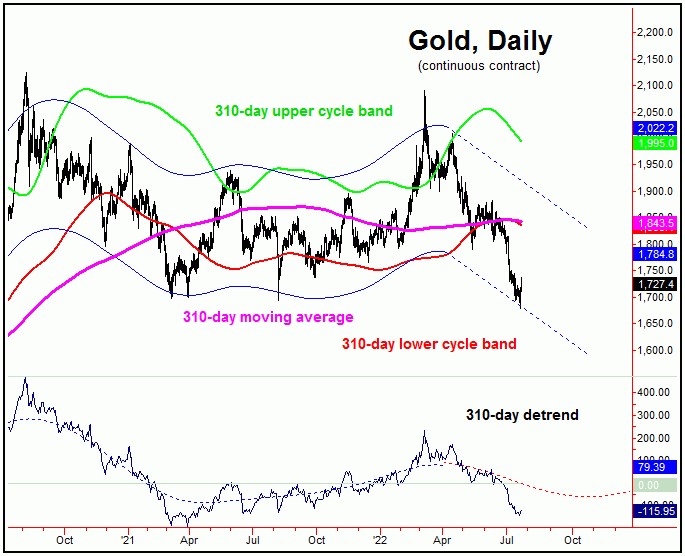
In terms of time, as mentioned above, the downward phase of this larger 310-day wave is projected lower into what looks to be the mid-October timeframe of this year, or later. If this is correct, then we will see any rally with the 72-day wave finding resistance at or near the upper 72-day cycle band indicator, giving way to lower lows into October. In terms of price, there is the potential for a drop to the 1650's as this larger 310-day cycle bottoms out.
For the bigger picture, the next mid-term low should come from this same 310-day cycle. From whatever bottom that does form with the same, Gold should see a very sharp rally of some 20-25% or more in the months to follow, as the next upward phase of this wave assumes control. More on this as we continue to move forward.
Read Full Story »»»
DiscoverGold
GDX hasn't made a lower low since the exhaustion gap on July 14
By: CyclesFan | July 24, 2022
• $GDX hasn't made a lower low since the exhaustion gap on July 14 that occurred 144 TD from the December low. Major lows every ~144 TD have been a common theme since the bull market high in 2020. It still needs to close above the 10 DMA to confirm that the low is in.

Read Full Story »»»
DiscoverGold
Bargain Hunters Jump on Recent Silver & Gold Pullback
By: Mike Gleason | July 23, 2022
After several brutal weeks of selling in precious metals markets, bulls are seeking a catalyst for a potential turning point. They may have gotten one via currency markets.
On Thursday, the European Central Bank raised its benchmark interest rate for the first time in 11 years. The ECB's larger than expected 50 basis point rate hike came amid spiking inflation and a plummeting euro exchange rate.
After European central bankers finally took steps to tighten, currency traders pushed the euro higher against the U.S. dollar.
The trends in the euro and other fiat currencies that trade against the dollar have little to do with the fundamentals for precious metals. But futures market speculators often take a rise in the U.S. Dollar Index as a signal to sell gold.
Relentless dollar strength on foreign currency markets this year has certainly been a major headwind for gold and silver prices.
Of course, the Greenback has been rapidly declining, not strengthening, in terms of its purchasing power.
Cumulative inflation has yet to be reflected in gold and silver prices. That will change eventually. And a possible top in the Dollar Index here could coincide with a bottom in precious metals markets.
As of this Friday recording, spot gold prices are up 1.2% for the week to trade at $1,737 an ounce. Silver, meanwhile, is unchanged on the week to come in at $18.96. Platinum is higher by 2.8% to trade $893. And finally, palladium is having a big day here today and has added 9.2% since last Friday's close to command $2,085 per ounce.
Depressed precious metals prices have deterred trend traders from going long these markets. Futures speculators have on net continued to add to their short positions on the way down.
But commercial traders who consist of industrial users and institutional hedgers have done the opposite. They have become increasingly bullish over the past couple weeks. This smart money indicator suggests the selling is overdone. The shorts could soon get squeezed.
Meanwhile, bargain hunters who aim to accumulate ounces for the long term are taking advantage of discounted pricing.
Bullion investors have plenty of great options when it comes to beautiful products that sell for minimal premiums above spot prices. The best values are typically found in privately minted bars and rounds.
Certain types of historic coins that lack numismatic value can also often be obtained at bargain prices. For example, pre-1965 90% silver dimes and quarters are a staple for silver stackers who buy them by the bag.
These previously circulated coins are often heavily worn. But they are still worth their weight in silver and are convenient for use in barter transactions.
In a sounder monetary era, silver circulated as coinage. One of the most beloved designs was the Mercury dime, issued by the U.S. Mint from 1916 to 1945. It features Lady Liberty wearing a winged cap.
Investors can now get investment grade silver featuring this iconic design. Money Metals is proud to offer full-ounce Mercury silver rounds as a stunning a tribute to these no longer minted dimes.
Unlike the Mercury dime which contained 90% silver and 10% copper, one-ounce Mercury rounds are made of 99.9% pure silver.
Pure silver rounds come in many other styles. Some are inspired directly by the classic designs of official coins. Others are completely unique.
Aesthetic value is certainly a relevant consideration for many bullion investors. But for the most part, design features will have no bearing on a silver round's current or future market value.
Privately minted bullion products tend to trade closely in line with spot prices. Government-minted coins, such as American Eagles, carry higher premiums above spot.
It's up to each individual precious metals buyer to decide whether it's worth it to pay a bit more for official coins. Some want particular coins from particular mints that are stamped with particular dates.
Others only care about acquiring ounces. They may be perfectly happy to buy plain bullion bars that lack any historic value, aesthetic qualities, or official mint prestige.
At the end of the day, acquiring gold and silver bullion in any form represents an investment in sound money. And with so much unsoundness in our monetary system today, precious metals play a vital role for investors that no other asset class can replicate.
Read Full Story »»»
DiscoverGold
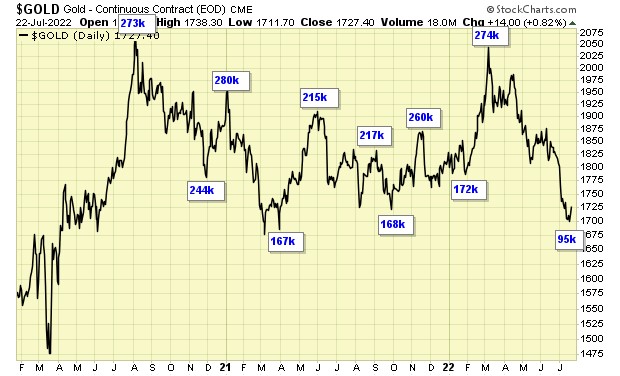
NY Gold Futures »» Weekly Summary Analysis
By: Marty Armstrong | July 23, 2022
The NY Gold Futures closing today at 172740 is immediately trading down about 5.53% for the year from last year's settlement of 182860. Caution is now required for this market is starting to suggest it will deline further on a monthly level. Presently, this market has been rising for this month going into July reflecting that this has been only still a bullish reactionary trend. As we stand right now, this market has made a new low breaking beneath the previous month's low reaching thus far 167840 while it's even trading beneath last month's low of 180250.
Up to now, we still have only a 1 month reaction rally from the low established during May. We must exceed the 3 month mark in order to imply a trend is developing.
ECONOMIC CONFIDENCE MODEL CORRELATION
Here in NY Gold Futures, we do find that this particular market has correlated with our Economic Confidence Model in the past. The Last turning point on the ECM cycle low to line up with this market was 2015. The Last turning point on the ECM cycle high to line up with this market was 2020 and 2011 and 1996.
MARKET OVERVIEW
NEAR-TERM OUTLOOK
The historical perspective in the NY Gold Futures included a rally from 2015 moving into a major high for 2020, the market has been consolidating since the major high with the last significant reaction low established back in 2015. The market is still holding above last year's low but is trading rather weak at this moment. The last Yearly Reversal to be elected was a Bullish at the close of 2020.
This market remains in a positive position on the weekly to yearly levels of our indicating models.
Looking at the indicating ranges on the Daily level in the NY Gold Futures, this market remains neutral with resistance standing at 176300 and support forming below at 171650. The market is trading closer to the support level at this time.
On the weekly level, the last important high was established the week of June 13th at 188250, which was up 4 weeks from the low made back during the week of May 16th. We have been generally trading down for the past 5 weeks, which has been a very dramatic move of 10.84%.
Looking at this from a broader perspective, this last rally into the week of June 13th reaching 188250 failed to exceed the previous high of 200300 made back during the week of April 18th. That rally amounted to only four weeks. Subsequently, the market has breached that low of the week of May 16th and has closed beneath it warning the market is weak. Since then, the market has consolidated for the past 5 weeks. Right now, the market is below momentum on our weekly models casting a bearish cloud over the price action. Looking at this from a wider perspective, this market has been trading up for the past 1 week overall.
INTERMEDIATE-TERM OUTLOOK
YEARLY MOMENTUM MODEL INDICATOR
Our Momentum Models are declining at this time with the previous high made 2020 while the last low formed on 2021. However, this market has rallied in price with the last cyclical high formed on 2020 and thus we have a divergence warning that this market is starting to run out of strength on the upside.
DiscoverGold Metals Still Have Not Confirmed A Bottom
By: Avi Gilburt | July 21, 2022
• Following the Elliott Wave analysis:
Do I think we are close to a metals bottom? Yes. Does that mean that all the charts will bottom at the same time? No. And, we have seen this countless times at many metals bottoms and tops throughout the years. They do not all bottom and top at the same time.
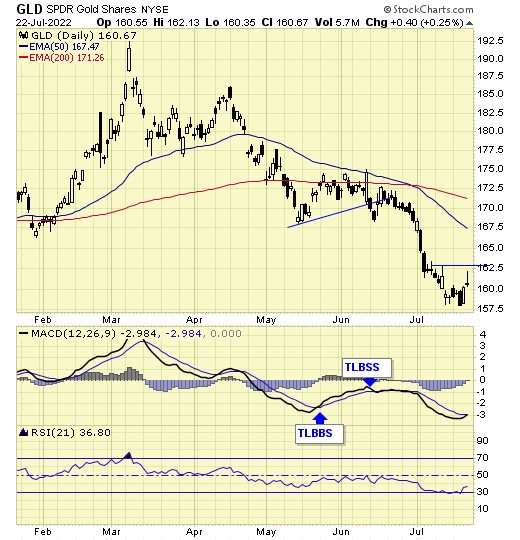
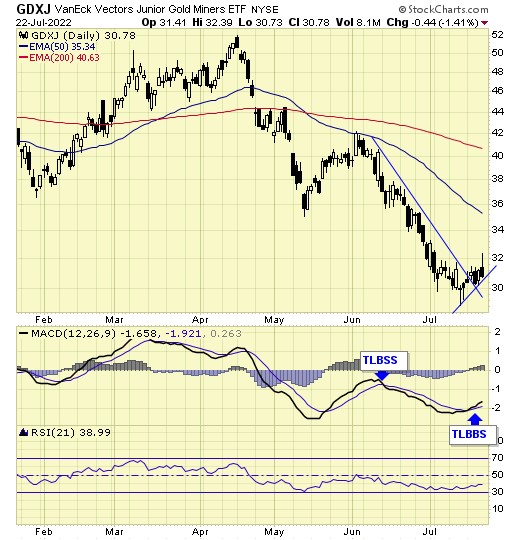
When I look at the smaller degree structures in both the GDX and GLD, neither of them evidence that a bottom has indeed been struck since neither have provided us with a clear 5-wave rally off the recent lows. But, again, all evidence suggests that we are still close to a major bottoming in the complex.
And, as far as silver is concerned, the best I can come up with for a bottom being structure is a leading diagonal off the recent lows. That means that if we are able to break back out over today’s high, then we have an initial indication that a bottom has potentially been struck in silver. But, overall, I still would much prefer a larger degree 5-wave structure completing towards the 21-22 region for me to begin strongly urging investors to be buying all pullbacks.
So, if you have been following me closely in the complex over the last half a year, you would know that I raised a lot of cash when I sold a significant portion of my largest position in the mining complex (NEM) when it struck the 83+ region. Since that time, I have recently added some small initial positions in calls in SLV and GDX. I am still awaiting the next 5-wave rally to be complete before I turn much more aggressive on the long side.
In summary, the market has more than enough waves on the downside to complete this larger degree corrective structure which has now taken us more than a year in quite a number of charts. In fact, in GDX, GLD and SLV, we have now taken almost 2 years during this corrective pullback. And, once the market provides us with the initial 5-wave rally off a low, then I will gladly suggest that all pullbacks are now buying opportunities as we look towards the 2023 time frame. In the meantime, please remember that when the metals market stretches us in a certain direction, the resulting reaction in the opposite direction is often even stronger. And, that is what I am expecting after we develop a 1-2 upside set up. But, we are not quite there just yet.
So, again, for conservative investors, I still strongly suggest you allow the metals to prove the bottom has indeed been struck with a 1-2 upside set up and break out. That is often the “safest” manner in which to invest in the metals complex. And, that has not yet happened.
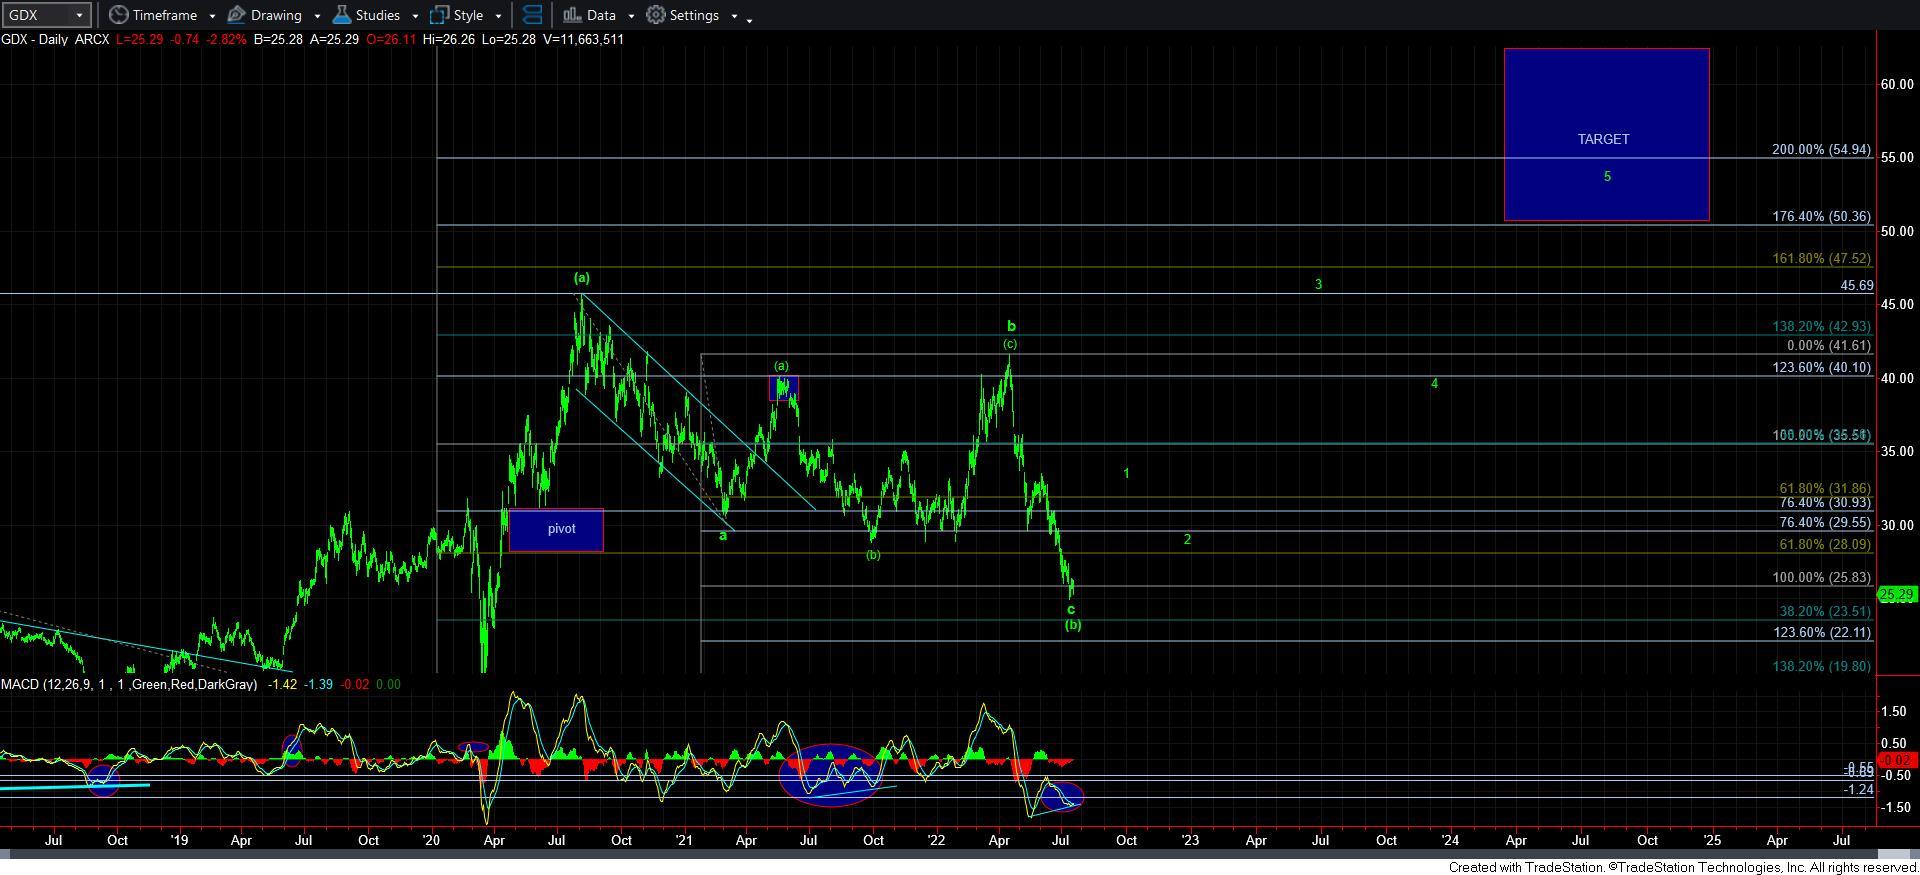
GDXdaily
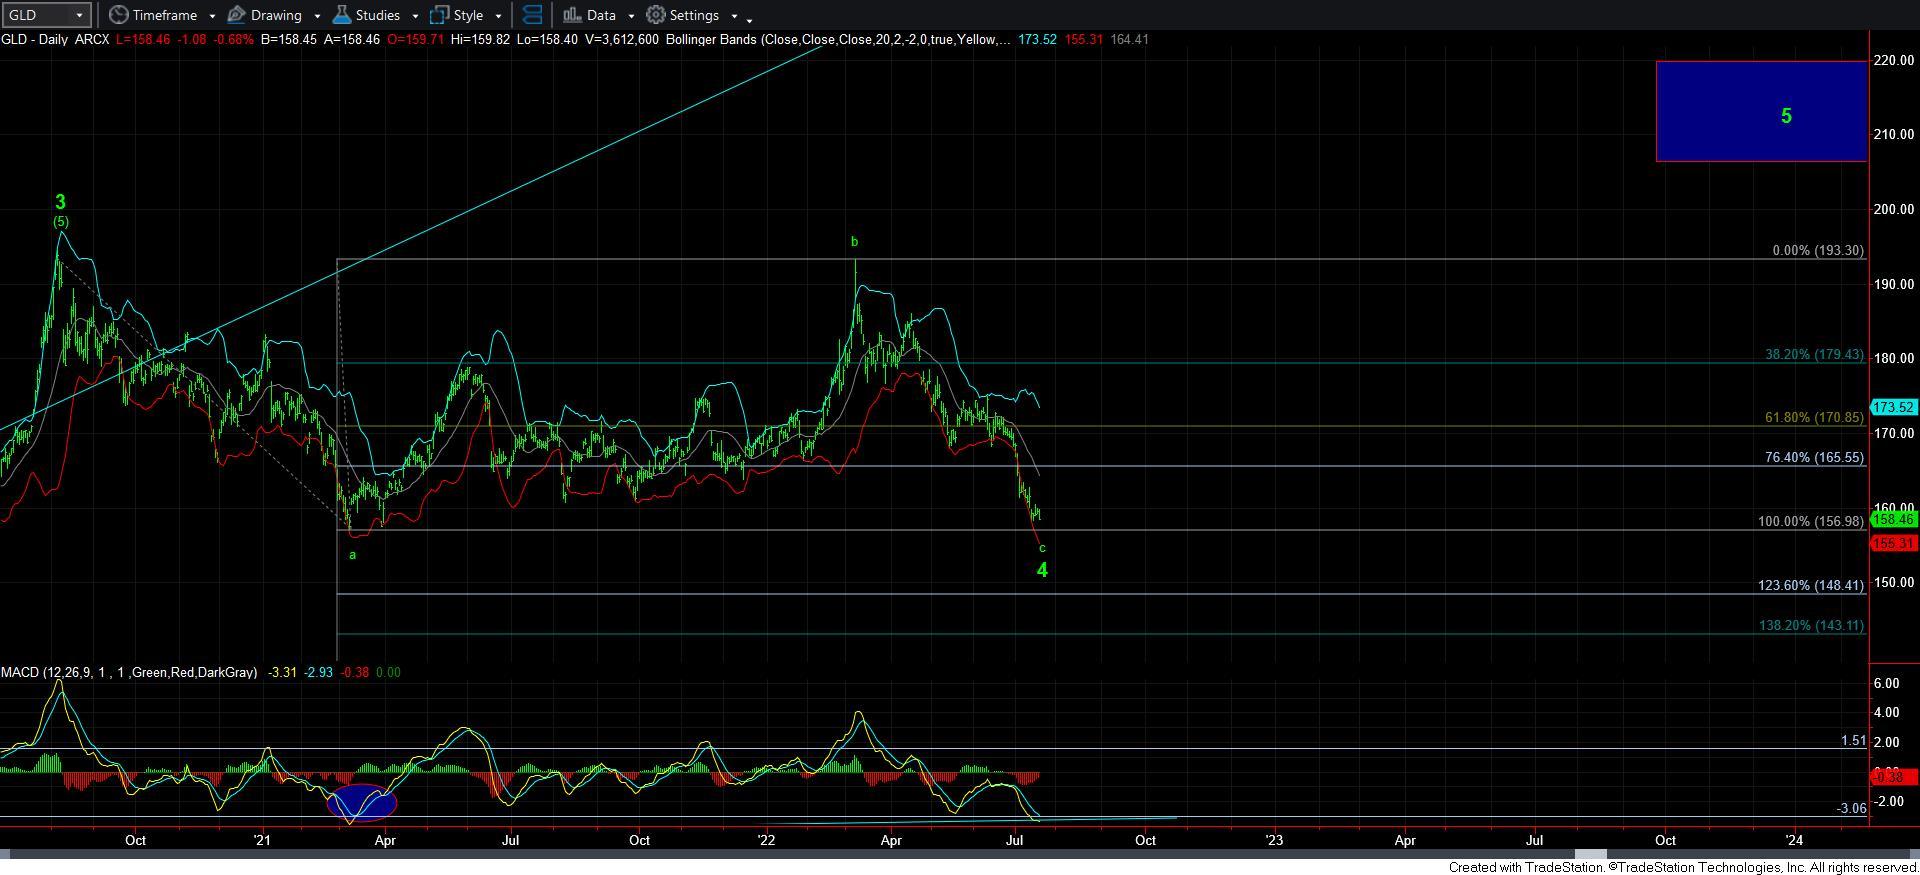
GLDdaily
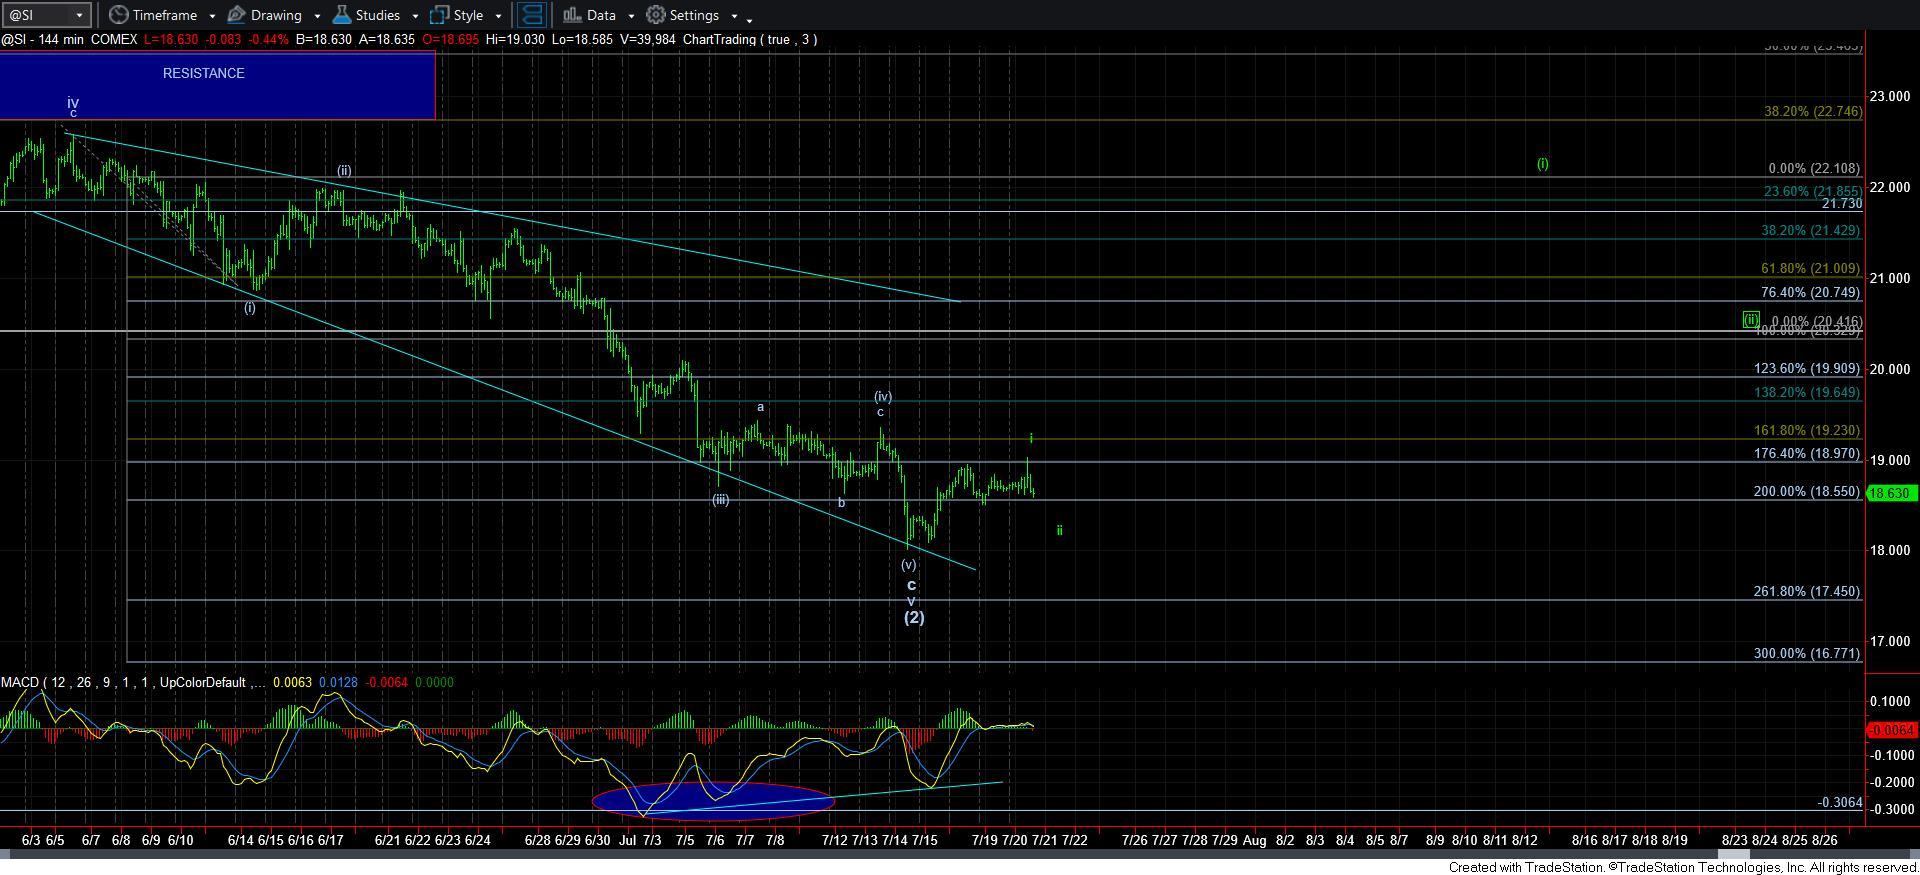
Silver-144min
Read Full Story »»»
DiscoverGold
Jack Chan: Gold Price Exclusive Update
By: Jack Chan | July 23, 2022
Our proprietary cycle indicator is down.
To public readers of our updates, our cycle indicator is one of the most effective timing tool for traders and investors. It is not perfect, because periodically the market can be more volatile and can result in short term whipsaws. But overall, the cycle indicator provides us with a clear direction how we should be speculating.
Investors
During a major buy signal, investors can accumulate positions by cost averaging at cycle bottoms, ideally when prices are at or near the daily 200ema.
During a major sell signal, investors should be hedged or in cash.
Traders
Simply cost average in at cycle bottoms when prices are at or near the daily 200ema; and cost average out at cycle tops when prices are above the daily 50ema.

Gold sector is on long term SELL signal as the recent buy signal has failed.
The correction since 2020 drags on.
GLD is on short term sell signal.

GDX is on short term sell signal.

XGD.to is on short term sell signal.
GDXJ is on short term buy signal.
Analysis
Speculation at the lowest level in two years.

Our ratio is on sell signal.

Trend is up for the dollar.

Trend is down for gold stocks.
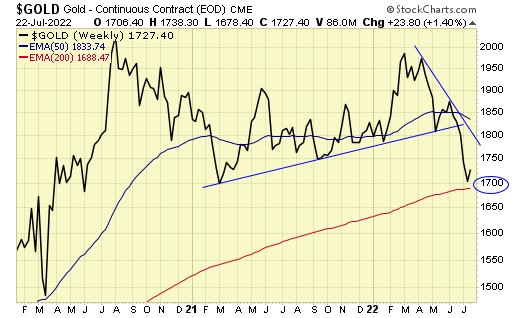
Trend is down for gold also.
Downside target is the 200ema support.
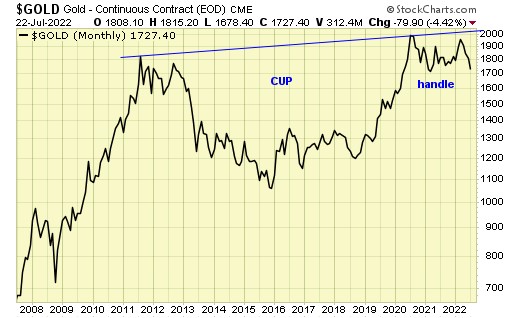
The decade long cup with handle remains in progress.
Summary
Long term – on SELL signal.
Short term – on mixed signals.
Gold sector cycle is down.
$$$ We are now holding trading positions as no core positions should be held during a long term sell signal.
Read Full Story »»»
DiscoverGold
COT - Commitments of Traders in Metals Futures Market Reports
By: Software North | July 22, 2022
Gold
Silver
Read Full Story »»»
DiscoverGold
Gold-Stock Selloff Anomaly
By: Adam Hamilton | July 22, 2022
The gold miners’ stocks have just been slaughtered in recent months, spiraling relentlessly lower. This bloodbath of a summer has deteriorated into their worst in modern-gold-bull years! The resulting bearish sentiment has proven overwhelming, leaving this sector universally-despised. But this brutal gold-stock selloff is an unsustainable anomaly fueled by extreme gold-futures selling, which will soon reverse hard.
Merely paying attention to battered gold stocks these days is depressing, and analyzing them is grueling. Yet contrarian speculators and investors who have forged the mental toughness necessary to buy low know deeply-out-of-favor sectors offer the greatest upside potential. So we have to hold our noses and keep trudging forward through this gold-stock-sentiment hellscape. The recent carnage has been dreadful.
The leading gold-stock benchmark and trading vehicle remains the GDX VanEck Gold Miners ETF. While it feels like an eternity ago, in mid-April the major gold stocks dominating GDX were faring quite well. At $40.87, this ETF had blasted 39.5% higher in just 2.6 months in a strong young upleg. This small sector was regaining favor, starting to win the attention of more-mainstream traders. Then it all went pear-shaped.
In less than a month into mid-May, GDX plummeted 26.2%. It started to recover into early June, but only rallied 10.5% before another crushing wave of selling hit. That slammed the major gold stocks another 24.3% lower by this week. GDX’s total losses over the 3.1 months between mid-April to this Wednesday were a soul-crushing 38.2%! As price action drives sentiment, it is no wonder this sector has grown loathed.
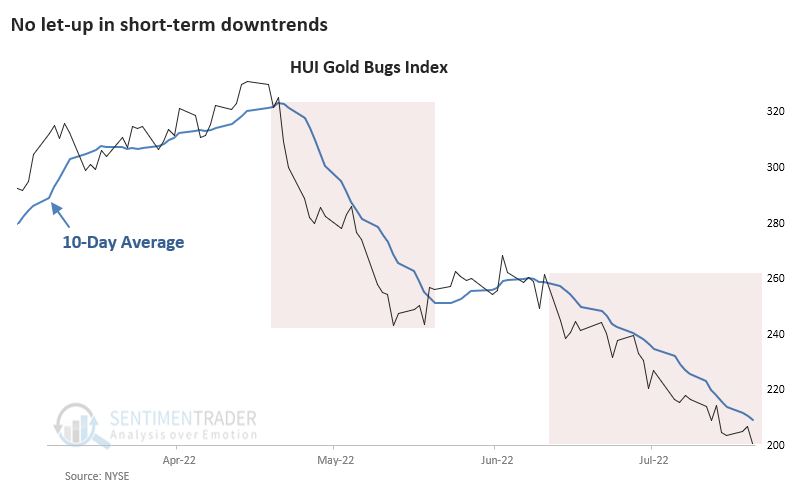
The gold stocks are now suffering their worst summer performance in all modern gold-bull-market years, running from 2001 to 2012 and 2016 to 2022! This chart is updated from my gold-summer-doldrums essay of a few weeks ago. Using the older HUI gold-stock index which is functionally-interchangeable with GDX, it indexes each gold-stock summer to May’s final close. This year’s deviation from norms is ugly.
As of this week, the major gold stocks have plunged a stunning 21.1% summer-to-date! Between 2001 to 2012 and 2016 to 2021, they averaged far-better 2.8% gains in this same span. So there’s no doubt recent months’ gold-stock death march lower is an exceptional anomaly. This severe drawdown is also unusual in its profile, proving gradual and remarkably-linear. Gold-stock selloffs are typically sharp and short-lived.
This relentless selling has felt like Chinese water torture, obliterating any residual bullish sentiment. The tiny fraction of traders still watching this left-for-dead sector are extrapolating this miserable downtrend into the indefinite future. They assume gold stocks are doomed to keep spiraling lower. Few contrarians are willing to try and catch these falling knives, so battered gold miners are seeing little bidding in this massacre.
But market extremes are never sustainable, neither technically nor sentimentally. Anomalous selloffs are almost always soon followed by symmetrical mean-reversion rallies higher. Bombed-out stock prices and suffocatingly-bearish psychology are inherently self-limiting. Once all traders susceptible to being scared into selling low have panicked and fled, that leaves only buyers. Their capital inflows fuel major reversals.
These hated gold stocks are overdue for an imminent monster rally higher. To understand why, traders need to look at the driving forces behind their anomalous selloff. They were gold getting hammered lower by extreme gold-futures selling on the US dollar rocketing parabolic. The gold stocks are leveraged plays on the metal they mine, with GDX generally amplifying material gold-price moves by 2x to 3x. That’s what happened.
A couple weeks ago I wrote a whole essay illuminating the euphoric dollar slamming gold. From mid-April to mid-May during GDX’s first 26.2% downleg, gold fell 7.8% on heavy gold-futures selling. That was spawned by a strong 4.0% rally in the dollar’s leading benchmark, the US Dollar Index. Then from early June to mid-July in GDX’s next 24.3% downleg, gold plunged 9.3% on a monster 5.2% parabolic USDX surge!
Overall between mid-April to the middle of this week where GDX collapsed that horrible 38.2%, gold was bludgeoned 14.2% lower by the USDX blasting 6.2% higher. That made for gold-stock leverage to gold of 2.7x, right in line with GDX’s long-established 2x-to-3x precedent. Both these enormous gold and USDX moves were more extreme when measured on their own timelines, helping explain gold stocks’ cratering.
From its earlier overbought topping in early March soon after Russia invaded Ukraine, gold has plunged 17.4% over 4.4 months as of this week. Speculators’ and investors’ confidence in this leading alternative investment was crushed as it collapsed from $2,051 to $1,695, a serious fall from grace. At best within that span from late March to mid-July, the USDX skyrocketed 11.1% to an incredible 20.1-year secular high!
Trading near 108.7 last week, the USDX had soared to extraordinarily-overbought levels 10.3% above its 200-day moving average! Normal overboughtness in recent years started at just 4% over that baseline. This long-dollar trade has become exceedingly-overcrowded in recent months. Just like with gold and its miners’ stocks, traders now assume the US dollar’s blistering strength will persist forever. They’re dead-wrong.
The USDX soared on an amazing confluence of unrepeatable one-off events. They started with the Fed’s most-extreme hawkish pivot in its entire century-plus history in recent months! That included ending QE4 bond monetizations, launching an aggressive new rate-hike cycle, and starting to unwind the extreme money printing of recent years through QT2 bond selling. All this coming so fast was wildly-unprecedented.
Starting in mid-March, the Fed’s FOMC accelerated its rate hikes from 25 basis points to 50bp then 75bp at three consecutive meetings! The latter two big hikes were the first the Fed dared at those levels since way back in May 2000 and November 1994. The Fed is universally expected to hike another 75bp at next week’s coming FOMC meeting. These soaring US interest rates attracted currency traders into the US dollar.
In just 25.5 months into mid-April 2022, the Fed had mushroomed its balance sheet a truly-astonishing 115.6% or $4,807b! Functioning as the monetary base, that more than doubled the US-dollar supply in just a couple years. So QT2 to start unwinding these crazy monetary excesses was started at $47.5b per month in June, before doubling to $95b monthly in September. That dwarfs QT1 in both size and intensity..
It took an entire year to slowly ramp up to QT1’s own terminal velocity of $50b a month of bond selling. The Fed will probably never be able to execute another similar hawkish shock in our lifetimes. Reversing from a zero-interest-rate policy to big-and-fast rate hikes while simultaneously birthing the largest QT monetary destruction ever attempted is totally-unique! That extreme hawkish shift is pricing into the markets.
Adding to that Fed-fueled dollar surge’s uniqueness, the euro plummeted in that same span. Between late March to mid-July where the USDX soared 11.1%, Europe’s common currency dropped near parity with a huge 10.2% loss. The euro dominates the US Dollar Index at 57.6% of its weighting, leaving the Japanese yen a distant-second at just 13.6%. This monster euro drop was as unique as the dollar’s surge.
The European Central Bank dragging its feet on tightening compared to the Fed was a big factor. That gap is closing though, as the ECB finally surprised this Thursday with a big 50bp hike! Like the Fed, the ECB is fighting raging Eurozone inflation fueled by its own extreme money printing in recent years. The euro’s anomalous weakness was also exacerbated by Europe’s dependence on Russian natural gas.
Traders dumped the euro as worries mounted that Russia would severely curtail or even halt shipments to punish European governments for supporting Ukraine. But this one-off event risk has been priced-in. Another factor is Italy’s troubled government forcing its bond yields higher. The ECB is trying to address that inter-country yield-fragmentation risk with new Italy-specific QE bond buying announced this week.
All this happening together in just a few months is extraordinary, and unrepeatable! The problem for gold and thus its miners’ stocks is gold-futures speculators watch the US dollar’s fortunes for their primary trading cues. So that monstrous USDX surge ignited extreme gold-futures selling, slamming gold sharply-lower which the major gold stocks of GDX dutifully amplified like usual. But those big moves are exhausted.
After the US Dollar Index rocketed parabolic to some of its most-extreme overbought levels ever, this wildly-overcrowded trade has run its course. The resulting euphoria and greed have already sucked in the vast majority of capital willing to chase that unsustainable momentum. The euro selling fueling its recent plunging is also way-overdone. The euro isn’t going to zero backed by the Eurozone’s huge economy.
The overdue big symmetrical mean-reversion reversals in both the US dollar and euro will ignite big gold-futures buying. That will catapult gold sharply-higher due to the same extreme leverage that pummeled it lower in recent months. With gold near $1,700 mid-week, each 100-ounce gold-futures contract controls $170,000 of it. Yet margin requirements only make traders keep $6,500 cash per contract in their accounts.
That enables extreme maximum leverage of 26.2x! Every dollar traded in gold futures at these levels has 26x the gold-price impact as a dollar invested outright! So when the enormous gold-futures selling of recent months gives way to proportional buying, gold is going to soar. Both speculators’ long and short bets on gold via futures are at unsustainable extremes with selling exhausted, which is super-bullish for gold.
This next chart superimposes gold prices over speculators’ overall gold-futures positioning, which gets released weekly in the famous Commitments-of-Traders reports. Specs’ massive long selling and huge short selling in recent months fully explains gold’s anomalous plunge that crushed the gold stocks. Both gold and the miners will soar proportionally to their recent declines when gold-futures buying reemerges.
Again gold plunged 17.4% between early March to mid-July on that confluence of anomalous events just described. That’s the only reason GDX plummeted 38.2% from mid-April to this week. The gold-futures selling pummeling gold lower was colossal. Speculators dumped 116.9k long contracts while adding 52.3k short ones. That total selling of 169.2k in 4.1 months was the equivalent of 526.1 metric tons of gold!
To put that into context, the World Gold Council’s latest fundamental data shows global gold investment demand in all of 2021 ran 1,006.4t. So gold-futures speculators alone puking out over half that in a third the time was way too much for markets to absorb. Considering that withering onslaught, gold really proved quite resilient until its 200dma, major-uptrend support, and $1,800 all failed in late June to early July.
The gold-futures speculators punching way above their weights bullying around gold prices with outsized leverage is bad enough. 26x+ is criminal and should be outlawed, brought in line with stock markets’ 2x legal limit since 1974! There’s no reason one small group of traders should unfairly dominate any global market. Unfortunately the technical price action their reckless trading drives unduly influences investor psychology.
Gold’s fundamental backdrop today is phenomenal, wildly-bullish! Thanks to the Fed’s crazy QE4 money printing, US inflation is raging in its biggest super-spike since the 1970s. During the pair of those plaguing that decade, monthly-average gold prices from trough to peak headline CPI nearly tripled during the first before more than quadrupling in the second! Gold investment demand should be soaring with red-hot inflation.
Stock bear markets also fuel major gold investment demand, to prudently diversify stock-heavy portfolios. Between early January to mid-June, the flagship US S&P 500 stock index fell 23.6% formally entering a new bear! And given US stock markets’ festering near-bubble valuations, this beast has a long ways to rampage. Investors should be flocking back to the leading alternative investment to protect their scarce capital.
Yet thanks to the serious technical damage inflicted on gold by indiscriminate myopic gold-futures selling recently, investors are exiting. The World Gold Council publishes comprehensive gold-investment-demand data quarterly, but the best high-resolution daily proxy for that is the combined holdings of the dominant GLD and IAU gold ETFs. Between late April to this week, those suffered a big 7.1% or 115.7t draw
Investors love chasing upside momentum, so technical breakdowns spook them into fleeing. It doesn’t matter if they are righteous or not, fundamentally-driven or fueled by unsustainable gold-futures selling. This recent gold carnage driven by the gold-futures equivalent of 526.1t of selling shook loose at least another 115.7t of investment selling. That adds up to nearly two-thirds of 2021’s total investment demand!
While it’s been infuriating seeing gold artificially plunge in this most-bullish-environment-imaginable for it, the responsible gold-futures selling has exhausted. Weekly CoT reports are current to Tuesdays, but not released until late Friday afternoons. So the latest-reported CoT data before this essay was published is only as of Tuesday July 12th when gold was near $1,725. Even more gold-futures selling has happened since.
So all the following wildly-bullish gold analysis is understated. Total spec longs had fallen to just 303.7k contracts then, a 3.1-year secular low near levels not seen since mid-June 2019! Major secular support runs higher than that near 312k contracts. Spec longs aren’t likely to fall much lower, so their selling is spent. As longs outnumber shorts by 1.8x, the are proportionally-more-important for gold’s near-term direction.
Most of the gold-futures selling initially crushing gold between mid-April to mid-May was a huge long liquidation. But with most speculators abandoning their upside gold bets then, there wasn’t much left to sell from mid-June to mid-July. So the great majority of gold-futures selling crushing gold to its recent technical breakdown was shorting. Total spec shorts rocketed way up to 165.9k contracts last week!
Those extremes were the highest levels witnessed since 3.2 years earlier in late April 2019. While gold-futures speculators’ ludicrous leverage gives them tyranny over short-term gold prices, their capital firepower is very-limited. There’s only a small group of traders playing the gold-futures game, as the risks are crazy-high. So there’s only so much long and short selling these guys can do before they reach limits.
And those have almost-certainly been hit with spec longs at extreme 3.1-year lows while spec shorts are at extreme 3.2-year highs! Once their collective bets get that lopsidedly-bearish on gold, they soon have to reverse them with massive proportional buying. That initially starts with a short-covering squeeze on some inevitable gold-bullish news catalyst, with traders legally required to close out those positions by buying.
The resulting gold upside momentum from short-covering soon attracts in new long buyers, which propel gold higher accelerating its gains. That soon entices back investors which command vastly-larger pools of capital. This three-stage buying dynamic fuels major gold bull-market uplegs. To see what happens after spec gold-futures positioning gets so extreme, all we have to do is look at the last time in summer 2019.
Between spec shorts narrowly exceeding today’s extreme highs in late April 2019 and spec longs slightly-lower than today’s extreme lows in mid-June 2019, gold bottomed at $1,271 in early May. That summer wasn’t particularly gold-bullish, with the S&P 500 climbing to a series of record highs while inflation was low averaging a mere +1.7%-year-over-year CPI. And there were no unusual events like 2020’s pandemic
Yet solely because spec gold-futures positioning had grown so extreme and had to be unwound, over just 4.1 months into early September gold blasted 22.3% higher to $1,554! From the Tuesday CoTs closest to that span, specs bought 204.6k long contracts while covering another 44.8k short ones. That added up to a massive 775.8t of gold-equivalent buying! Gold’s resulting big upside momentum quickly attracted investors.
During that same gold-soaring-on-futures-mean-reversion-buying span in mid-2019, GLD+IAU holdings blasted 17.4% or 181.0t higher! Everyone waxes way more bullish on gold when it is decisively rallying, which always happens as speculators rush to reverse excessively-bearish positioning like today’s. And with their metal soaring, the gold stocks amplify those gains. GDX rocketed up 53.4% in that short span!
That was just perfectly-normal 2.4x upside leverage, nothing unusual. If gold and GDX could soar 22% and 53% in just 4 months after the last time speculators’ gold-futures positioning was as extreme as today’s, imagine how big the coming mean-reversion upside potential is. Unlike summer 2019, we are in the biggest inflation super-spike since the 1970s while stock markets roll over into a deepening bear market!
Market history has proven many times that there is nothing more bullish for gold’s and gold stocks’ near-term fortunes than excessively-bearish gold-futures speculators. Once their capital firepower available for selling is exhausted as seen in very-low longs and very-high shorts, gold decisively bottoms. Then as these hyper-leveraged traders normalize their gold-futures bets, gold soars on big mean-reversion buying.
If you regularly enjoy my essays, please support our hard work! For decades we’ve published popular weekly and monthly newsletters focused on contrarian speculation and investment. These essays wouldn’t exist without that revenue. Our newsletters draw on my vast experience, knowledge, wisdom, and ongoing research to explain what’s going on in the markets, why, and how to trade them with specific stocks.
That holistic integrated contrarian approach has proven very successful. All 1,296 newsletter stock trades realized since 2001 averaged outstanding +20.0% annualized gains! While we suffered a mass-stopping during gold stocks’ latest plunge, we’re rebuilding our trading books with cheap fundamentally-superior mid-tier and junior gold and silver miners to ride their coming upside. Subscribe today and get smarter and richer!
The bottom line is this recent brutal gold-stock selloff is an extreme unsustainable anomaly. Gold stocks only collapsed because their metal was slammed lower by extreme gold-futures selling. That in turn was fueled by an extreme parabolic US-dollar rally on an unprecedented confluence of one-off events. But all that exhausted specs’ gold-futures-selling firepower, leaving their positioning at unsustainable bearish extremes.
That only leaves room for big mean-reversion buying to normalize these severely-lopsided gold-futures bets. That will catapult both gold and its miners’ stocks sharply-higher in massive symmetrical rallies. In just four months after the last time speculators’ positioning was similar in spring 2019, gold blasted 22% higher which GDX amplified to a 53% gain! Exceedingly-bearish gold futures are super-bullish for gold stocks.
Read Full Story »»»
DiscoverGold
Gold Stocks: Technical Action Improves
By: Morris Hubbartt | July 22, 2022
Super Force Signals (SFS) is being rebranded as Super Gold Signals (SGS at https://supergoldsignals.com), to reflect the growing global importance of gold.
SG60 Key Charts, Signals, & Video Analysis
SGT Key Charts, Signals, & Video Analysis
SGJ Key Charts, Signals, & Video Analysis
Read Full Story »»»
DiscoverGold
Gold Has Been a Disappointment This Year. What Could Change That
By: Barron's | July 21, 2022
Gold has failed to show its value as a haven investment so far this year, with prices marking their lowest settlement since the spring of 2021. And a key index that tracks the performance of gold mining stocks dropped to a more than two-year low.
Even so, it may be safe to bet that the metal will prove once again just how precious it is to investors—under the right conditions.
Rising interest rates and strength in the dollar contributed to gold’s drop to $1,700.20 an ounce on July 20, the lowest finish since March 30, 2021, while the NYSE Arca Gold Miners index recently fell to 701.80 intraday, its weakest since April 2020.
Gold has spent the past couple of years stuck in a trading range, with the upper $1,600s on the lower end and stiff resistance just under and above $2,000—and that is likely the range the market will continue to see as the year concludes, says Peter Spina, president of GoldSeek.com.
However, an indication that the U.S. Federal Reserve is nearing the end of its rate hikes would trigger a big response in gold prices, he says, potentially lifting prices toward the top end of their trading range or higher.
Red-hot U.S. inflation numbers have produced fears of more aggressive interest rates, raising the risk of a recession. The June U.S. inflation reading showed a rise to a nearly 41-year high of 9.1%, backing expectations for more interest-rate hikes by the Fed.
Investors have historically used gold to offset losses from inflation, but central bank interest-rate hikes and strength in the U.S. dollar have managed to dull the metal’s appeal.
Paul Wong, market strategist at Sprott Asset Management, points out that the concept of gold as an inflation hedge was born nearly 50 years ago in a market that is “nearly entirely different from the current market.”
In the 1970s, the Swiss franc and gold became the “dominant recipients of safe-haven flows,” he says. Today, the “Fed and other central bank policies have become the primary driver of market expectations as they control liquidity levers.” The Fed announced a 75 basis point rate increase in June—the biggest since 1994—in an effort to combat inflation.
“Inflation and concurrent recession fears began to crystallize around the end of Q1 and have increased since,” so gold has suffered under either scenario in the short term, says Wong. Even so, “selling flows far outweigh any message inflation, or recession, has on gold.”
Wong warns of further declines in the short term, with the possibility for a move higher thereafter. Gold prices may “temporarily fall to levels that may surprise,” he says. But “there is an adage that bear markets seldom end with a yawn and a shrug,” so “writing off gold, may be early.”
For now, there is no sign of a major turnaround. Gold prices trade nearly 6% lower this month, contributing to a year-to-date loss of 7%.
Still, if the debt markets can no longer handle rising interest rates, the Fed would be forced to slow down and stop rate hikes, prompting a cool-off in the dollar and “Western gold investors will start to add to positions,” GoldSeek.com’s Spina says.
If gold prices do bottom out, that may offer an opportunity in gold mining stocks, says Spina. The VanEck Gold Miners exchange-traded fund (ticker: GDX) has lost over 20% this year. Gold miners trade as if gold was under $1,500, Spina says.
The entire gold mining sector has been “decimated,” he says. “As long as the gold price holds up here and starts to rise again, gold stocks will have a big reversal rally.”
Read Full Story »»»
DiscoverGold
Gold Bug Survivors Prepare To Capitalize
By: Gary Tanashian | July 21, 2022
• The ‘macro’ and sector fundamentals have been incomplete
• The technicals have advised a downtrend since mid-2020, with the exception of one head fake in March-April 2022
• Sentiment, which was over-bullish in mid-2020 and April 2022 is now opposite – and very bullish on a contrarian basis
• The sector is deeply oversold
• Commitments of Traders data for gold and silver are positive and very positive, respectively on a contrarian basis
So here we are, intact. That goes for me personally.
There has been a lot of waiting, biding time, trading other areas and sitting on cash; a high percentage of it.
But as speculators, traders and/or investors are we not called upon to set our views in stone? Are we not called upon to be ready to capitalize on extreme events within the markets? When the herds run one way, we need to be ready to go the other. The herds are not prepared because they’re either already deployed or too busy running from losing positions.
Gold bug herds, AKA less experienced or analytically critical precious metals bulls, are currently running that way, over that cliff over there. They have been herding since August 2020, when we first noted the danger. Such events climaxed in 2008 and 2020. In each of those instances a crash took place and it coincided with fundamentals slamming into place. Crashing gold stocks + ramping fundamentals = a big time buy opportunity.
As noted in the first bullet point above, the fundamentals have not slammed into place on this cycle. They are grinding into place, slowly and outside the limits of the average market participant’s patience. But that is exactly why contrarian investing is so difficult. It is very hard to have patience when time takes what it takes for an opportunity to play out, especially when your viewpoint is not reinforced by a majority.
So that is the background. We have been more than prepared in managing risk. That is how markets often go… manage risk, manage risk some more, manage risk for so long you almost lose sight – in real time – of why you’re there and what your job is, and then prepare to capitalize.
Intact players should now be considering the big sentiment event on tap for next week as the Fed, which was jerked, kicking and screaming, into hawk mode by the bond market, prepares to render its big decision on July 27, when it will either hike the Fed Funds by .75% per 71% of CME traders or 1% per 29% of CME traders.
Meanwhile, the ARCA Gold BUGS is tanking toward a higher low to the 2018 low, which is really all it needs to do to keep the volatile series of higher highs and higher lows (AKA a bull market) intact.
We use shorter-term charts and, of course, the ‘macro’ and sector fundamentals and sentiment to fine tune the situation in NFTRH reports and updates. But this general monthly chart picture should not only cause no concern for would-be buyers who are well prepared. It should stimulate greed while a majority of bugs are gripped in fear.
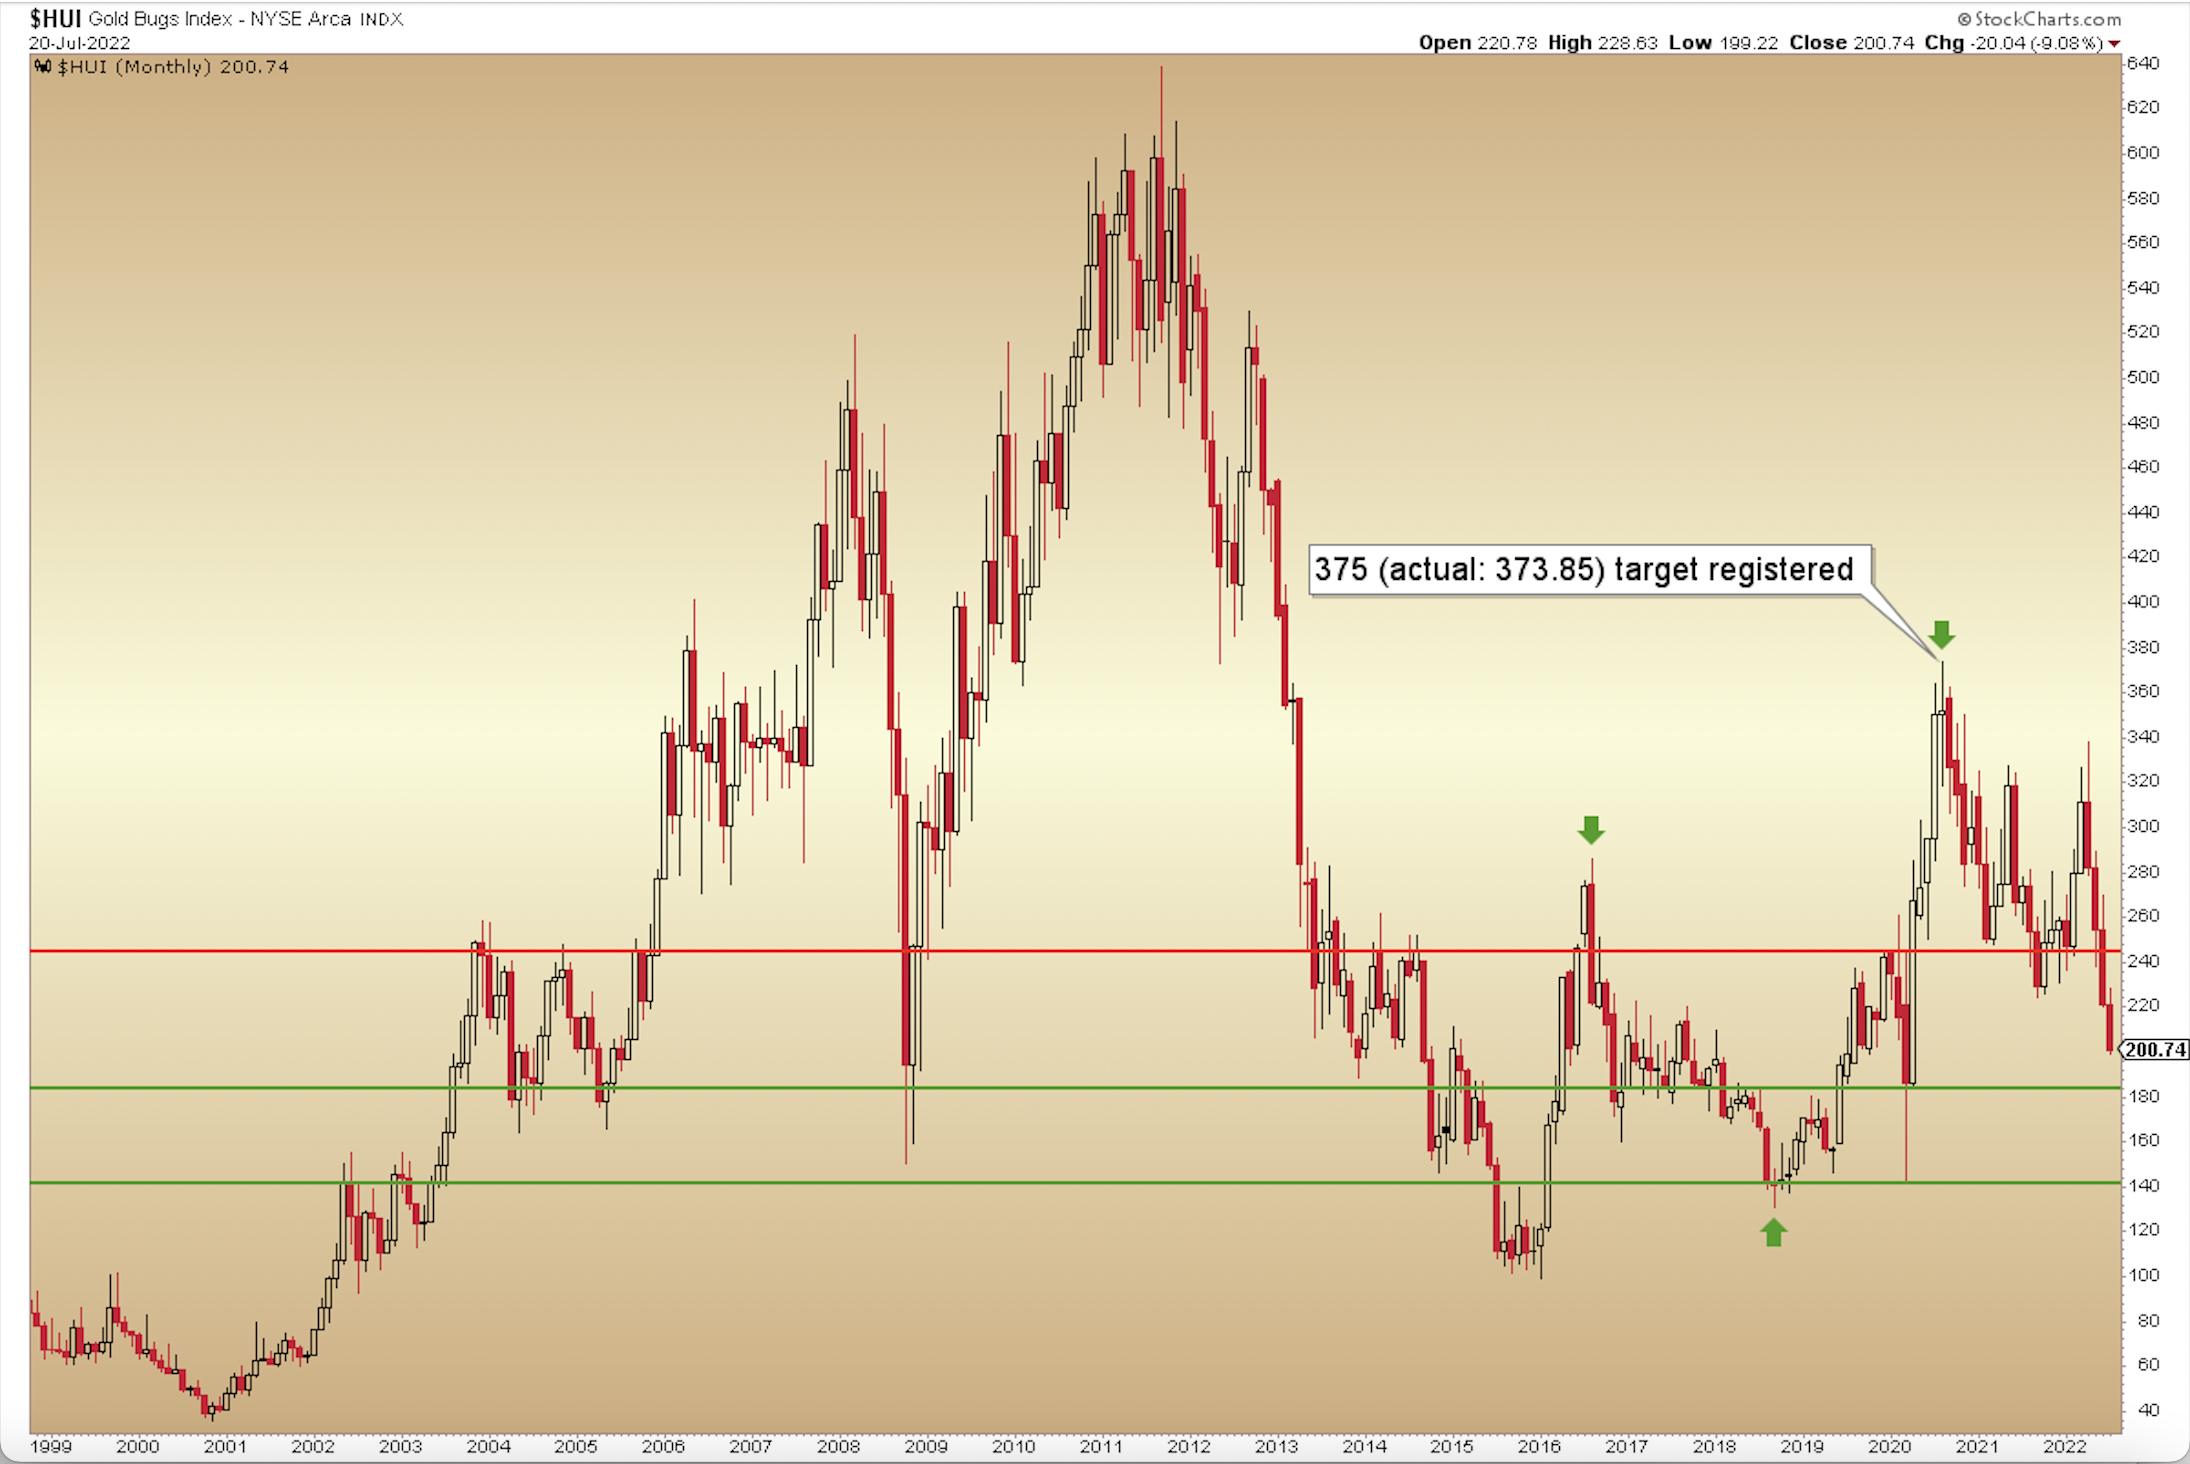
Long-Term HUI Monthly Chart.
Read Full Story »»»
DiscoverGold
Yup. Smart money came back into miners this week. Time to trade alpha and accumulate;)
Peaked at 1710, currently sliding, at 1695 right now.
Gold reacts to employment and EU rates, Italy. Seems to have a pulse after senseless drop to 1680. Having said that, once it settles down it could drop back again. One thing in its favor, very large volume that manipulation cannot deal with right now.
Gold Is Getting Ready to Follow in Junior Miners’ Footsteps
By: P. Radomski | July 20, 2022
As junior miners continue to rise and the USD keeps falling, it seems like a matter of a short time before gold soars. It only needs a proper trigger.
Gold is doing pretty much nothing these days, but junior miners tell us what gold’s going to do next. It’s most likely to rally in the short term.
Why? Because the mining stocks tend to lead gold higher and lower, and looking at the relative performance of both parts of the precious metals sector, we see that this time, miners are already moving higher, while gold is getting ready to follow in miners’ footsteps. Let’s take a closer look at what junior miners (the GDXJ) did recently.
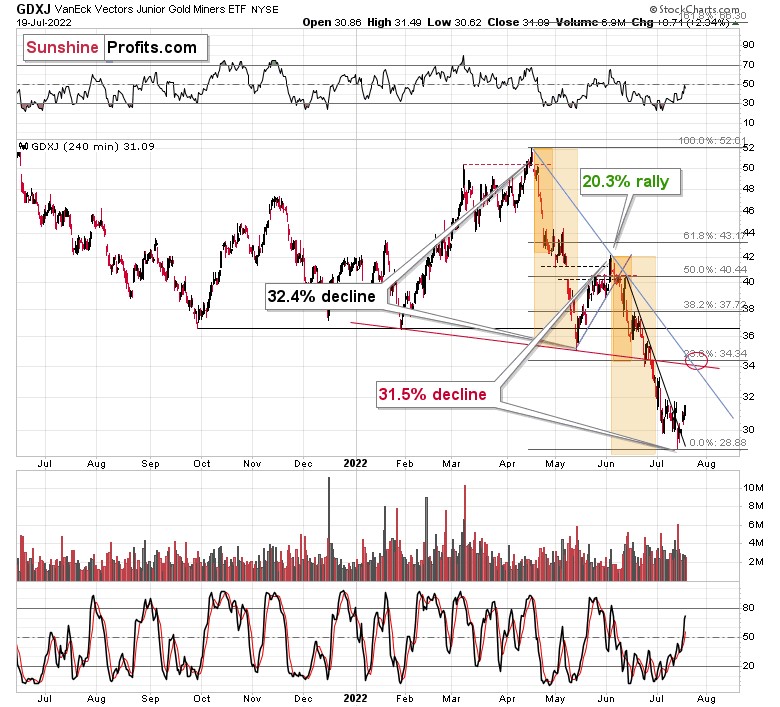
In short, junior miners managed to break above their declining short-term resistance line, and they closed above it for the second consecutive day. If they stay above it today (which is highly likely), the breakout will be confirmed. This is a very bullish indication for the short run.
This is especially the case since it happened shortly after the GDXJ refused to break below the $30 level – rallying back above it after a daily close slightly below it. The invalidation of the tiny breakdown itself was a bullish sign, not to mention that the very bottom – the daily reversal – materialized in huge volume.
The above chart is bullish for the short run, and please note that junior miners are now well above their early-July bottom.
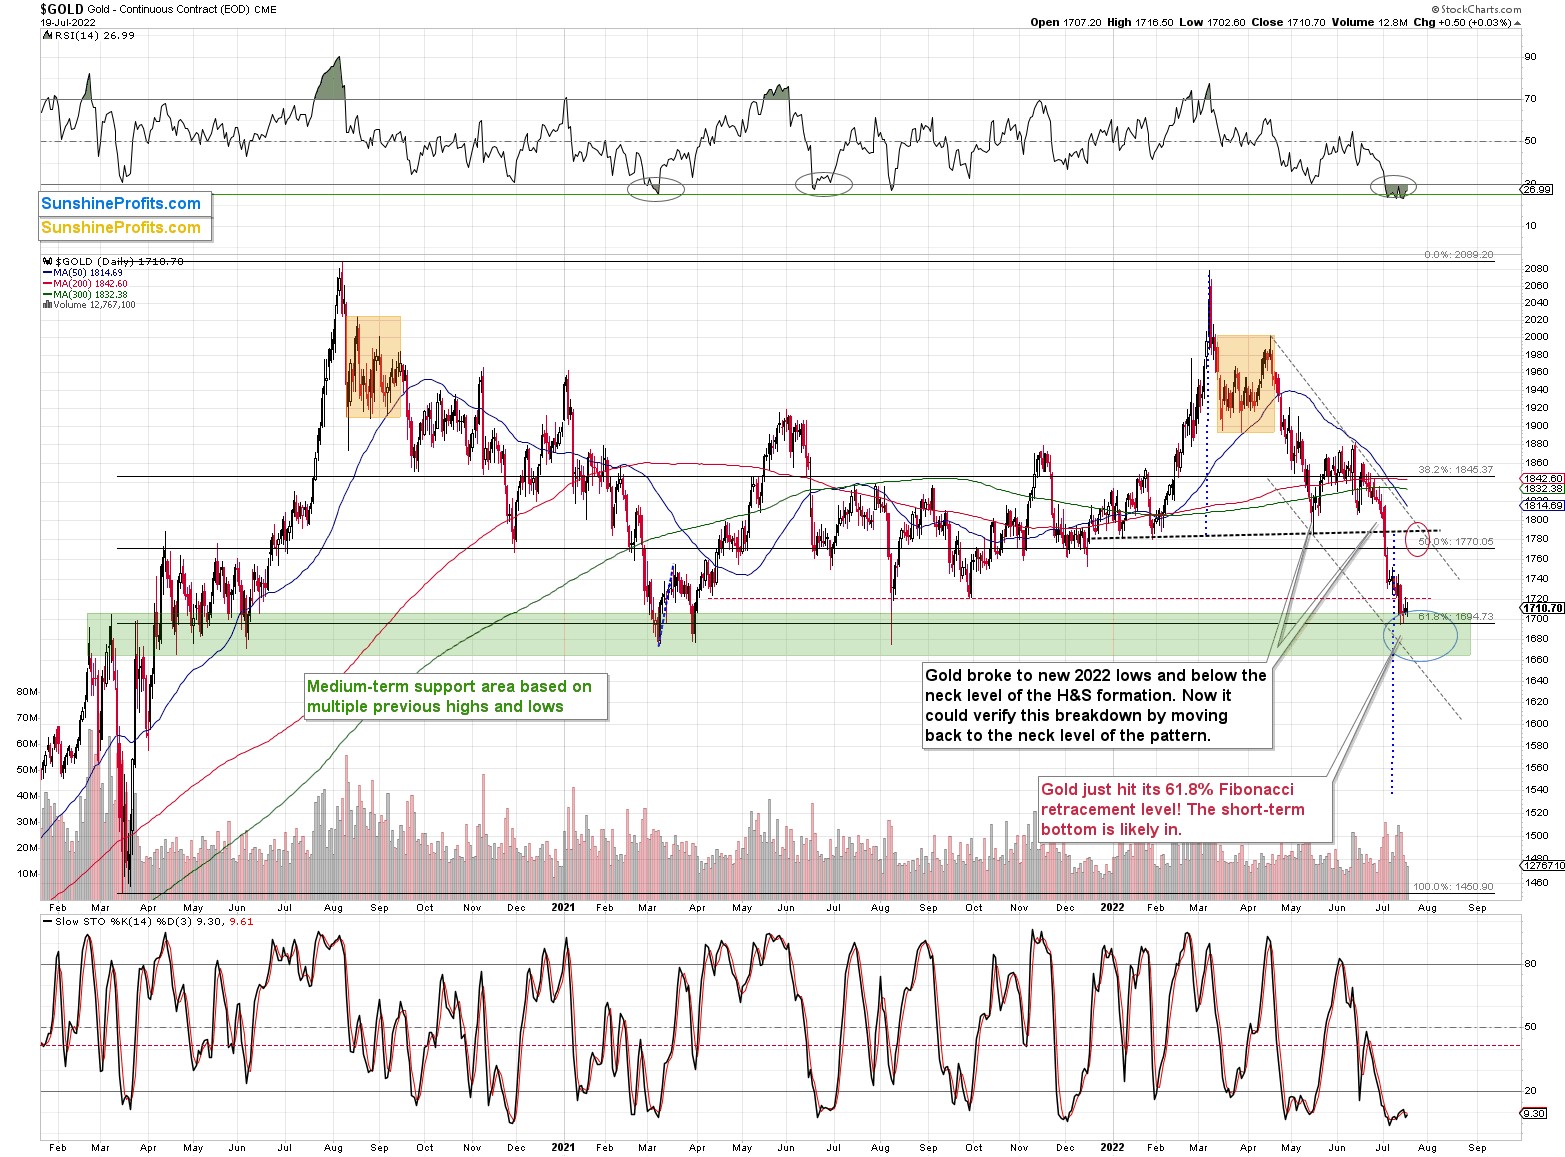
Gold, on the other hand, is not above its early-July low. It’s barely up from its July 14 bottom.
The RSI remains very oversold, suggesting that gold hasn’t started its rally just yet, but that it remains poised to soar. After all, in RSI terms, gold is now more oversold than it was at its 2020 bottom.
Speaking of 2020, gold recently bottomed practically right at its early-2020 high. To be clear, it was one of the levels that created strong support close to the $1,700 level. Either way, this means that gold is likely to rally any day now.
So, what is gold waiting for? Why isn’t it rallying, especially given that the USD Index is declining and the EUR/USD currency pair is rallying?
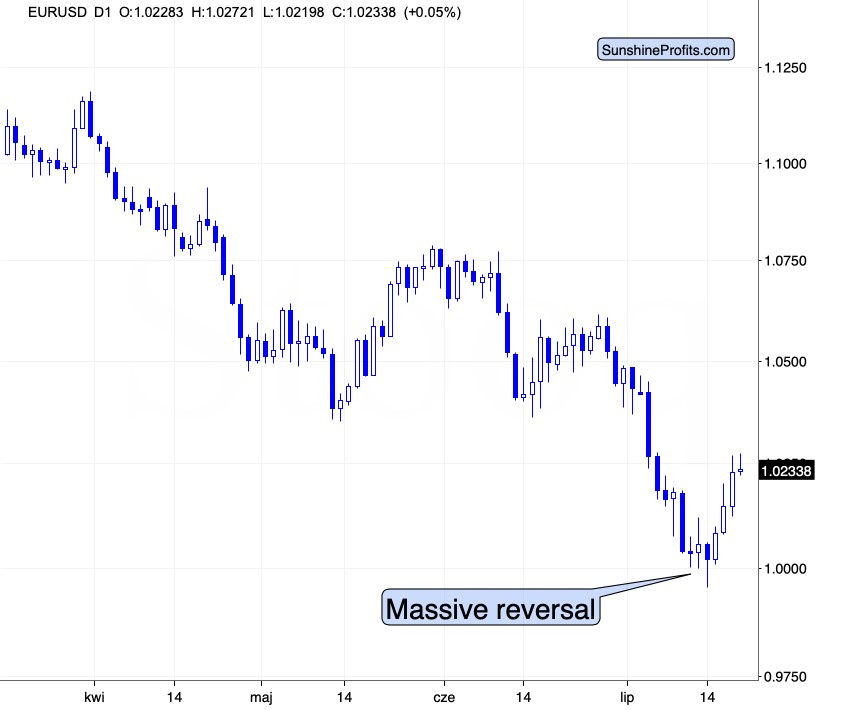
As a reminder, the EUR/USD pair reversed in a profound way after trying to break below the all-important 1 level. For a brief moment, the U.S. dollar was more expensive than the euro, and it triggered a reversal, just as I had indicated.
The answer to the why-not question could lie in Europe. More precisely, in the Eurozone and this week’s interest rate decision, which is due tomorrow (Thursday, July 21). It’s not a matter of what will or will not be said and done. It’s a matter of the uncertainty that will be present until it’s known what the status is (for now). Based on that, we could see some chaotic price movement on an intraday basis. However, once a decision is made and the markets know what’s going on, the traders might finally want to enter the trades that they are now allowing themselves to enter right now, adopting the wait-and-see approach.
Please note that the above is just one of the possible triggers for gold price moves, and it could actually be something else that directly triggers the move. What it will be is of relatively small importance. What is much more important is the pressure that has built up for gold to rally. The USDX decreased, and junior miners are already moving higher. The RSI below 30 is like a coiled spring, just waiting to expand rapidly. Given the ECB’s looming decision, it seems that we won’t have to wait long for gold to finally move and correct some of its recent declines.
All in all, it looks like the precious metals sector is going to rally and probably top close to the end of this month as the USD Index pulls back after a sizable rally.
Read Full Story »»»
DiscoverGold
Something may finally be stirring with gold and gold stocks
By: Jay Kaeppel | July 20, 2022
Human nature never changes - which is why analyzing sentiment can be valuable. Just as traders finally start to throw in the towel regarding gold and gold mining stocks, several useful catalysts suggest the potential for a significant move soon.
Read Full Story »»»
DiscoverGold
from time to time i have pushed this info out to people. although Yellen has a new role, looks like she was meant to be there when it happens, as with Biden the drug lord of his son.
Buckle up butter cups, its coming full circle soon.
Bernanke began the conversation in a cheerful mood…
Ben: Saw you on TV yesterday.
A woman’s voice, said to be that of Janet Yellen, replies.
Janet: Well, you know what it is like.I’m now competing with the presidential election news cycle. And Trump is getting all the page views now.
Ben: But wow! I like the way you turned it around…
Janet: What do you mean…?
Ben: I mean… that “cautious” thing. You managed to get almost every news agency in the world to say you were “cautious.” Heh heh. Makes you sound prudent.And this is after you and I together put about $4 trillion of new cash into the system… we must have induced other central banks to pony up another $8 trillion or so… and now there are about $650 trillion in open derivative contracts.
Yeah… cautious! I love it. Just don’t strike a match…. Heh heh.
Janet: Oh, stop… I wasn’t the one who started this thing… You… [inaudible]. Besides, I’m learning from Trump. When he entered the race, we all thought he was a joke. But that’s the problem with politics – jokes get elected.Anyway, Trump’s trick is to always say something bold and outrageous. And vague. People don’t know what the f*** you are talking about. They can fill in what they want to hear. It makes me sound like a strong leader who is keeping her options open.
At the end of my speech to the Economic Club, I was even tempted to say “Investors love me!”
We Homeys Did It
At this point, static interrupts the conversation. Then the two voices become clear again…
Janet: You know, Ben, they should love us. And you and I should get more than just our pictures on TIME and a few million in speaking fees. After all, our yiddisher kops added more wealth to the world than Carnegie, Ford, Buffett, Gates… all of them put together.
Ben: But, Janet… Now that I’ve been out of the hot seat for a while, I’ve had a chance to think about it.
Janet: Think about what?
Ben: Well, the system and how it works.
Janet: Hey… That’s not allowed…
Ben: I know… but now that I’m a private citizen just shaking down the big banks for speaking fees… It’s payback time!
Janet: Yeah… I see you’re getting $400,000 a pop. Not bad…
Ben: Janet, just wait… you’ll get your turn…But seriously, I’m just wondering how it all fits together.
I mean… it seems like something very important has changed in a way that we didn’t recognize.
Janet: What’s that?”
Ben: When Nixon made that change in 1971 [eliminating the restraint on credit creation imposed by gold] nobody really knew what it meant. The gold bugs ranted and raved, but even they had no idea what would happen. Nobody really saw how it would change the system completely.Nobody… except maybe the damned French… ever asked to exchange their dollars for gold anyway. It didn’t seem to matter that we shut the window [ending the convertibility of dollars to gold at a fixed rate by closing the “gold window” at the Treasury].
But this is just coming into focus for me. It changes everything. We went from a savings-based money system to a credit-based system. And that’s a big change.
You following me? There is only so much money available from savings. So that naturally limits the amount of credit. But when you can create credit with just a few keystrokes on your computer… it’s a different thing entirely. You can have as much as you want.
But the guy who runs a liquor store… He stocks his shelves for total sales. He doesn’t care whether you spend cash or credit. As people spend more – on credit – he orders more bottles and hires a young man to put it on the shelves. He thinks there is more demand for his product. He expects it to last. So does everyone else.
So, the economy booms. That was the idea. That’s why we got our faces on TIME. We homeys did it. We manipulated the economy. We tricked people into thinking there was more demand than there really was. And all we had to do was keep interest rates a little on the low side…
Debt Is Deflationary
Again… the line gets fuzzy for a bit. Then the voices come back.
Janet: Ben… I’m going to hop off the line… I’ve got an FOMC meeting…
Ben: Hold on, Janet… Just a minute… I’ve got something figured out. It’s important…In the old system, people had to earn money before they could lend it. That imposed a natural limit on credit. You couldn’t lend it if you didn’t have it.
The scarcity of credit forced up the price of it. Interest rates never went to zero. So, savers were encouraged to save. And it forced investors and entrepreneurs to find projects that were worthy of precious capital. That’s what made the system work. It encouraged real capital formation and real wealth building. That’s how we got richer.
Now, all we’ve got is credit… unlimited credit. Banks’ cost of funds these days is so low it’s almost free. Nobody knows what anything is worth – because all prices are distorted by unlimited credit.
That’s what happened to the oil industry. Oil was $140, and then it was $30. You don’t know what it should be. So nobody wants to take the risk or trouble to fund long-term projects. We don’t build much real wealth any more. We just speculate. Short term. And the amount of credit in the system just goes up and up.
But the dark side of credit is debt. You have to pay interest on it… and eventually pay back the loan. So, as your debt increases, it takes more and more of your income to make the debt payments, leaving you less to spend. This means you have to borrow more – increasing your debt – just to maintain the same level of spending.
We know our income is not keeping up with our debt levels. Debt was about one and a half times GDP in the 1970s. Now, it’s three and a half times.
I know lower interest rates airbrush the picture… so the debt burden is not so obvious. But unless we’ve eliminated the credit cycle, we have to assume rates will one day turn up again. Then, the cost of all this debt will suddenly hit us – hard. It will take a big chunk out of current spending… leading to those “D” words that you can’t use in public.
The gloom and doomers were right all along. But they didn’t understand any better than anyone else how it really worked. They kept expecting inflation. And it never came. So, they went broke and went away.
Debt is not inflationary. It’s deflationary. You either earn your way out… or you reach a limit, and the economy melts down. And here’s the thing: The super abundance of credit reduces real growth. That’s the thing I just realized. The more credit you make available… to try to ‘stimulate’ the economy… the more you stimulate speculation and suppress real growth. Less real growth means less real income to pay your debt.
So, there’s really no way out… because the debt is slowing down the economy it depends on, like a huge leech that is killing its host. You eventually end up in a Minsky Moment… [when asset values plunge after a long period of speculation and unsustainable growth]…
What are you going to do then?
Janet: You’re asking me?
Ben: Yea… Janet. I know what I’m going to be doing – collecting more big bucks for telling Goldman how you screwed up. Heh heh.What are you going to do?
All afternoon as expected, central bank whack a mole, they are expert players.
Still seeing tamper signals. Maybe 1710 spot will be bottom?
How to Become Strong After a Massive Decline? Ask Gold Miners!
By: P. Radomski | July 18, 2022
Gold, silver, and miners declined heavily in the past weeks, but it seems that they got too low, too fast, and now a quick rebound seems very likely.
On Friday, junior gold miners once again refused to decline below the $30 level, indicating that a rally was probable, which added to the list of bullish signals for the short term.
Interestingly, junior miners are now the strongest part of the precious metals sector (at least among its popular parts).
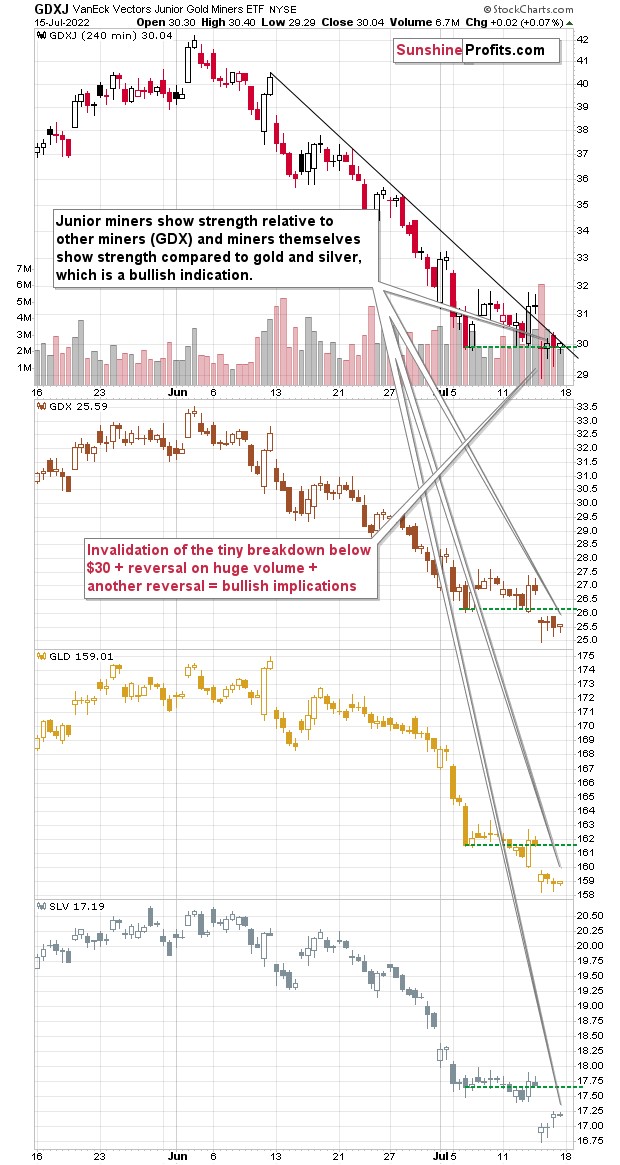
Junior miners (the GDXJ ETF) are the only ones of the above that just closed above their early-July lows. Senior miners (the GDX ETF) are only a little below their own early-July low, but gold (GLD) and silver (SLV) are much below their respective early-July lows.
Why would junior miners be so strong right now? One simple reason – because they had been so weak in the previous weeks. It’s not only a given market that usually (it’s almost always the case) doesn’t go up or down without periodic corrections, but one market’s relative performance to other markets.
So, what we see here, is not necessarily a reflection of junior miners’ “true strength,” but it’s just that since they have fallen the most, they are now bouncing more visibly. That’s likely it. Still, it seems that choosing junior mining stocks as a proxy for our current long position was a good idea.
Either way, the above chart provides us with one additional important detail.
The thing is that the GDXJ closed on Friday just a little below its declining short-term resistance line. The previous attempt to rally above it was invalidated, but given their relative strength, the recent reversals (one formed on huge volume), and the fact that GDXJ was quick to invalidate a tiny breakdown below $30, all suggest that a move higher is just around the corner.
In fact, looking at GDXJ’s performance in today’s early London trading, it seems very likely that it will be able to break above the above-mentioned declining resistance line this time.
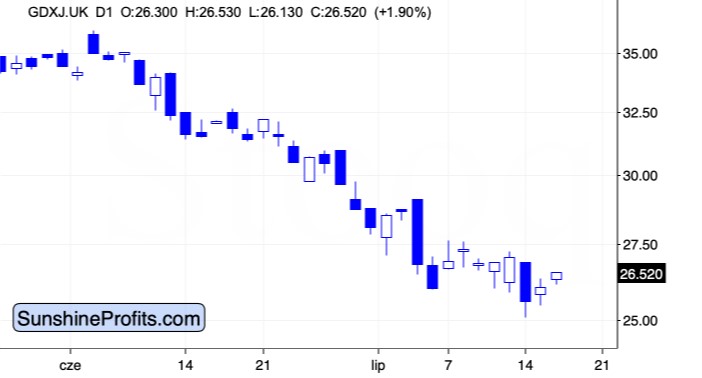
Gold and silver futures are both up in today’s pre-market trading as well, and so is the general stock market. At the same time, the USD Index is down.
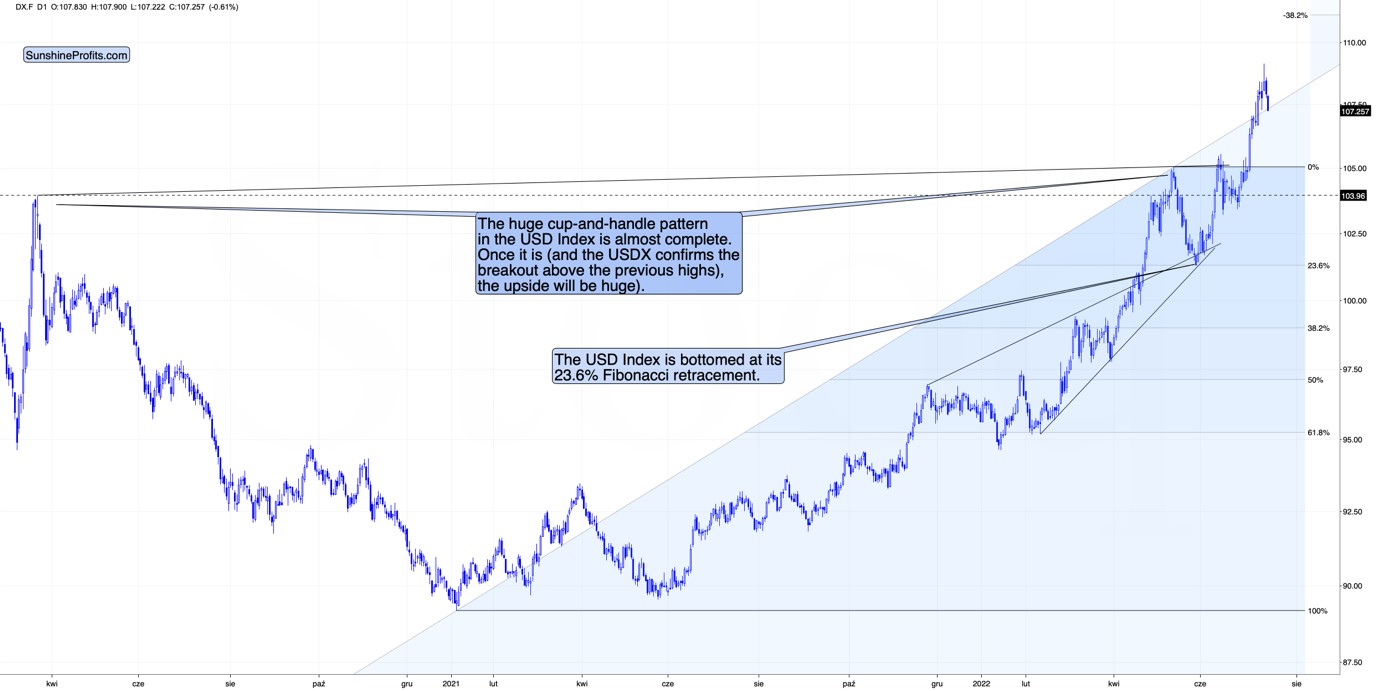
This is in perfect tune with what I wrote previously – the USDX reversed in a big way recently while reaching its long-term resistance.
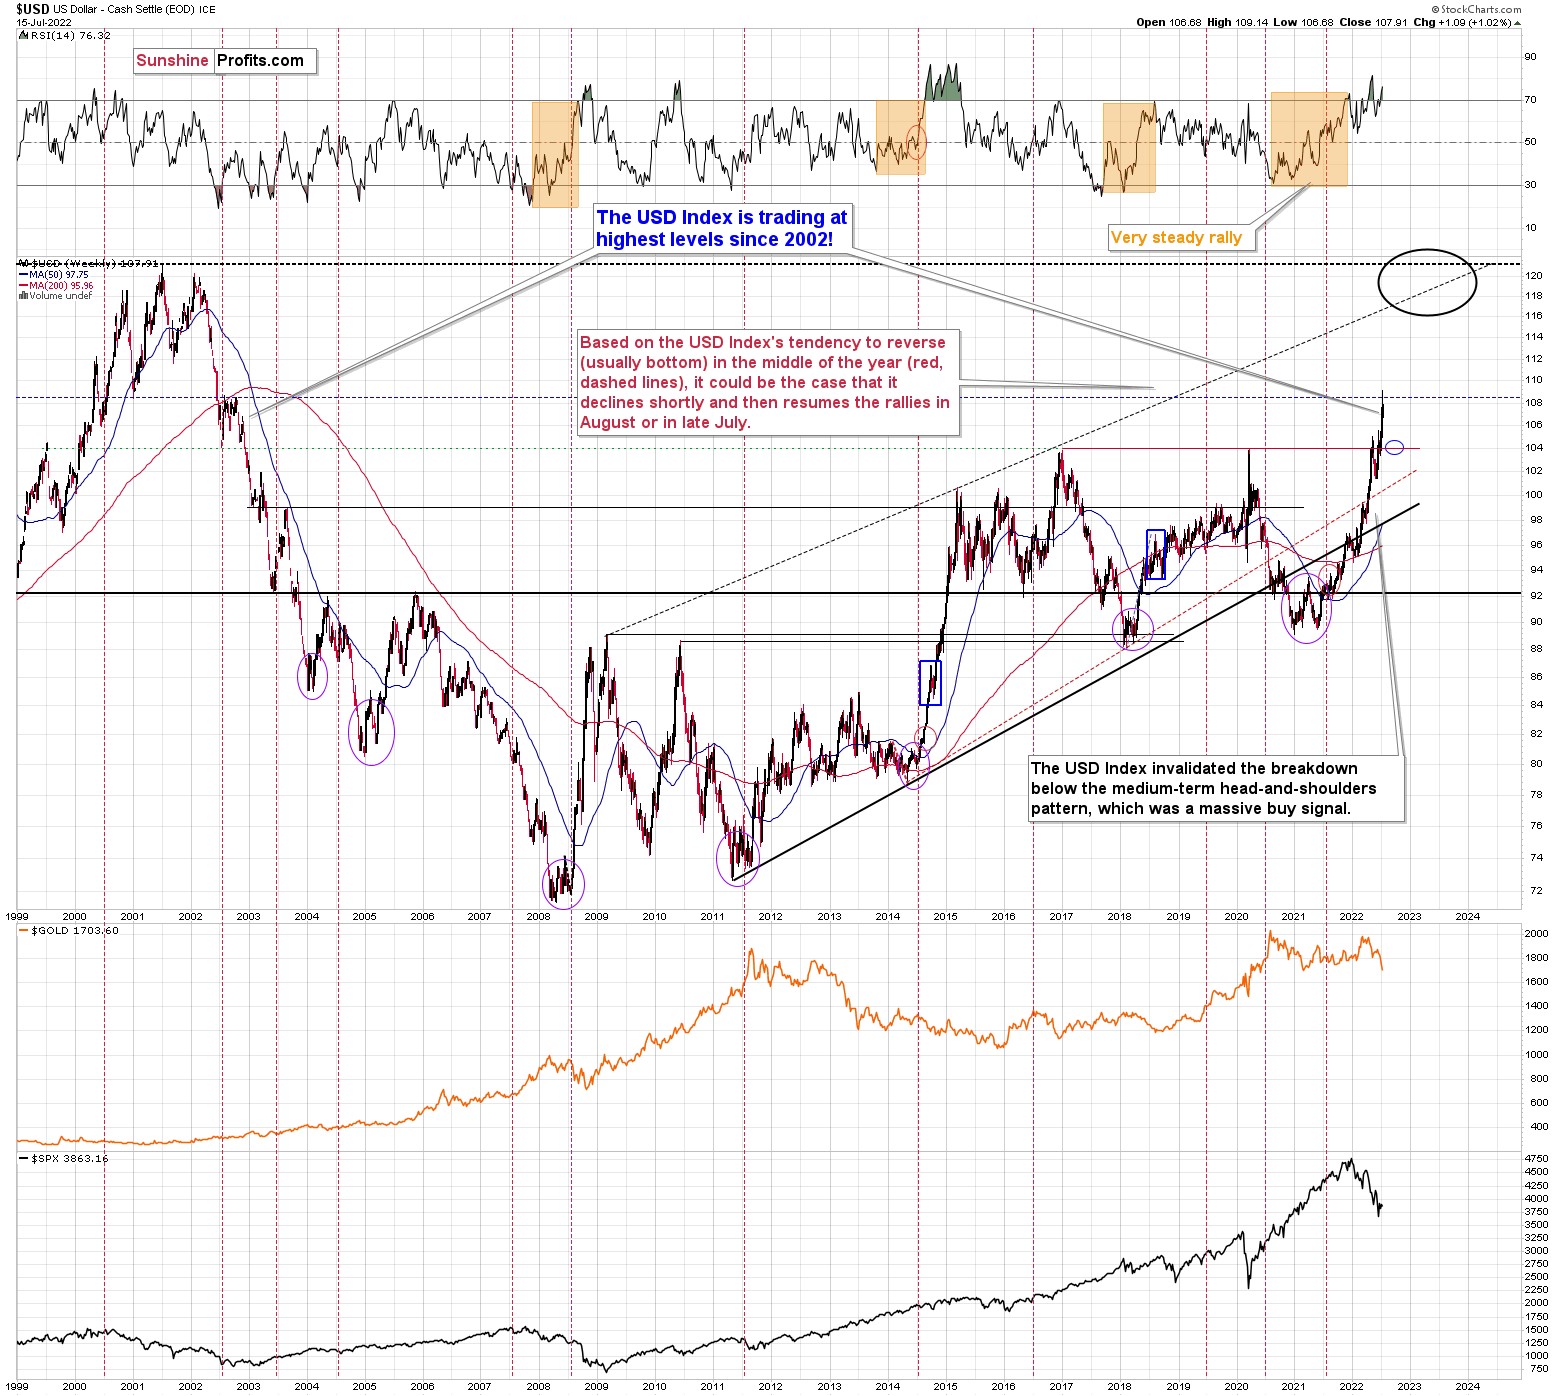
Consequently, my previous comments on the above chart remain up-to-date:
The USD Index has quite likely formed a short-term top here, and it’s now likely to correct. How low would the USD Index be likely to move? Quite possibly to the 104 level or so, as that’s where we have very strong medium-term support. This support level is strengthened by the 1999 high (approximately), the 2002 low, the 2016 high, and the 2020 high – all very important highs.
Additionally, please note that the middle of the year is just around the corner, and that’s when the USD Index usually reverses, and it’s usually the case that those reversals are bottoms. I marked those cases with vertical red dashed lines. So, if the USD Index continues to correct here (and I think that it will), the decline might be rather short-lived.
All in all, it looks like the precious metals sector is going to rally and probably top close to the end of this month as the USD Index pulls back after a sizable rally.
Summary
Summing up, it seems that while the medium-term trend in the precious metals sector remains down, we are likely to see a corrective upswing soon. Based on the confirmations that we have seen recently (e.g. junior miners’ relative strength and reversals), the short-term outlook is bullish.
Read Full Story »»»
DiscoverGold
Someone, I believe it’s central banks, sending signals to tamp gold down. Makes sense since dollar is further eroded with no understanding in government, other than to try and manipulate things with freshly printed money to play games with gold futures.
Gold Market Update - Renewed Advance Imminent As Central Banks Create More Cash To Shore Up Debt Market...
By: Clive Maund | July 17, 2022
The debt market has been perilously close to locking up in recent months which would quickly lead to the entire financial system freezing and banks slamming their doors and ATMs not working etc. This is the reason for the heavy selloff across markets that has also affected commodities and driven the dollar higher. So Friday’s announcment that the ECB is to engage in “unlimited bond buying” to stabilize the debt market was a major positive development for markets because other Central Banks, including and especially the Fed, are expected to follow suit which will get markets “off the hook” over the short to medium-term. However, this action will only buy time because the debt monster is now so big that the quantities of money required to feed it are gargantuan and because this requirement has grown exponentially it has now gone vertical, which means that we are in the end of the end of the endgame, so after this final spectacular blowoff that will lead to hyperinflation, credit markets will fly apart anyway as this latest fiat experiment comes crashing down into a smoldering heap of ruins. It’s at this point that they will roll out their new digital money system, which will involve a Chinese style social credit score system and digital passport etc., and if you don’t obey their rules, such as being fully “vaccinated” you will be shut out of it. This will be the means by which they force compliance with their system so that they can achieve their population reduction and control objectives. With money creation now rising vertically to feed the beast and stop the system locking up, we may be only months away from this happening, and it should be kept in mind that this is not accidental – it is all happening by design.
Given how inflation has been ballooning in the recent past it is surprising how much gold has fallen in recent weeks as we can see on its latest 6-month chart, but this has been largely due to the prevailing risk-off environment and associated margin calls. However, the ECBs Friday announcement should result in a swift reversal in sentiment leading to a rally, and as we can see on the chart, it is well placed to rally, having arrived at the lower boundary of its intermediate downtrend channel in an oversold state.
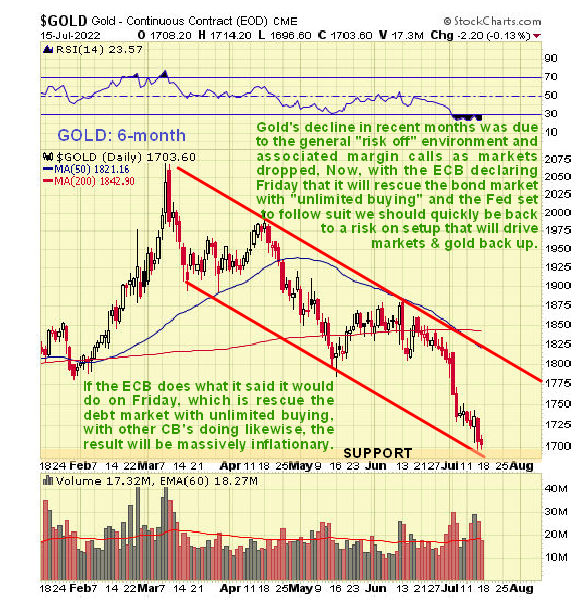
Gold’s 3-year chart makes two important points clear. One is that, because gold’s recent downtrend has brought it down to strong support approaching the lower boundary of the large rectangular trading range that has formed since the August 2020 peak, there is a higher likelihood of it reversing to the upside here. The other is that, because it has not broken down from this trading range, it is not in a bearmarket, and if we move towards hyperinflation this large range could turn out to be a consolidation pattern in an ongoing bullmarket. Additionally we can see that it is heavily oversold on its MACD indicator, so this is a good point for it to turn higher.
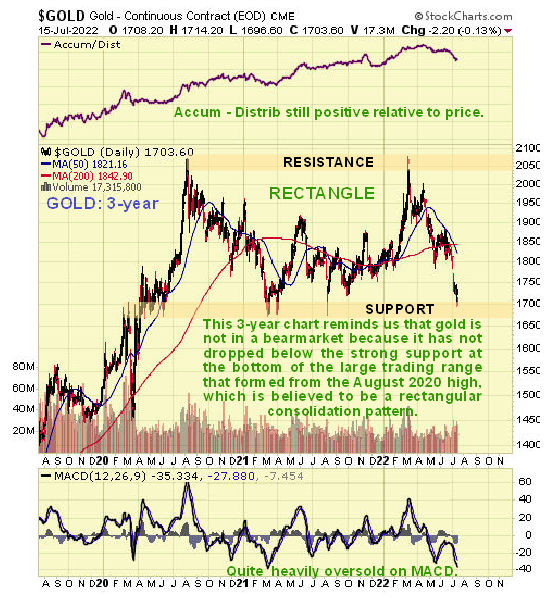
On gold’s long-term 15-year chart we can see that the rectangular trading range that has formed from mid-2020 could be either a consolidation pattern or a top. What happened in Friday’s promises a rally from the support at the lower boundary of the range at least to the top of it. However, the support at the bottom of this range must hold, if it later fails as a result of a general market crash occasioned by a severe credit crisis, then gold would probably plunge along with everything else, however the risk of this has been reduced for now by imminent renewed Central Bank intervention. If the Cetral Banks now pump in the ditection of hyperinflation then gold should fly off the to´p of this chart.
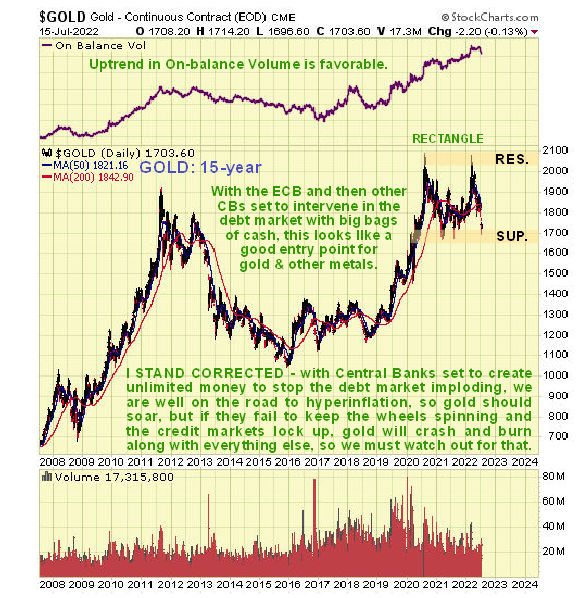
Gold’s latest COT chart is most encouraging as it shows that the normally wrong large Specs have reduced their long positions to the lowest levels for at least a year, which makes a reversal into an uptrend all the more likely, and here we should note that have not been net short gold for many years…
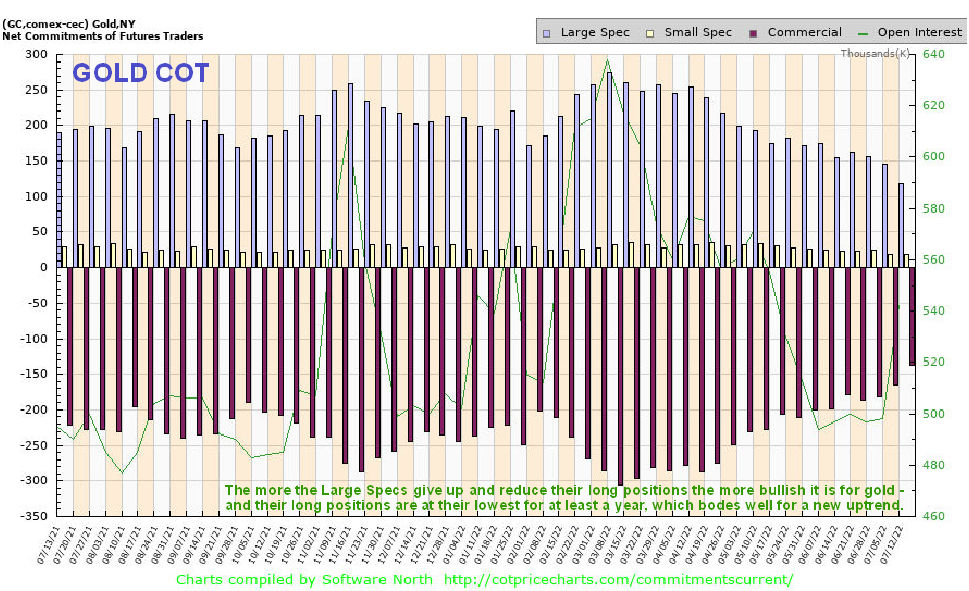
It is worth us taking a sideways look at copper here, because copper is often an advance indicator for the economy, hence its nickname Dr Copper, and these days it is something of a barometer for the Chinese economy because China uses so much of it. As we can see on its latest 6-month chart, copper has really been “taken to the woodshed” in recent weeks, suffering a nasty drop after failure of a key support level. This implies economic contraction ahead. However, it has dropped so far so fast that it is now extremely oversold – it is at its 3rd most oversold point in the past 20 years – on a sharp plunge late in 2011 it got a little more oversold and it got considerably more oversold on just one occasion, at the end of a severe plunge late in 2008 induced by the general market crash at that time. It is critically oversold on its RSI indicator and deeply oversold relative to its 200-day moving average so taking all these factors into account it is certainly entitled to a bounce.
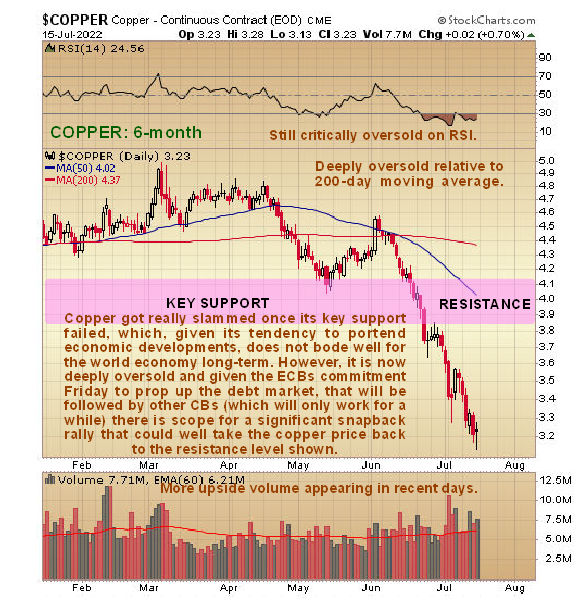
On copper’s 3-year chart we can see the reason technically that copper has dropped so steeply in recent months – it broke down from the large trading range that it had been stuck in for about a year from mid-2021, and of course the support at the lower boundary of this range is now a resistance level. Its hugely oversold condition coupled with the fact that it is now in a zone of quite strong support arising from trading late in 2018 and early in 2019 together with the probable shift back to risk on conditions makes a snapback recovery rally likely which would probably take it back up to resistance at the underside of the trading range.
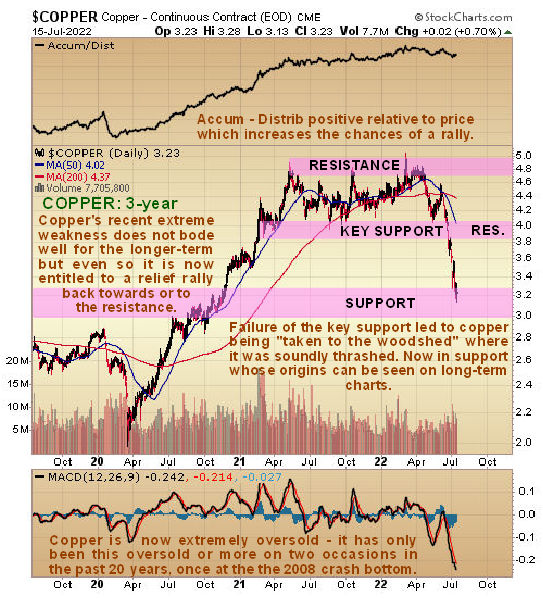
Another important factor that increases the chances of a recovery rally in copper is the fact that the normally wrong Large Specs, having gotten it spectacularly wrong being long copper back in the Spring, have now switched to being heavily short, suggesting a rally soon, as can be seen on the latest COT chart for copper. This of course begs the question “If the Large Specs keep losing money, how do they keep going?” – the answer is that they don’t, but as they fall they are replaced by more like them, kind of like British soldiers marching in lines towards machine guns at the Battle of the Somme.
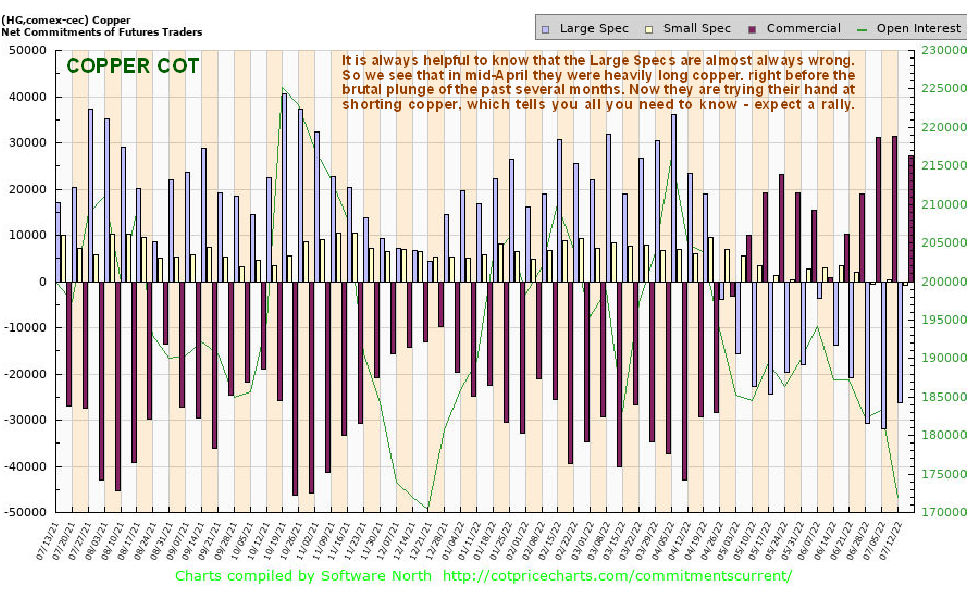
The risk off environment that has triggered big declines in metals prices in recent months has also contributed to a flight to safety into the dollar along with Emerging Markets struggling to service their dollar debts. So now we will take a quick look at the latest charts for the dollar index.
On the 6-month chart for the dollar index we can see that the further falls in gold and silver this month were partly or wholly due to strong gains in the index this month. However, we can also see that a bearish “shooting star” candle formed in the dollar index Thursday, suggesting an imminent reversal which was followed the next day – Friday – by another bearish candle that completed a “bearish engulfing pattern” about the time of the ECB announcement. The candles in the dollar index late last week suggest that it is reversing into a decline.
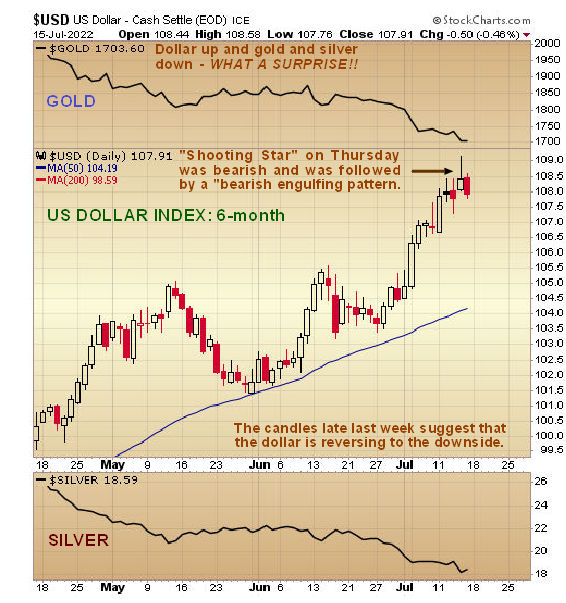
Thus it is most interesting to observe on the long-term 9-year chart for the dollar index that it has been accelerating higher in a parabolic slingshot move which, since it has gone vertical, suggests it is making a blowoff top right now. If it breaks down from this parabolic uptrend shortly it could drop hard – hardly surprising considering how much money the Fed is likely to create to save the debt market - and clearly, if it does, it will be very good news indeed for Precious Metals prices and base metal prices as well.
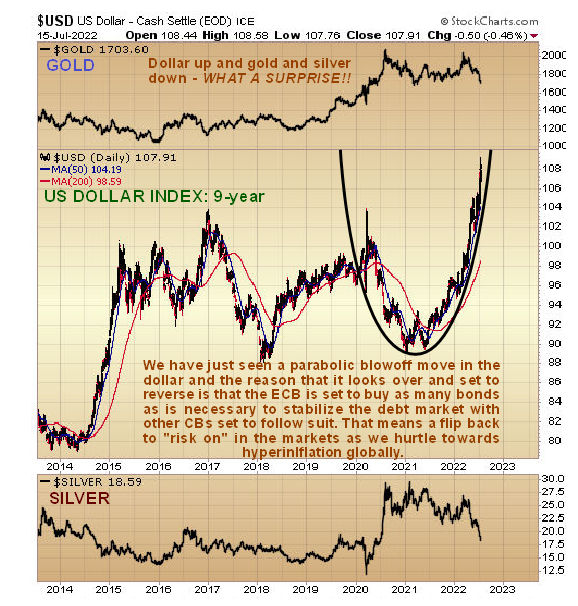
Read Full Story »»»
DiscoverGold
Forecast: Gold's Extended Downward Phase
By: Jim Curry | July 17, 2022
Recapping Last week
Gold saw its high for last week made in Wednesday's session, with the metal spiking up to a post-CPI peak of 1744.30. From there, however, a drop back to lower lows for the swing was seen into later in the week, here hitting a Thursday bottom of 1695.00 - before bouncing off the same into Friday's session.
Gold's Short-Term Picture
For the very near-term, the recent downward phase for Gold continues to work on an extended low, which should come from the combination of 10, 20 and 34-day cycles. The middle 20-day component is shown on the chart below:
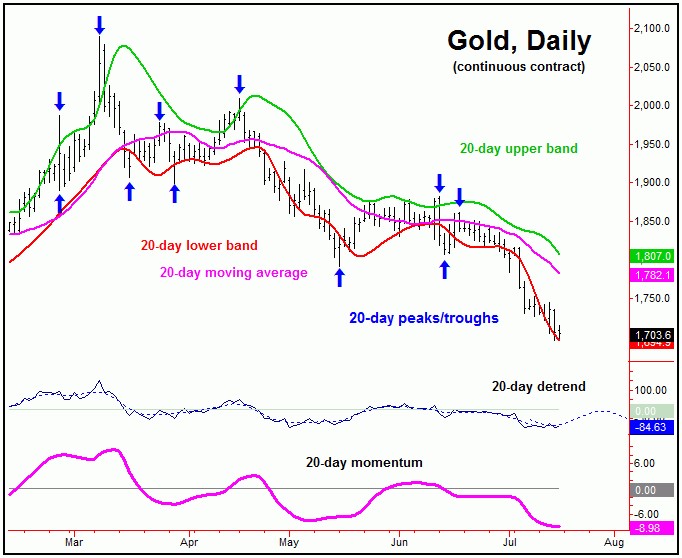
With the recent price action, our upside reversal point for the combination of 10, 20 and 34-day cycles moves to the 1745.80 figure (August, 2022 contract), where it could continue to drop as we move along. Basically, any reversal back above that figure - if seen at any point going forward - would be our best indication of a turn higher with the these smaller-degree waves.
Going further with the above, taking out the 1745.80 figure would favor additional strength into what could be late-July to early-August timeframe. That rally would be favored to see the 20 and 34-day moving averages acting as the price magnets, with the latter due to the position of the 34-day component, which is also shown:
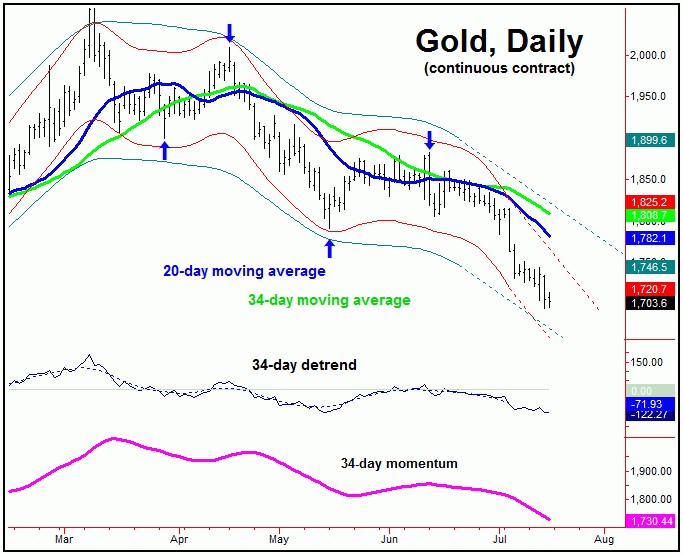
Otherwise, holding below the 1745.80 figure will keep the metal in a bearish position short-term, still with the potential for lower lows for the extended downward phase.
Due to the position of the larger 72 and 310-day cycles, the probabilities will favor the next short-term rally phase with the 10, 20 and 34-day waves to end up as a countertrend affair - holding well below the 1882.50 swing top. If correct, a late-July to early-August peak would have resistance around the aforementioned 34-day moving average, which is also at or near the declining 72-day cycle channel.
Gold's 3-8 Week View
Stepping back further, as noted in more recent articles, the downward phase of the larger 72-day cycle is also deemed to be in force, with its next trough projected to form around mid-August or later. Here again is our 72-day component:
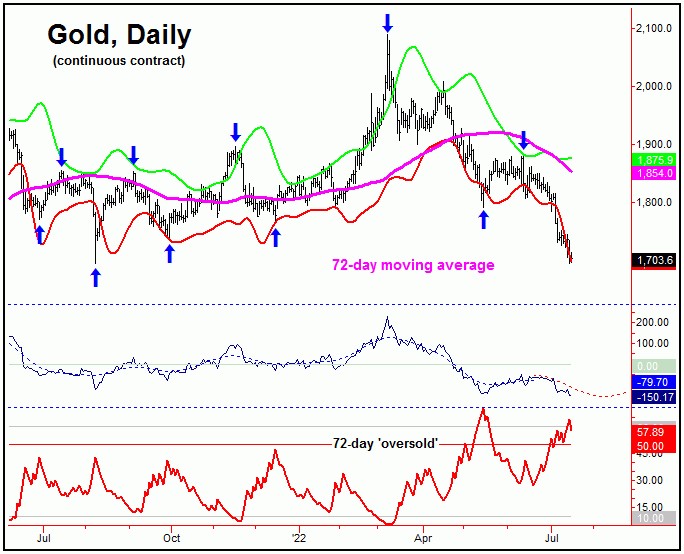
Of key note is that our 72-day 'oversold' indicator (which moves inverse to price action) is already above its upper reference line - along with price currently below our lower 72-day cycle channel. The combination of these are normally seen near price lows for this wave, though this is actually more key when the cycle itself is into normal bottoming range. This won't be the case until at least early-to-mid August.
With the above said and noted, a short-term rally with the smaller-degree (10, 20 and 34-day) waves - one that gives way to lower lows into mid-August or later - would then be favored to bottom this 72-day cycle. From that low, we would expect to see another try at the 72-day moving average or better into what looks to be the early-to-mid September region - a move which would also be favored to end up as countertrend, due to the position of the larger 310-day component:
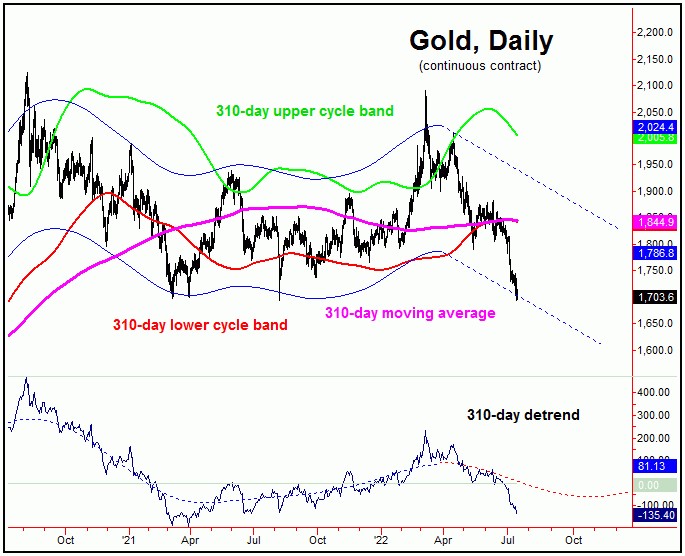
In terms of price, the next upward phase of the 72-day cycle should see resistance somewhere around the 72-day moving average, the upper 72-day cycle band - and the 310-day moving average. If correct, a countertrend peak with the 72-day wave into early-to-mid September would be expected to give way to a final drop to lower lows into October, before the next mid-term trough forms with our larger 310-day wave.
In terms of price, unless hit beforehand, there is the potential for a drop to the 1650's or lower as this larger 310-day cycle bottoms out in the coming months. Once that low is complete, a sharp rally of some 20-25% or more will be expected to play out in the months to follow, as the next upward phase of this 310-day wave assumes control of the Gold market. More on all as we continue to move forward.
Read Full Story »»»
DiscoverGold
Must listen to podcast. Stockman straight up analysis and nutjobs in charge.
Still No Confirmed Bottom In Metals
By: Avi Gilburt | July 14, 2022
• Following the Elliott Wave analysis:
As the metals continue to “leak” to marginally lower lows, we still have no evidence that the complex has bottomed despite the fullness of the downside structure.
When we look at the GLD daily chart, we see that the a=c target is actually a bit lower than where we currently reside. And, I think it is quite reasonable to assume we will get to that target in the coming weeks. Moreover, it also suggests that we still see a 4th wave bounce before we see a 5th wave complete this long term correction down to the a=c target region.
As far as the divergence I want to see in the chart, consider that the a-wave bottom still provided us with a lower low in the MACD relative to where we currently reside, even though price has certainly dropped lower. So, the positive divergence set up still remains in place. Ideally, I still want to see the MACD come up off the floor during a 4th wave bounce, which I still believe is quite imminent. And, when that occurs, I believe that all lower lows thereafter are strong buying opportunities.
In both the GDX and silver, we are still “leaking” lower as well, as the market strikes marginally lower lows. But, the divergences still remain quite evident on the chart. Yet, until we have a 1-2 off the lows fill in, we have no strong suggestion that a bottom has been struck. In repeating what I noted earlier, the GDX still has more potential for a long term bottom as being struck down here, as the wave count is much more full in that structure. Yet, the silver chart still more strongly argues for a [iv][v] before a final bottom is struck in the coming weeks. But, as I have also noted, I would be glad to admit that this perspective is wrong if we see a clear 5-wave rally off the low, followed by a corrective pullback and follow through over the high of the initial 5-wave rally.
For now, I still remain in the “bottoming”” camp for the metals complex. Yet, I have no clear indications that the lows have indeed been struck. But, the one thing that does strike me is that those who are aggressive in their positioning and buying into this decline will likely be quite pleased when they look back a year from now. Yet, for those that are more conservative, I strongly suggest that you allow the initial (i)(ii) to develop off the lows before you consider moving into this complex.

GDX8min

GDXdaily

GLDdaily

Silver-144min
Read Full Story »»»
DiscoverGold
Rally Time in the Gold Stocks
By: Jordan Roy-Byrne | July 17, 2022
The gold stocks are extremely oversold. That’s obvious.
However, selling pressure has waned since the end of June. The daily candles have been mild, suggesting less and less distribution.
The last three days mark three consecutive days of accumulation candles for the first time in months.
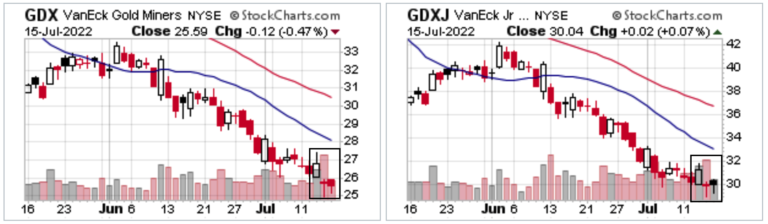
These candles come amidst an extreme oversold condition.
We plot GDXJ below along with our custom indicators. Each of the three indicators has hit the most extreme level in over seven years. GDXJ is the most oversold it has been since the end of 2014.
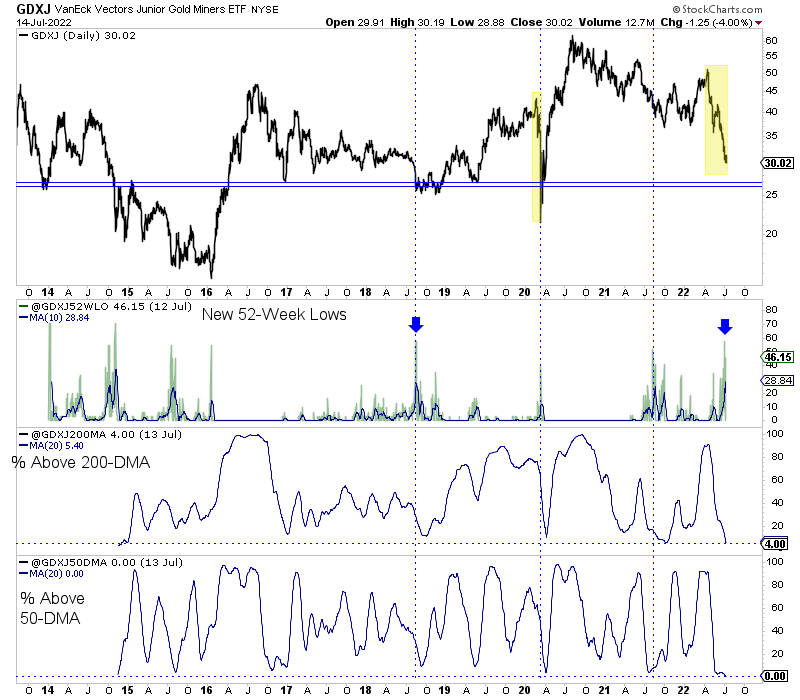
The large-cap miners are not quite as oversold as GDXJ, but they are close.
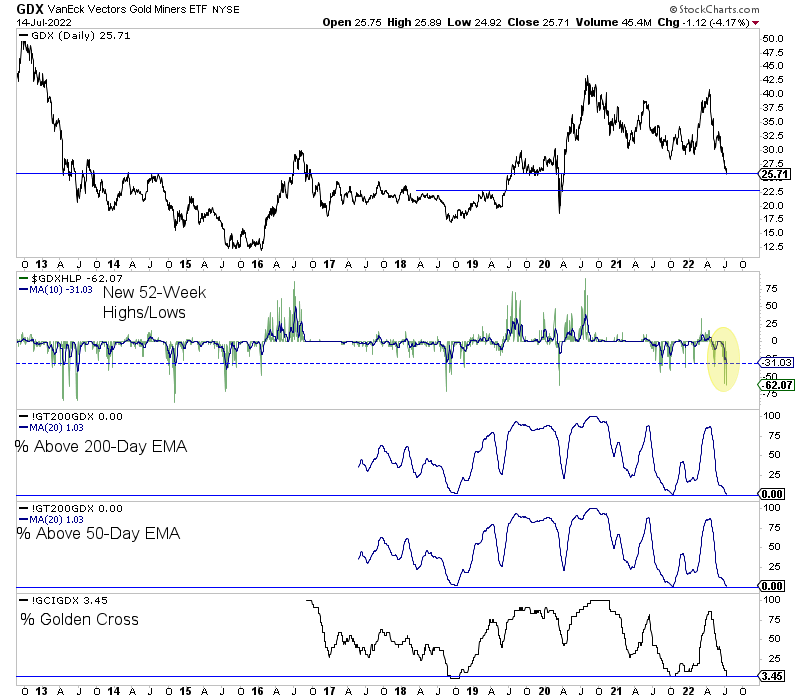
In re-assessing support levels in the gold stocks (after last week), I came up with the following (in the image below).
GDX, GDXJ, and the HUI all have begun to stabilize at their respective first support levels.
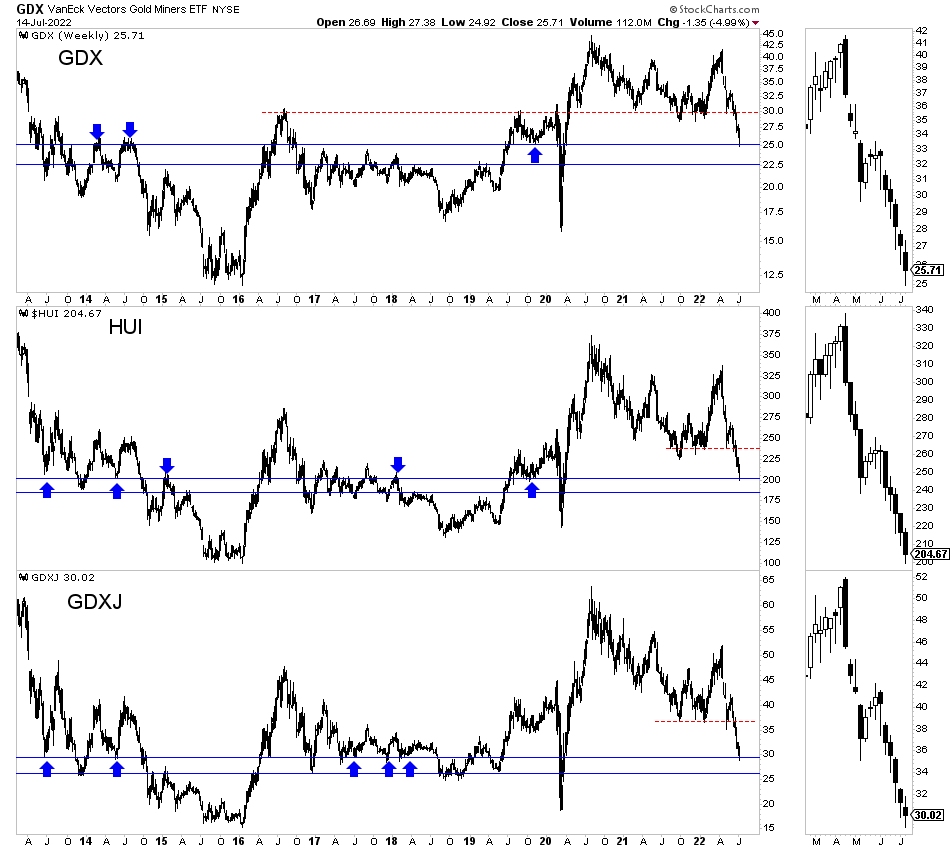
The path of least resistance for the gold stocks in the short-term is higher. Even when they were extremely oversold in 2008, 2013, and 2014, they enjoyed a relief rally before more selling.
Whether this rebound will be sustainable will depend on the market’s view of Fed policy. If the market anticipates the Fed hiking past September several weeks from now, then this rally will be sold. However, if there is a growing belief that July or September is the last hike, this rally could be the start of something big.
Read Full Story »»»
DiscoverGold
Jack Chan: Gold Price Exclusive Update
By: Jack Chan | July 16, 2022
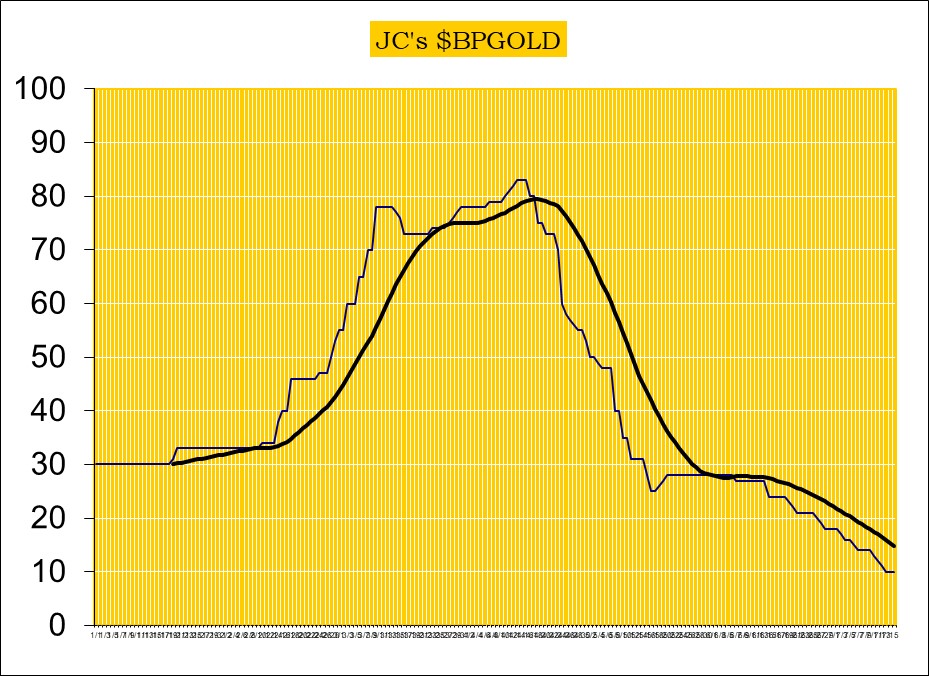
Our proprietary cycle indicator is down.
To public readers of our updates, our cycle indicator is one of the most effective timing tool for traders and investors. It is not perfect, because periodically the market can be more volatile and can result in short term whipsaws. But overall, the cycle indicator provides us with a clear direction how we should be speculating.
Investors
During a major buy signal, investors can accumulate positions by cost averaging at cycle bottoms, ideally when prices are at or near the daily 200ema.
During a major sell signal, investors should be hedged or in cash.
Traders
Simply cost average in at cycle bottoms when prices are at or near the daily 200ema; and cost average out at cycle tops when prices are above the daily 50ema.

Gold sector is on long term SELL signal as the recent buy signal has failed.
The correction since 2020 drags on.

GLD is on short term sell signal.

GDX is on short term sell signal.

XGD.to is on short term sell signal.

GDXJ is on short term sell signal.
Analysis

Speculation at the lowest level in two years.

Our ratio is on sell signal.

Trend is up for the dollar.

Trend is down for gold stocks.

Trend is down for gold also.
Downside target is the 200ema support.

The decade long cup with handle remains in progress.
Summary
Long term – on SELL signal.
Short term – on sell signals.
Gold sector cycle is down.
$$$ We are now holding trading positions as no core positions should be held during a long term sell signal.
Read Full Story »»»
DiscoverGold
NY Gold Futures »» Weekly Summary Analysis
By: Marty Armstrong | July 16, 2022
The NY Gold Futures closing today at 170360 is immediately trading down about 6.83% for the year from last year's settlement of 182860. Caution is now required for this market is starting to suggest it will deline further on a monthly level. Up to this moment in time, this market has been rising for this month going into July reflecting that this has been only still a bullish reactionary trend. As we stand right now, this market has made a new low breaking beneath the previous month's low reaching thus far 169500 while it's even trading beneath last month's low of 180250.
Up to now, we still have only a 1 month reaction rally from the low established during May. We must exceed the 3 month mark in order to imply a trend is developing.
ECONOMIC CONFIDENCE MODEL CORRELATION
Here in NY Gold Futures, we do find that this particular market has correlated with our Economic Confidence Model in the past. The Last turning point on the ECM cycle low to line up with this market was 2015. The Last turning point on the ECM cycle high to line up with this market was 2020 and 2011 and 1996.
MARKET OVERVIEW
NEAR-TERM OUTLOOK
The historical perspective in the NY Gold Futures included a rally from 2015 moving into a major high for 2020, the market has been consolidating since the major high with the last significant reaction low established back in 2015. The market is still holding above last year's low but is trading rather weak at this moment. The last Yearly Reversal to be elected was a Bullish at the close of 2020.
This market remains in a positive position on the weekly to yearly levels of our indicating models.
Focusing on our perspective using the indicating ranges on the Daily level in the NY Gold Futures, this market remains in a bearish position at this time with the overhead resistance beginning at 172160.
On the weekly level, the last important high was established the week of June 13th at 188250, which was up 4 weeks from the low made back during the week of May 16th. We have been generally trading down for the past 4 weeks, which has been a very dramatic move of 9.960%.
Looking at this from a broader perspective, this last rally into the week of June 13th reaching 188250 failed to exceed the previous high of 200300 made back during the week of April 18th. That rally amounted to only four weeks. Subsequently, the market has breached that low of the week of May 16th and has closed beneath it warning the market is weak. Since then, the market has consolidated for the past 4 weeks. Right now, the market is below momentum on our weekly models casting a bearish cloud over the price action. Looking at this from a wider perspective, this market has been trading up for the past 1 week overall.
INTERMEDIATE-TERM OUTLOOK
YEARLY MOMENTUM MODEL INDICATOR
Our Momentum Models are declining at this time with the previous high made 2020 while the last low formed on 2021. However, this market has rallied in price with the last cyclical high formed on 2020 and thus we have a divergence warning that this market is starting to run out of strength on the upside.
DiscoverGold COT - Commitments of Traders in Metals Futures Market Reports
By: Software North | July 15, 2022
Gold
Silver
Read Full Story »»»
DiscoverGold
Im seeing a .535 cent dividend paid in December, are they an annual payer?
if you dont believe the dow to gold ratio log can be 1, well it was in 1980....so my estimate will be 1 something again by 2025.
the epicenter of primary wave 3 should be starting any day.....any day. Gold gonna blow minds in the coming months.
|
Followers
|
149
|
Posters
|
|
|
Posts (Today)
|
1
|
Posts (Total)
|
5670
|
|
Created
|
06/29/08
|
Type
|
Free
|
| Moderators DiscoverGold trunkmonk | |||

http://www.vaneck.com/index.cfm?cat=3192&tkr=GDX&LN=3-02
The Gold Miners ETF seeks to replicate as closely as possible, before fees and expenses, the price and yield performance of the NYSE Arca Gold Miners Index. The Index provides exposure to publicly traded companies worldwide involved primarily in the mining for gold, representing a diversified blend of small-, mid- and large-capitalization stocks. As such, the Fund is subject to the risks of investing in this sector.
| ||||||||||||||||||||||||||||||||||||||||||||||||||||||||||||||||||||||||||||||||||||||||||||||||||||||
| DAILY |
| WEEKLY |
| Volume | |
| Day Range: | |
| Bid Price | |
| Ask Price | |
| Last Trade Time: |


