 News
News  Market Data
  Discover
Support: 888-992-3836
Copyright © 2023 InvestorsHub Inc.


Register for free to join our community of investors and share your ideas. You will also get access to streaming quotes, interactive charts, trades, portfolio, live options flow and more tools.
Gold Price Forecast: Key Indicators and Targets
By: Bruce Powers | February 1, 2024
• Gold’s surge to a four-week high signals robust bullish momentum, supported by successful tests of key support and the potential for continued strength in the market.
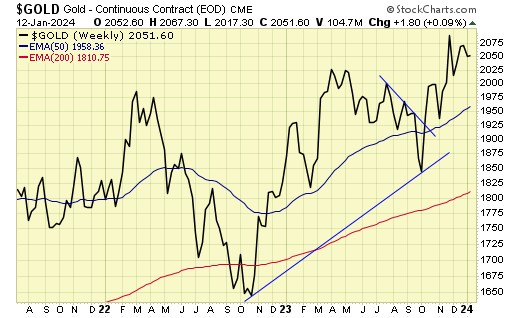
Bullish momentum in gold improved today as the precious metal hit a four-week high and a higher daily high. And it may be able to end Thursday’s session above Wednesday’s high of 2,056. It also exceeded the 2,062-swing high but could not hold above it. As seen yesterday as well, today’s low successfully tested support at the top of the pennant consolidation pattern, the downtrend line, and both the 20-Day and 50-Day MAs.

Successful Test of 50-Day Moving Average Support is Bullish
Notice that the two moving averages have converged and therefore identify a similar price level. That is the market telling us that it recognizes the moving averages. Having them together at the breakout area, along with the downtrend line, increases the significance of the breakout and potentially improves the chance for a strong rally.
Nevertheless, markets don’t make trading and investing easy. Certainly, it is possible to see a relatively clear bullish continuation. As well, throwbacks and further tests of support will still occur. The degree of weakness and subsequent recovery will tell us something about the dynamics of support and demand. The 50-Day line has successfully been tested as support four times since the gold rallied back above the line with enthusiasm in mid-October. Therefore, it should be a good dynamic support area to watch going forward. Moreover, a drop back below the line should be noted as a sign of weakness.
Weekly Chart Confirms Strength
The weekly chart confirms strength as gold is set to end this week at its highest weekly closing price in four weeks. A close above 2,062 would put it at a four-week high, not just a closing high. The next upside target looks to be around the prior swing high at 2,088. Following that target is the completion of a rising ABCD pattern at 2,117. Once gold closes above 2,062 the chance for continued strength increases. Similarly, a daily close above the 2,088-swing high is a sign of strength, and it should increase the chances of a continuation higher. Gold looks to have its sights set on new record highs this year. This could be the beginning of the rally that takes us there.
Read Full Story »»»
 DiscoverGold
NYBob...please keep the EXTRA GARBAGE outta here????? Geesh! Jesus Loves you! NYBob....... Are you at peace?? you have spent Soooo many years spewing this stuff..... seems like you are in a constant non-peaceful state of mind?? Love and peace to you... 💖
Gold’s Conflicting Signals: Bullish Breakout but Weak Follow Through
By: Bruce Powers | January 31, 2024
• Gold’s recent bullish breakout raises eyebrows as weak closes cast doubt on its sustainability. Could further consolidation be needed before a strong uptrend unfolds?
Although gold is triggering bullish signals, the advance is suspect. A bullish breakout of a pennant consolidation pattern (purple lines) and last week’s high occurred Tuesday. But the close was weak, in the lower third of the day’s range, although it was above the top boundary line of the pattern. Support was tested successfully at the 50-Day MA (orange) and 20-Day (purple) yesterday and then again today.
Wednesday’s advance created the fourth day in a row of higher daily highs and higher daily lows, which shows price improvement. However, it is on track to end Wednesday’s session weak at the time of this writing, in the bottom third of the day’s range once again.

Bullish Breakout Not Convincing
Weak price behavior following what could be a significant bullish reversal makes it suspect. Might gold need more time to test support and consolidate before it is ready to continue its uptrend? Certainly, it is possible as the breakout so far is not encouraging. An upside breakout should show demand improving. Preferably, there are clear signs of strength that make strength indicated by the breakout more likely to be sustained.
Weakness Likely on Drop Below 2,029
A drop below Tuesday’s low of 2,029 could lead to a test of support at the lower boundary of the pennant. In addition, potential support around the downtrend line needs to be watched. The most recent minor swing low at 2,009 is a key level as a drop below there will confirm a breakdown of the pennant. If that happens, it will indicate a failure of the bullish weekly breakout and upside pennant breakout. Lower prices will then be at risk of being tested. A key lower potential support level is the 200-Day MA at 1,964/1,1965.
Watch This Week’s Close for Clue
One of the next indications of strength will be to see whether gold can close above this week’s high of 2.038. That would confirm a weekly bullish breakout. Even with low upside momentum in this week’s breakout, the recovery should eventually be higher if that happens. January was an inside month for gold, and it creates a monthly bullish setup. An upside monthly breakout will trigger above 2,079.
Read Full Story »»»
DiscoverGold
Prayers TIA - Gold demand to hit record with central bank buying, gold council says
Will price suppression hit a record too? The council didn't say.
* * *
By Yvonne Yue Li
Bloomberg News
Wednesday, January 31, 2024
Total gold demand hit a record last year and is expected to expand again in 2024 as the U.S. Federal Reserve moves toward cutting interest rates, potentially aiding prices, according to the World Gold Council.
Overall consumption climbed by about 3% to 4,899 tons last year, supported by strong demand in the opaque over-the-counter market, as well as from sustained central-bank buying, according to the WGC's full-year report. That's the highest total figure in data going back to 2010.
"The landscape is appropriate for emerging central banks to continue to be net buyers," Joseph Cavatoni, chief market strategist at the WGC, said in an interview.
The council sees a strong case for record buying by countries such as China and Poland, he said. ...
... For the remainder of the report:
https://www.bloomberg.com/news/articles/2024-01-31/gold-demand-to-hit-record-with-central-bank-buying-wgc-says
* * *
Prayers TIA -Russia & China’s dedollarisation tactics exposed - LFTV Ep 157
Kinesis Money
41.4K subscribers

.jpg)


Gold is Making Waves within a Long-Term Uptrend
By: Arthur Hill | January 31, 2024
Gold is not the most exciting asset at the moment, but it is in a long-term uptrend and perhaps the strongest commodity out there. There are also signs that the January decline is ending as RSI hits a momentum support zone and a bullish continuation pattern forms. Note that GLD was first highlighted in our Chart Trader report/video on Tuesday, 30-January.
The first chart shows the Gold SPDR (GLD) since October 2022, when it was trading around $150. GLD advanced to the 190 area by May 2023 and then corrected into early October. I am calling this a correction because a large falling channel formed (blue lines) and the decline retraced 50-61.8 percent of the prior advance. GLD broke out of the channel in mid October and hit a new high in late December.

The indicator window shows the Trend Composite turning bullish on October 26th (green arrow), which is about a week after the channel breakout. This indicator aggregate signals in five trend-following indicators. It started at +1, moved to +3 and is currently at +5. This means all five inputs are in bull mode. The Trend Composite and 10 other indicators are part of the TIP Indicator Edge Plugin for StockCharts ACP (here).
The next chart shows GLD correcting after hitting a new high. GLD hit a new high in late December and then fell back in January. This decline formed a falling channel and retraced around 2/3 of the December advance. GLD is making waves with bounce and breakout the last two days. The green line at 186 marks re-evaluation support.

The indicator window shows RSI(14) exceeding 70 in October, late November and early December. This shows strong upside momentum during the fourth quarter advance. RSI fell back to the 40-50 zone in mid November, mid December and mid January (green shading). This area acts as momentum support in an uptrend. There are signs that RSI is turning up from this area and improving momentum supports the channel breakout.
Read Full Story »»»
DiscoverGold
Navigating Gold’s Breakout: Signs of Strength and Short-Term Hurdles
By: Bruce Powers | January 30, 2024
• Gold’s recent breakout holds promise, but its struggle to maintain progress raises questions about the sustainability of bullish momentum in the short term.
Gold breaks out of small pennant consolidation pattern but struggles to maintain progress. Pennants take the form of a small symmetrical triangle. They represent a narrowing consolidation price range as volatility diminishes. That sets the stage for a potential explosive move upon a breakout.
We saw that today in gold, but it has struggled to maintain strength, having fallen back to the breakout area to test it as support. Ideally, a strong bullish breakout closes near the highs of the day’s range. Gold is on track to close in the lower third of the day’s range. Certainly, not as strong a breakout as it could be.

Rally Need Further Confirmation of Strength
Nevertheless, what happens next should provide clues. A drop below today’s low of 2,029 would be bearish in the short term as the price would be falling back into the consolidation pennant. Otherwise, it continues to act as support as gold prepares to go higher. It is set to close at its highest price in 11 days and it has recovered both its 20- and 50-Day MAs, as well as the downtrend line. The integrity of the uptrend remains, with a series of higher swing highs and higher swing lows. Today provides the first clear sign of a bullish reversal. Strength will next be confirmed on a daily close above that top of the pennant at
Low Volatility is Usually Followed by High Volatility
It is interesting to note that the 20-Day and 50-Day lines almost converged today. A bearish signal from the 20-Day crossing below the 50-Day MA was averted. It is another way to notice lower volatility and the reversion towards the mean for price. It is not an accident that they are the closest to each other that they have been since the 20-Day line crossed above the 50-Day in late-October last year. Once they come together as they have, they will begin to move apart again as gold rallies.
Bullish Weekly Signal Triggers
Not only did today’s advance trigger a pennant breakout, but it also triggered a bullish reversal on the weekly chart on a move above last week’s high of 2,038. The longer time frame impacts price behavior of the shorter time frames. Therefore, it should turn out to be a significant development for the bull trend in gold.
Read Full Story »»»
DiscoverGold
NY Gold Futures »» Turning BACK DOWN Weekly Summary Analysis
By: Marty Armstrong | January 27, 2024
The NY Gold Futures closing today at 20173 is immediately trading down about 2.63% for the year from last year's settlement of 20718. Caution is required for this market is starting to suggest it may now decline on the MONTHLY level. Presently, this market has been rising for 2 months going into January reflecting that this has been only still, a bullish reactionary trend.
ECONOMIC CONFIDENCE MODEL CORRELATION
Here in NY Gold Futures, we do find that this particular market has correlated with our Economic Confidence Model in the past. The Last turning point on the ECM cycle low to line up with this market was 2022 and 2015. The Last turning point on the ECM cycle high to line up with this market was 2020 and 2011 and 1996.
MARKET OVERVIEW
NEAR-TERM OUTLOOK
The historical perspective in the NY Gold Futures included a rally from 2015 moving into a major high for 2023, the market has pulled back for the current year. The last Yearly Reversal to be elected was a Bullish at the close of 2022 which signaled the rally would continue into 2023. However, the market has been unable to exceed that level intraday since then. This overall rally has been 1 years in the making.
This market remains in a positive position on the weekly to yearly levels of our indicating models. Pay attention to the Monthly level for any serious change in long-term trend ahead.
Solely focusing on only the indicating ranges on the Daily level in the NY Gold Futures, this market remains in a bearish position at this time with the overhead resistance beginning at 20208.
On the weekly level, the last important high was established the week of December 4th at 21523, which was up 9 weeks from the low made back during the week of October 2nd. We have seen the market drop sharply for the past week penetrating the previous week's low and it closed lower. We are trading below the Weekly Momentum Indicators warning that the decline is very significant and we need to pay attention to the timing and reversals. When we look deeply into the underlying tone of this immediate market, we see it is currently still in a weak posture.
INTERMEDIATE-TERM OUTLOOK
YEARLY MOMENTUM MODEL INDICATOR
Our Momentum Models are declining at this time with the previous high made 2020 while the last low formed on 2023. However, this market has rallied in price with the last cyclical high formed on 2023 and thus we have a divergence warning that this market is starting to run out of strength on the upside.
Interestingly, the NY Gold Futures has been in a bullish phase for the past 13 months since the low established back in November 2022.
Critical support still underlies this market at 19070 and a break of that level on a monthly closing basis would warn that a sustainable decline ahead becomes possible. Immediately, the market is trading within last month's trading range in a neutral position.
DiscoverGold
$ Need to push past the 2080 area, with world events bet it happens..........
Good Luck,
TAZ
I seem to have lost the handle on the metals markets. They keep zigging when I think they are gonna zag. Made a few pennies on silver plays last week, but sold too soon. (maybe) 4God
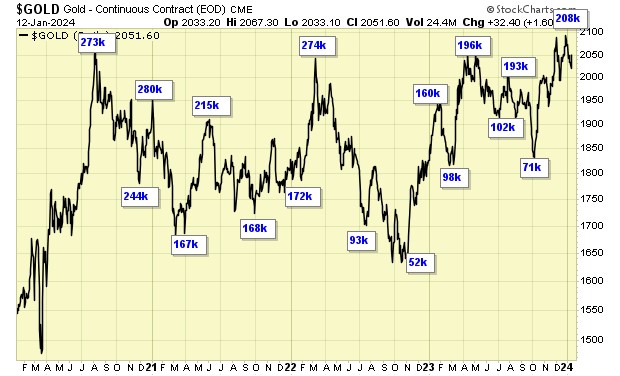
Gold CoT: Peek Into Future Through Futures, How Hedge Funds Are Positioned
By: Hedgopia | January 27, 2024
• Following futures positions of non-commercials are as of January 23, 2024.
Gold: Currently net long 169.5k, down 10.4k.

Gold bugs just cannot get it going. Several attempts this week to recapture the 50-day fell short. Gold, which fell 0.6 percent this week to $2,017/ounce, remains between the average ($2,031) and the 200-day ($1,978).
Non-commercials, in the meantime, reduced net longs in gold futures to a 10-week low. They held 207,718 contracts in the week to December 26th. This week, holdings stood at 169,474, which remains sizable. These traders began to reduce their long exposure after the metal failed to reclaim $2,080s.
Gold rose as high as $2,152 on December 4th but reversed to close at $2,042; resistance at $2,080s held. This has proven to be an important price point. In August 2020, the yellow metal posted a new all-time high of $2,089 and retreated. The reversal occurred again in March 2022 when it printed $2,079 and in May last year when $2,085 was tagged, followed by rejection late last month and early this month.
If it is any consolation to the bulls, $2,000 is attracting bids, including this week.
Read Full Story »»»
DiscoverGold
Gold’s Dilemma: Hovering Below Key Support as Uncertainty Increases
By: Bruce Powers | January 26, 2024
• Gold teeters below crucial support at the 50-Day MA, caught in a symmetrical triangle, awaiting signs pointing to the next direction.
The price of gold remains in a precarious position sitting just below the 50-Day MA (orange), which identifies dynamic support for the uptrend. You can see how today’s high of 2,027 tested for resistance at the 50-Day line before pulling back. Similarly, Thursday’s high also specifically tested the 50-Day line and was rejected to the downside.

Watch for Small Pennant Consolidation Breakout
Price action over the past week and a half has taken the form of a small symmetrical triangle or pennant. Therefore, it can be used to identify signs of strength or weakness earlier than the alternative price levels. For example, the trend low is at last week’s low of 2,002, and a drop below it triggers a bearish trend continuation. However, a breakdown below yesterday’s low of 2,009 triggers an early bearish signal on a move out of the pennant consolidation. It would provide an earlier signal that still has a strong likelihood of dropping through the 2,002-price level and continuing lower.
Bearish Continuation Targets 1,964 Price Zone
It is possible that a bearish continuation may eventually test the 200-Day line as support around 1,964. Along with the 50% retracement at 1,973, and the 127.2% Fibonacci extension of the falling ABCD pattern at 1,967, a price zone from 1,973 to 1,964 is identified. A drop down to that price zone could provide a flush out of weak holders before gold is ready to progress its uptrend to test record highs. Given the long-term chart patterns the expectation is for an eventually rally to new record highs. However, it is starting to look like a deeper selloff may come first.
Initial Upside Targets
An upside breakout is first triggered on a rally above 2,037 and then confirmed once price gets above 2,039. Once above 2,039 gold will have recovered its trend lines and moving averages. It then needs to stay above those lines to remain in a bullish posture. The first higher resistance targets would then be at 2,062 (C), followed by 2,088. A daily close above 2,062 will signal a reversal of the down bearish price correction.
Read Full Story »»»
DiscoverGold
Gold’s Bearish Challenge: Navigating Key Support Amidst Weakness
By: Bruce Powers | January 25, 2024
• Navigating a weakening trend, gold’s pivotal moment is near. A break below 2,002 could set the stage for a fall to 200-Day MA support at 1,964.
The risk of a continuation of the bearish retracement remains as gold further tests a support zone around the 50-Day MA (orange) and uptrend line. It is set to close today below the 50-Day line for a third day, a sign of weakness. In addition, the 20-Day MA was tested as resistance several times in the past five days and today gold tested the 50-Day line, which is lower, with today’s high of 2,025. So, what we see is typical progression of a weakening trend. This puts last week’s swing low at 2,002 in a strong position to be tested again or natural gas breaks below that level.

Gold Holds Key Support but Just Barely
A break below 2,002 will have gold next heading towards the completion of a falling ABCD pattern at 1,987. That price level is also where the 20-Week MA is currently. But, given the significance of the current consolidation zone to the integrity of the uptrend price structure, selling pressure may amplify on a breakdown. If it does, then the lower support levels may be tested, the key level being the 200-Day MA at 1,964.
Lower Support at 200-Day MA with Intermediate Level Above
A potential support zone begins a little above the 200-Day line with a prior swing low and 50% retracement at 1,973. That price level is also a monthly low thereby increasing its potential significance. Also, within that price zone is the target for a 127.2% Fibonacci extension of the falling ABCD pattern at 1,967. The 200-Day line rejected price to the upside only once since gold rallied back above the line in mid-October.
Advance Above 2,035 for Signs of Strength
Gold is on track to complete the week as an inside week unless volatility kicks in quickly, reflecting consolidation on a weekly basis. The high for the week is 2,038 and a breakout above that level will signal strength. However, a daily high from last week is close by at 2,039. A rally above 2,035 will put gold back above its 20-Day MA as well as the downtrend line marking dynamic resistance for the retracement. From there it has a chance to continue to rise. It would then need to get above the swing high of 2,062 for additional confirmation of strength.
Read Full Story »»»
DiscoverGold
maybe they already cleared it out, but since they spot is down there close now, maybe a dip then a do, is still in the works.
nice bump to 2025, still need to go below 2010 and clear things up a bit.
PMI sunk gold today, that news will fade, quick trip to 2008 and mission accomplished
Trend Crossroads: Gold Faces Crucial Support Levels Amid Bearish Momentum
By: Bruce Powers | January 24, 2024
• Gold’s price faces resistance at the 20-Day MA, signaling a potential bearish turn as sellers gain control and trigger a decline to below crucial support levels.
Gold tested resistance around the 20-Day MA earlier in the session with a high of 2,037. That high is the third lower daily high in the past four days. Subsequently, sellers took control, and the price of gold triggered a bearish decline below the four-day low at 2,016. Sellers remain in control at the time of this writing as trading continues near the lows of the day.

Gold at Risk of Seeing a Deeper Retracement
Today’s bearish price action and signs of resistance at a key trend indicator increases the possibility that the current correction is not complete and lower prices may be seen in the future. The significance of the 20-Day MA is increased as it is also acting as a proxy for the downtrend line. Also, trend support represented by both the uptrend line and 50-Day MA has been further tested as support over the past six days. Gold is at risk of failing to continue to do so and testing lower support levels. That would change the integrity of the advance begun from the October swing low.
Key Support at Last Week’s Low of 2,002
Gold successfully tested the 50-Day MA as support several times during the progression of the uptrend until last Wednesday. The 50-Day line takes on slightly greater significance lately than it might otherwise since it has converged with the uptrend line. That strengthens the significance of the price area represented as would any key pivot. It will end up being either an area of strong support or fail to hold and lead to an important breakdown. However, a breakdown below last week’s low of 2,002 would need to occur for a clear bearish signal for the continuation of the retracement.
If Breakdown Triggers Next Lower Target is 1,987
If a breakdown of last week’s low triggers, the 78.6% Fibonacci retracement that is little lower at 1,987 probably won’t hold given that the price area acted as support last week and this week is the second test. The next lower target is the completion of a falling ABCD pattern at 1,987. Subsequently, there is a significant support zone from 1,973 to 1,964. The lower price level comes from the critical 200-Day MA. Given the significance of a breakdown of the rising trend to below the 50-Day MA and uptrend line, selling could easily get more aggressive and push prices to below the first 1,987 target zone.
Read Full Story »»»
DiscoverGold
Gold’s Battle: Testing Resistance and Chart Dynamics Unveiled
By: Bruce Powers | January 24, 2024
• Volatility looms for gold as it navigates resistance at 2,041. Symmetrical triangle dynamics and compressed MAs hint at an imminent breakout, offering traders opportunities amid uncertainty.
For the second day in three gold tests resistance around the 20-Day MA (purple) with a high on Tuesday at 2,038, putting in a higher daily high and high low. It also continues to test the 50-Day MA (orange) as support. The 50-Day line has held up as support for the past few days. Today’s price action creates a slight change in the chart for gold as it broke above yesterday’s high of 2,032, providing a new sign that the bounce off the recent swing low at 2,002 may have more upside to go. Yet, it faces resistance. A daily close above yesterday’s high of 2,032 shows greater strength than a close below that price level.

Confronting 20-Day Moving Average
The 20-Day MA at 2,041 is the first resistance level along with the downtrend line. If gold closes above the 20-Day line, it next needs to confront the recent swing high of 2,062 (C) and then the next higher swing high at 2,088 (A). Volatility should pick up soon as gold is approaching the apex of a symmetrical triangle where the two trendlines cross at 2,033. Moreover, the 20-Day and 50-Day MAs show a similar pattern of range compression. Low volatility is typically followed by an increase in volatility, which sets the stage for a breakout, either up or down soon.
Lower Price Levels if Gold to Falls Again
Gold has been trying to keep together its price structure for the uptrend. It has been threatened recently with the tests of support around the 50-Day MA and internal uptrend line. If yesterday’s low of 2,106 is broken to the downside gold will be back below the 50-Day line. If it stays there, a test the recent lows at 2,002 is likely and probably a drop to complete a falling ABCD pattern at 1,973 (D). Further down is an important support zone from 1,973 to 1,964 consisting of the 50% retracement and 200-Day MA, respectively. Additional evidence for that price zone is provided by the completion of an extended ABCD pattern at 1,967. The CD leg is derived by extended the AB leg by the 1.272% Fibonacci ratio.
Read Full Story »»»
DiscoverGold
Gold Forecast & U.S. Stocks Next 'Kill Zone'
By: Jim Curry | January 21, 2024
With the action seen over the past month, Gold has been locked inside an expected correction phase, with the U.S. stock market still inside a larger 'vacuum' period - one which will take us into the next 'kill zone' date for that market.
First, a look at the position of the Gold cycles.
As per my last article from mid-December of last year, Gold was in a correction phase, one which was expected to last into early this year. This was due to the configuration of our 72-day time cycle, which is currently the most dominant cycle in the Gold market, and which is shown on the chart below:
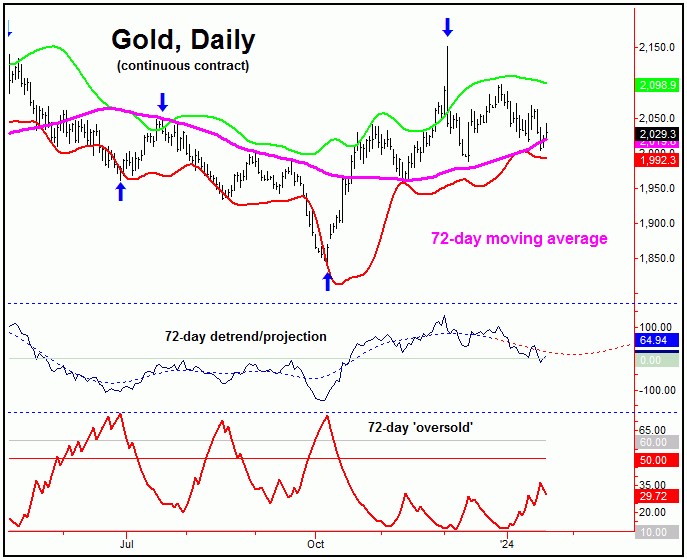
In terms of time, this 72-day wave was originally projected to bottom around this mid- January period, though the detrend that tracks this wave (which adjusts to the price action) suggests that it could push out a bit further.
In terms of price, the best 'look' was for a drop back to the 72-day moving average for Gold - which has now been satisfied with the action into last week. Having said that, the lower 72-day cycle band will normally be hit as well, which has fallen just short - and with that the most recent bounce seems likely to fail.
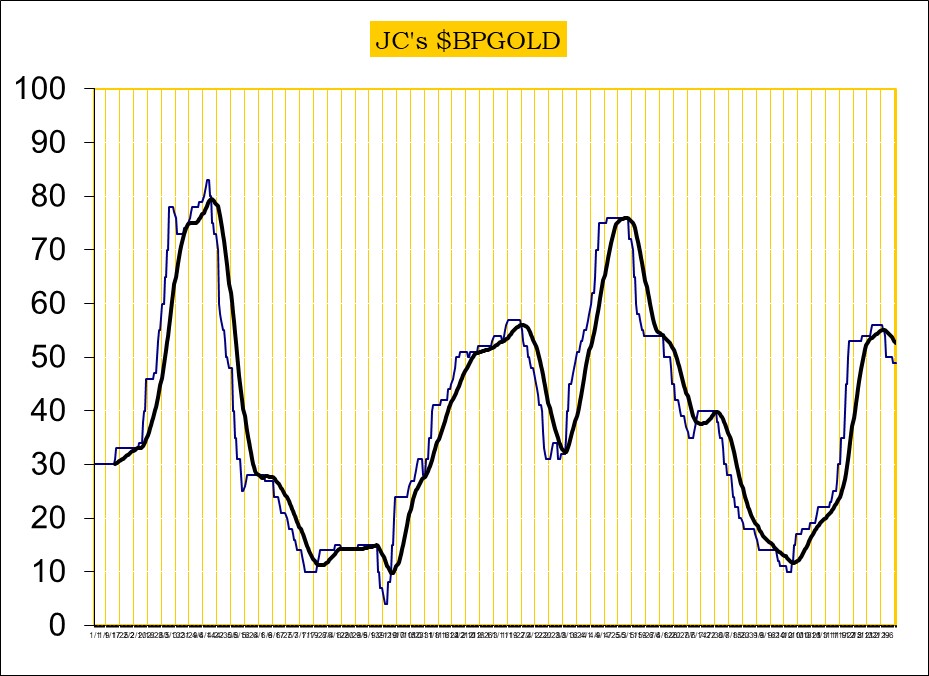
Gold Timing Index
Our key indicator in analyzing the Gold market is called the 'Gold Timing Index', and which has been discussed in prior articles for Gold-Eagle. This indicator is a combined sentiment and momentum measure, and is shown on the chart below:
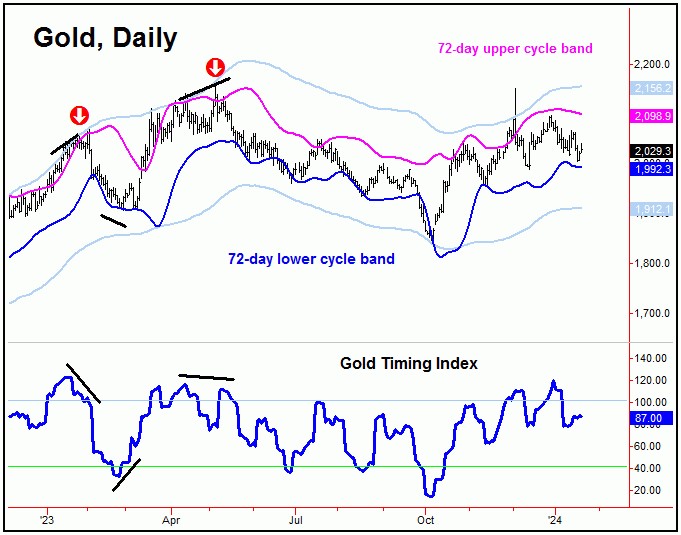
From my 12/17/23 article: "the 'trigger' for the next 72-day cycle bottom looks to be our Gold Timing Index. Price tends to form bottoms when our Gold Timing Index drops below the 40 level - as it did back in early-October. Right now, we are still in the middle-to-upper-end range with this particular indicator, which favors price to see additional correction in the coming weeks - following the completion of the recent short-term rally."
As mentioned back in December, our Gold Timing Index was not in the range where we would expect to see a key low form, and with that the assumption was that lower lows would continue to materialize - which has obviously been seen with the action over the past month.
Going further, we like to see our Gold Timing Index dropping to the 40 level or lower, which - with a current reading of 87 - is still a good distance away. Having said that, this can change quickly, with the most up-to-date chart/reading always posted in our thrice-weekly Gold Wave Trader market report.
Gold's Mid-Term Picture
In terms of patterns, the overall assumption is that the correction phase of our 72-day cycle will end up as a countertrend affair - due to the position of our larger 310-day wave, which is shown on the chart below:
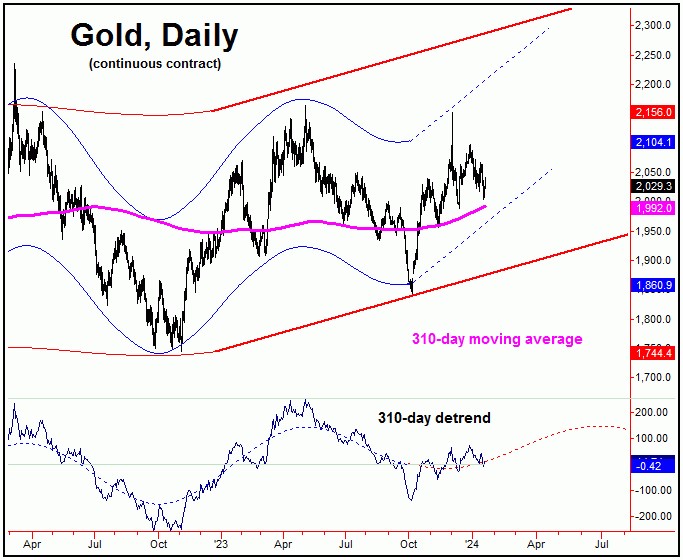
The above chart shows our 310-day wave in Gold, which is viewed as pointing higher into late-Spring or early-Summer of this year. With that, the favored path is for the current downward phase of the smaller 72-day wave to end up as countertrend, holding above the October, 2023 low - the last 72-day cycle trough.
A countertrend correction with our smaller 72-day wave - if seen as expected - should set the stage for our next key bottom for Gold. Once this low is in place, the ideal path would look for a push back above the highs again on the next upward phase of this wave, with a 10-14% rally being the normal expectation.
In terms of price, our upside 'reversal point' (the price which would confirm an upturn in our 72-day wave) is set at any push back above the 2099.80 figure (February, 2024 contract). However, this number is expected to drop sharply in the coming days, with the most current figure always posted in our Gold Wave Trader report.
U.S. Stocks Vacuum Heads into Next 'Kill Zone'
The last mid-term bottom in the SPX (i.e., S&P 500 Index) came from our 180-day time cycle, which troughed with the late-October tag of the 4103.78 SPX CASH figure - and with that was viewed as pointing higher into early this year. Shown below is that cycle:

From my 12/17/23 article: "we noted that a 17% rally was the normal expectation for the SPX, which was the average statistical rally for this wave - when coming off the pattern of a 'higher-low'. Going further with the above, this 17% rally was expected to come in a fairly short time window - thus creating a market 'vacuum', one which would sweep prices sharply higher into early 2024. This vacuum should take prices into our next 'kill zone' date, where the next mid-term top should eventually form for the U.S. stock market."
As mentioned back in December (and in my daily/weekly Market Turns reports, back in early-November), a 17% rally was the normal expectation for the upward phase of our 180-day cycle, which targeted a test - or push above - the all-time high of 4818.62 on the SPX. With the action seen into late last week, this assumption has now been met.
Having said the above, the markets can and often will go higher than statistical averages, and with that there is the potential for additional strength in the days/weeks ahead - before the next mid-term peak attempts to form in U.S. stocks.
In our daily Market Turns report (https://cyclewave.homestead.com/) - which tracks the U.S. stock market - we have identified our next 'kill zone' date, which is the period where expect the next mid-term peak to form. Once this top is in place, the best decline of this year is expected to play out in the weeks to follow.
For the bigger picture, however, the coming correction phase for U.S. stocks is expected to end up as a larger countertrend affair, holding well above the October, 2023 trough of 4103.78 SPX CASH. If correct, another larger-degree rally (20%+) would be expected to play out in the months to follow. Stay tuned.
Read Full Story »»»
DiscoverGold
Gold CoT: Peek Into Future Through Futures, How Hedge Funds Are Positioned
By: Hedgopia | January 20, 2024
• Following futures positions of non-commercials are as of January 16, 2024.
Gold: Currently net long 179.9k, down 8.7k.

Non-commercials are beginning to cut down their net longs in gold futures. They held 207,718 contracts in the week to December 26th. This week, holdings stood at 179,893, which remains sizable.
Earlier, gold rose as high as $2,152 on December 4th but only to close at $2,042; the intraday reversal meant resistance at $2,080s held firm. This has proven to be an important price point. In August 2020, the metal posted a new all-time high of $2,089 and retreated. The reversal occurred again in March 2022 when it printed $2,079 and in May last year when $2,085 was tagged, followed by rejection late last month and early this month.
This week, the metal shed 1.1 percent to $2,029. The weekly has room to continue lower, although gold bugs can take advantage of the daily oversold conditions in the near term.
Read Full Story »»»
DiscoverGold
NY Gold Futures »» Weekly Summary Analysis
By: Marty Armstrong | January 20, 2024
ECONOMIC CONFIDENCE MODEL CORRELATION
Here in NY Gold Futures, we do find that this particular market has correlated with our Economic Confidence Model in the past. The Last turning point on the ECM cycle low to line up with this market was 2022 and 2015. The Last turning point on the ECM cycle high to line up with this market was 2020 and 2011 and 1996.
MARKET OVERVIEW
NEAR-TERM OUTLOOK
The historical perspective in the NY Gold Futures included a rally from 2015 moving into a major high for 2023, the market has pulled back for the current year. The last Yearly Reversal to be elected was a Bullish at the close of 2022 which signaled the rally would continue into 2023. However, the market has been unable to exceed that level intraday since then. This overall rally has been 1 years in the making.
This market remains in a positive position on the weekly to yearly levels of our indicating models. Pay attention to the Monthly level for any serious change in long-term trend ahead.
From a perspective using the indicating ranges on the Daily level in the NY Gold Futures, this market remains moderately bearish position at this time with the overhead resistance beginning at 20331 and support forming below at 20276. The market is trading closer to the support level at this time. An opening below this level in the next session will imply a decline is unfolding.
On the weekly level, the last important high was established the week of December 4th at 21523, which was up 9 weeks from the low made back during the week of October 2nd. We have seen the market drop sharply for the past week penetrating the previous week's low and it closed lower. We are trading below the Weekly Momentum Indicators warning that the decline is very significant and we need to pay attention to the timing and reversals. When we look deeply into the underlying tone of this immediate market, we see it is currently still in a weak posture.
INTERMEDIATE-TERM OUTLOOK
YEARLY MOMENTUM MODEL INDICATOR
Our Momentum Models are declining at this time with the previous high made 2020 while the last low formed on 2023. However, this market has rallied in price with the last cyclical high formed on 2023 and thus we have a divergence warning that this market is starting to run out of strength on the upside.
Interestingly, the NY Gold Futures has been in a bullish phase for the past 13 months since the low established back in November 2022.
Critical support still underlies this market at 19070 and a break of that level on a monthly closing basis would warn that a sustainable decline ahead becomes possible. Immediately, the market is trading within last month's trading range in a neutral position.
DiscoverGold
Gold Beware of 2024
By: Marty Armstrong | January 20, 2024
We have finally reached that infamous year of 2024 in gold. This remains a key target, and the prospects of it producing a retest of the low frustrating the goldbugs remains very high. Before any market makes a major breakout, it typically creates the classic FALSE MOVE.
he backing of any currency has ALWAYS been the CONFIDENCE in the government. Gold will rise after 2024 because we have finally reached that threshold where CONFIDENCE in all governments is collapsing ever since COVID-19.
Ideally, a low in gold in 2024 should be followed by a rally into 2027/2028. A break of the 1987 area technically opens the door to test the 1821 area. The most powerful pattern would be to drop to retest the 1475 level. The further we move down, the tighter the spring will be to bounce back up. That would project a minimum target by 2027 of 2465, with the medium range target being 4150. The more aggressive target by 2027 would be 10,186.
DiscoverGold
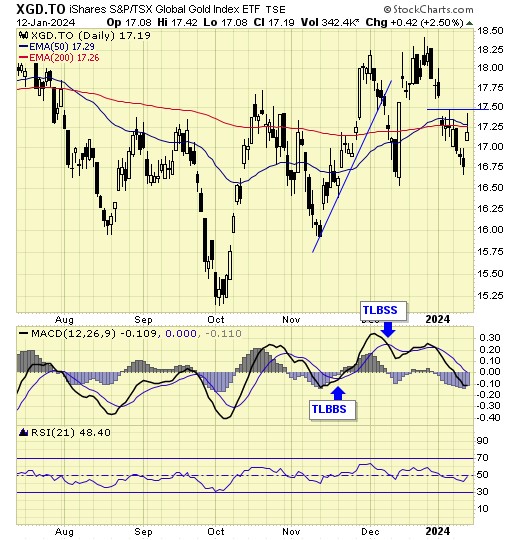
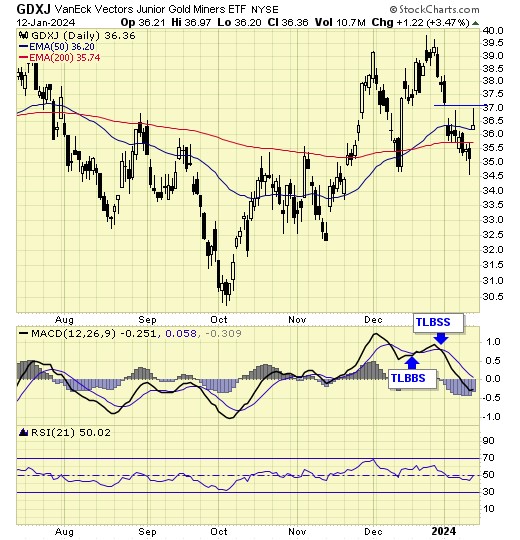
Jack Chan: Gold Price Exclusive Update
By: Jack Chan | January 19, 2024

Our proprietary cycle indicator is DOWN.
To public readers of our updates, our cycle indicator is one of the most effective timing tool for traders and investors. It is not perfect, because periodically the market can be more volatile and can result in short term whipsaws. But overall, the cycle indicator provides us with a clear direction how we should be speculating.
Investors
Accumulate positions during an up cycle and hold for the long term.
Traders
Enter the market at cycle bottoms and exit at cycle tops for short term profits.

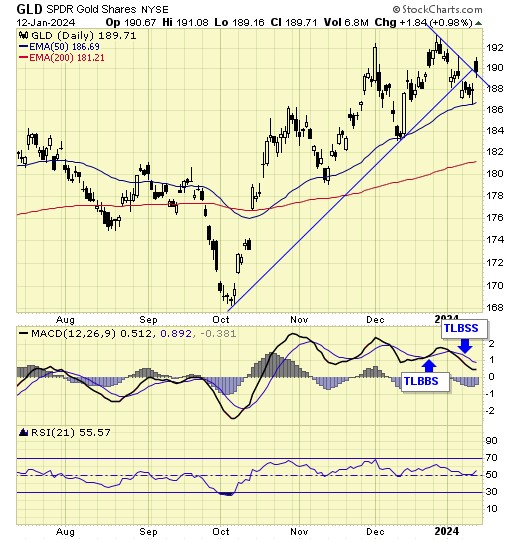
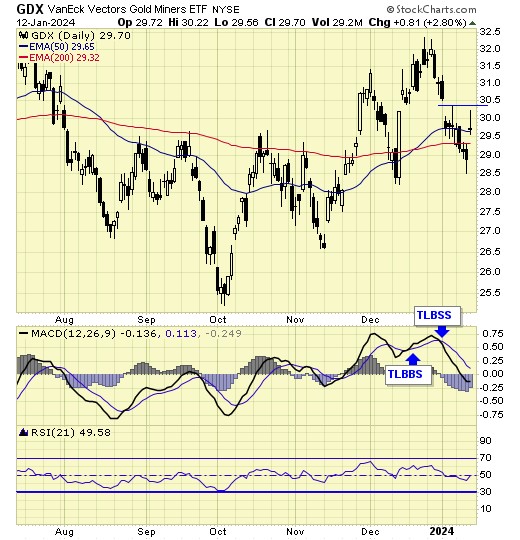
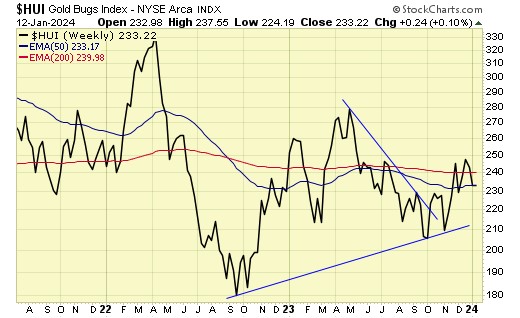
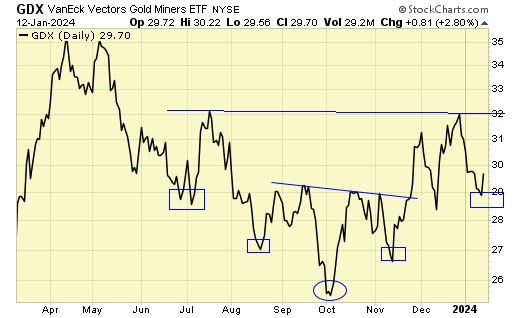
GLD is on short term sell signal.

GDX is on short term sell signal.

XGD.to is on short term sell signal.

GDXJ is on short term sell signal.
Analysis

Current data suggests a pullback, but should see overall higher prices.

Our ratio is on sell signal.

Trend is DOWN for USD.

Trend is UP for gold stocks.

Trend is UP for gold.

Prices have dropped much too low for that right shoulder, expect the Oct low to be tested.

Our ratio has a triple bottom so far, and must hold to avoid a potential bearish scenario.
Summary
Gold sector cycle is down.
Trend is up for gold and gold stocks, and down for USD.
$$$ We closed out 2023 with a nice profit. This marks the 5th straight profitable year for us.
Read Full Story »»»
DiscoverGold
Navigating Gold’s Crossroads: Critical Levels and Potential Trends Unveiled
By: Bruce Powers | January 19, 2024
• Gold’s battle at key levels unfolds between the 20-Day MA and 50-Day MA. A potential bounce may signal a move towards the downtrend line and beyond.
Gold broke out of Thursdays inside day on Friday, and then triggered a breakout of the three-day high at 2,033, before finding resistance at the day’s high of 2,039. Subsequently, it weakened heading towards the end of the session. Gold is currently on track to close relatively weak, below the halfway point of the day’s trading range. That is 2,030 at the time of this writing.

Stuck Between the 20 and 50-Day Moving Averages
Resistance for the day was just below the 20-Day ME, which is at 2,043. That’s puts gold sandwiched between the 20-Day line on the top and the 50-Day MA on the bottom for support. See how today’s low of 2,020 tested support of the 50-Day line and trendline. That is a minor bullish indication but the weak close makes it suspect. Nevertheless, a bounce may have started that could see gold rise to test resistance around the downtrend line. Note that the 20-Day line is on track to converge with the downtrend line, possibly by Tuesday. That would increase the significance of a trendline/moving average breakout if it was to occur.
Uncertainty Dominates with an Upside Bias
Until we see further strength, gold remains at risk of continuing its correction to test lower potential support areas. If today’s low is busted to the downside and prices keep falling a test of the recent swing low as support at 2,002 will be on the agenda. Subsequently, a falling ABCD pattern targets 1,987. The significant 200-Day MA is down at 1,967.
50-Day Moving Average is Key
Until this week, the 50-Day MA was showing support since natural gas rose back above the line with a sharp wide green candle on October 13. It was then successfully tested as support a couple of times, until recently, when gold fell below the 50-Day line. Nevertheless, a relatively swift recovery back above the line, as we’re starting to see today, would go a long way to negating that bearish signal. Gold remains in a move that is the third leg up off the October swing low. If it can stay above the 50-Day line it will continue to have a chance to complete the third advance from that low, which should take it to new highs.
Read Full Story »»»
DiscoverGold
Gold’s Battle: Resilience Above Key Levels Amidst Market Uncertainty
By: Bruce Powers | January 18, 2024
• Navigating through gold’s trends, the battle above 50-Day MA unfolds, as recovery becomes pivotal, potentially signaling bullish momentum or a path towards a deeper bearish correction.
Minor signs of strength return to gold on Thursday as it rose above yesterday’s 2,002 low and advanced back above both the uptrend line and 50-Day MA, but just barely. The 50-Day MA, which is a key trend indicator for gold, is at 2,018. It can be used as a proxy for the uptrend line as they have converged together.
It is useful currently as the line was successfully tested as support three times more recently starting with the November swing low. A quick recovery of the 50-Day line is bullish if it can be sustained and leads to rising prices. However, a drop below yesterday’s low puts gold at risk of a deeper and longer correction.

Minor Strength Seen Following Yesterday’s Decline
Yesterday, gold triggered a bearish trend continuation signal on a decline below the 50-Day line and uptrend line. That pivot takes on greater significance since the two indicators identify a similar price. A quick recovery from yesterday’s bearish breakdown will negate the implications if we see prices subsequently rising away from the lines. A daily close above the 50-Day line is needed first though for a slightly bullish sign. Then, upside follow through is key.
Rally Above 2,033 Shows Strength
Additional strength is subsequently indicated on a rally above yesterday’s high of 2,033. Once a daily close occurs above that price level gold should be ready to proceed higher. The swing high at 2,062 (C) becomes the next significant price level to exceed.
Further Weakening Increases Chance of Testing 200-Day MA at 1,963
If instead of strengthening, gold triggers a bearish continuation on a drop below yesterday’s low, it first heads towards the 2,987-price zone, which is targeted by a falling ABCD pattern. The key 200-Day MA is lower at 1,963, and strengthened by the fact that an extended falling ABCD pattern completes nearby at 1,967. Nevertheless, a drop to the 200-Day line will alter the structure of the rising trend and may lead to gold taking longer to head back towards record highs. Since the next sustained rally may lead to new highs for gold, a dump to further flush out weak holders first may be part of the plan.
Read Full Story »»»
DiscoverGold
Gold’s Decisive Drop: Unraveling Trends and Critical Price Levels
By: Bruce Powers | January 18, 2024
• Bearish signals intensify as gold breaches 50-Day MA and Fibonacci levels. 1,967 emerges as a significant target, challenging the precious metal’s resilience amid correction pressures.
Gold was decisively bearish today as it dropped below the 50-Day MA at 2,017 and the 38.2% Fibonacci retracement level at 2,011. It is on track to close weak, in the lower quarter of the day’s trading range. An uptrend line was also broken. This puts gold in sight of completing a falling ABCD pattern at 1,987 and possibly continuing to weaken thereafter to lower price levels.

1,987 Support Needs to Hold, Otherwise, 1,973
If the 1,987 level is exceeded to the downside gold heads towards a swing low at 1,973. That price matches the 50% retracement level. Subsequently, the 200-Day MA becomes a potential target. It is down at 1,963. There has only been one successful test of the 200-Day line as support since gold rose back above the line in mid-October. So, a second test would not be out of the question. Of course, that would be the 1,973-swing low support level doesn’t hold. It is interesting that the 127.2% Fibonacci extension of the falling ABCD pattern completes right around the 200-Day line at 1,967. In other words, that’s another target for that price pattern. The first was at 1,987.
Correction Should be Followed by Resumption of Bull Trend
If there ends up being only two legs down in the current correction, which started from the recent swing high of 2,088 (A), it should be followed by a resumption of the larger bull trend. We are seeing a continuation of the second leg down now, as of last Friday’s high (C).
Weekly Chart Supports a Deeper Retracement
Price action in the weekly chart supports a deeper retracement. Last week ended with a bullish hammer candlestick pattern. However, it needed to trigger an upside breakout to be valid and that didn’t happen. Instead, there was no breakout, and the pattern was invalidated with bearish breakdown instead. Failed patterns can lead to faster moves, and we are starting to see that now in gold.
This means downside momentum seems to be picking up and weighing on prices. If demand is not strong enough counter-selling pressure sellers will remain in control for longer than initially anticipated. That’s why the 200-Day line as a target is the maximum gold should fall while maintaining an intermediate and long-term bullish bias.
Read Full Story »»»
DiscoverGold
Navigating Gold’s Dilemma: Resistance, Retracement, and Breakout Clues
By: Bruce Powers | January 16, 2024
• As gold grapples with resistance, this week’s price action reveals a battle for direction. A breakout above 2,062 could pave the way for a bullish ascent towards record highs.
Gold continues to encounter resistance around the downtrend line. You can see today how the line was tested as resistance for the third day in a row thereby generating a third sequential lower high, which was at 2,056. Subsequently, price was rejected to the downside and gold then fell to a three-day low of 2,024 before a minor intraday bounce.

Bullish Signal Not till Breakout Above Last Week’s High of 2,062
This week’s price action has been contained within last week’s relatively wide range that takes the form of a bullish hammer candlestick pattern. However, there is no bullish signal until there is a breakout above last week’s high of 2,062. Given the weakness seen in the price of gold so far this week, it looks like near-term lower price levels are going to be tested in a retracement.
If last week’s low of 2,013 is not busted gold could end the week with an inside week, setting the stage for a pickup in volatility next week. If so, choppy price action may continue till the end of this week. Last week’s low is supported by the nearby 50-Day MA, now at 2,017, and the completion of the 61.8% retracement, that occurred at 2,017.
If Breakdown Triggers, Next Price Level is 1,998
If the retracement continues below last week’s low, lower price levels will be in sight. The 78.6% Fibonacci retracement is at 1,998, followed by the 50-Day MA at 1,957. Also, there is a minor price level around the 20-Day MA at 1,981. A deeper retracement would put the near-term rising trend channel structure at risk of being broken. Currently, that risk exists as gold is trading below the lower channel line increasing the chance that the breakdown from the channel could lead to further weakness.
Nevertheless, Last week’s high of 2,062 and low of 2,013 is the price range holding gold intact. Whichever way price breaks out is the likely direction it should continue to head in. An upside breakout will put gold back above both the uptrend and downtrend lines, and above the 20-Day line and trigger a bullish breakout of last week’s hammer candle. At that point it can prepare for an eventual test of record highs.
Read Full Story »»»
DiscoverGold
Gold CoT: Peek Into Future Through Futures, How Hedge Funds Are Positioned
By: Hedgopia | January 13, 2024
• Following futures positions of non-commercials are as of January 9, 2024.
Gold: Currently net long 188.6k, down 19k.

Gold bugs defended the 50-day ($2,023) this week. This follows rejection late last month at $2,080s. The daily is now in oversold territory, raising the odds the bulls will regroup to launch another attack. This has proven to be an important price point.
In August 2020, the metal posted a new all-time high of $2,089 and retreated. The reversal occurred again in March 2022 when it printed $2,079 and in May last year when $2,085 was tagged.
More recently, on December 4th, no sooner did gold break out of $2,080s than it quickly met with a nasty reversal, rising as high as $2,152 but only to close at $2,042. After that, bulls have gone after that several more times, but to no avail. Chances are they will meet the same fate near term, should they regroup and hammer on that ceiling.
It is looking more and more likely gold ($2,052/ounce) wants to head lower on the weekly.
Read Full Story »»»
DiscoverGold
Jack Chan: Gold Price Exclusive Update
By: Jack Chan | January 13, 2024
Our proprietary cycle indicator is now DOWN.
To public readers of our updates, our cycle indicator is one of the most effective timing tool for traders and investors. It is not perfect, because periodically the market can be more volatile and can result in short term whipsaws. But overall, the cycle indicator provides us with a clear direction how we should be speculating.
Investors
Accumulate positions during an up cycle and hold for the long term.
Traders
Enter the market at cycle bottoms and exit at cycle tops for short term profits.
GLD is on short term sell signal.
GDX is on short term sell signal.
XGD.to is on short term sell signal.
GDXJ is on short term sell signal.
Analysis
Current data suggests a pullback, but should see overall higher prices.
Our ratio is on sell signal.
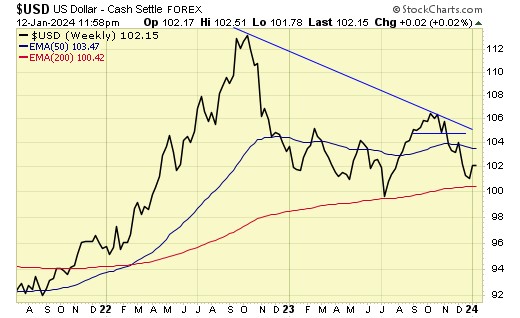
Trend is DOWN for USD.
Trend is UP for gold stocks.
Trend is UP for gold.
GDX is now in the process of a bigger inverted head& shoulder.
Our ratio has a triple bottom so far, and must hold to avoid a potential bearish scenario.
Summary
Gold sector cycle is down.
Trend is up for gold and gold stocks, and down for USD.
$$$ We closed out 2023 with a nice profit. This marks the 5th straight profitable year for us.
Read Full Story »»»
DiscoverGold
Gold Surges $44 After US & UK Strikes In Yemen
January 12, 2024
Gold Surges $44 After US & UK Strikes In Yemen
The price of gold has surged $44 on the heels of the US & UK strikes in Yemen. Silver is also moving higher once again above $23.50, up nearly $1. Here is what to watch.
https://kingworldnews.com/gold-surges-44-after-us-uk-strikes-in-yemen/
https://investorshub.advfn.com/boards/read_msg.aspx?message_id=173374182
Gold , helps you sleep at night
Gold’s Dilemma: Caught Between Moving Averages Amidst Bearish Momentum
By: Bruce Powers | January 11, 2024
• As gold descends to a new retracement low, attention turns to the 78.6% Fibonacci retracement at 1,998, signaling potential downside, unless a swift recovery above the 50-Day MA materializes.
Gold continued its descent today, falling to a new trend low before quickly finding support at the 50-Day MA with a low of 2,013. Resistance around the 20-Day MA and uptrend line were tested earlier in the session with price subsequently rejected to the downside. You can see how the 20-Day line has started to converge with the uptrend line, identifying a similar price. Gold is sandwiched between those two moving averages. Although today’s decline took gold below the prior retracement low at 2,017, it is on track to close above that price level, a little stronger than a close below that level.

Holding Support at 50-Day Moving Average
Since gold is sitting at support of the 50-Day line and there have been no signs of a reversal the odds favor a continuation lower until proven otherwise. A drop below today’s low has gold next targeting the 78.6% Fibonacci retracement at 1,998.
If a quick recovery follows to recover the 50-Day line, the retracement might be over and to be followed by a bullish reversal. However, further weakness would likely test monthly support at the daily swing low of 1,973. And given that the 200-Day MA (blue) is not much lower, it certainly would become a lower target as well if the 78.6% level is breached.
If Bullish Reversal Triggers Soon, Initial Target is 2,129
If today turns out to be a swing low and it is followed by a bullish reversal the initial primary target is up around 2,129. That would complete a rising ABCD pattern as shown on the chart, just shy of the 2,135-record high reached in early December. The price structure of the ascending parallel trend channel is at risk of being violated given the drop below the uptrend line on Monday. There have been two previous legs up and we are currently in the third leg up. There was symmetry in both time and price between the first two legs up, reflecting a strong foundation for the trend and the third leg. A bullish scenario may yet play out in the near-term if the price of gold holds above support of its 50-Day MA.
Read Full Story »»»
DiscoverGold
Gold’s Critical Position: Inside Day Down Raises Retracement Concerns
By: Bruce Powers | January 10, 2024
• Gold faces a pivotal moment, closing below key levels amid retracement concerns. The battle unfolds between potential support and signals of a deeper downturn in the precious metal market.
Gold triggers an inside day down on Wednesday, as it drops below Tuesday’s low of 2,026. And it is on track to close below that level. Nevertheless, it continues to trade within Monday’s trading range of 2,017 to 2,047. Those are the two key near-term price levels to signal either strength or weakness. The low on Monday completed a 61.8% Fibonacci retracement and subsequently found support there. That’s just above the 50-Day MA, which is now at 2,012.

Three Days Below Line Shows Weakness
Today’s close is set to see gold below the uptrend line for the third day in a row as it consolidates within Monday’s price range. This leaves it in a precarious position that increases the risk that a deeper retracement may be in the works. In addition to closing below the line on multiple days, the 20-Day MA has acted as resistance the past couple of days. A downtrend progresses by breaking below support then returning to test the same or similar price levels as resistance. Once that happens the chance that prices will continue to fall increases.
Lower Support Levels on Deck
Potential support at the 50-Day line is nearby. If it continues to hold as support the bullish near-term outlook in gold can be maintained. If not, it looks like gold could head to the 78.6% retracement at 1,998 or fall further down to the prior swing low at 1,973 or the 200-Day MA at 1,963. Also, to consider is the December monthly low that matches the prior swing low at 1,973 thereby potentially strengthening the support around that price area.
Integrity of Rising Trend Channel at Risk
This week’s decline is testing the integrity of the rising parallel trend channel. A daily close below the 50-Day line will confirm a violation. At the same time a breakout above today’s high of 2,040 is a sign of strength and potential bullish reversal. While it would also put gold back above its 20-Day MA. The two-day high is then at 2,042, followed by the three-day high at 2,047. Although the lower levels show strength, a breakout above the three-day high will be more significant as it will better forecast a continuation higher.
Read Full Story »»»
DiscoverGold
Metals Daily Market Movers (% Price Change)
By: Marty Armstrong | January 10, 2024
• Top Movers
LBMA Silver in USD 1.23 %
Gold / Silver Ratio 0.92 %
London Aluminum Spot 0.72 %
NY Aluminium Futures 0.26 %
• Bottom Movers
Tokyo Palladium Futures 6 %
NY Palladium Futures 2.18 %
Platinum / Gold Ratio 2.13 %
Tokyo Silver Futures 1.8 %
NY Platinum Futures 1.66 %
*Close from the last completed Daily
DiscoverGold
Deciphering gold’s direction reveals bearish cues and glimmers of an upswing, emphasizing the importance of reading signals amid a complex market scenario
By: Bruce Powers | January 9, 2024
• Navigating Gold’s Crossroads: Bearish Trends and Potential Rally Signals.
Today’s price action in gold was relatively uneventful as trading occurred inside the range of yesterday. Nonetheless, today’s high of 2,042 tested resistance around the 20-Day MA. Gold is set to close with a bearish doji shooting star candlestick pattern and weak, in the lower quarter of the day’s trading range.

Break Below Uptrend Line is Sign for Caution
Monday saw a direct successful test of support at the 61.8% Fibonacci retracement with a low of 2,017. That drop put gold below its uptrend line, and it closed below the line. That is not a sign of strength in the near term. Further, gold is likely to also close below the line today. This puts lower levels in site as they could be approached if supply begins to increase around current levels. Following today’s close, a drop below today’s low of 2,026 gives a bearish signal, which is confirmed on a drop below yesterday’s low.
50-Day MA Should Provide Significant Support
The more significant price support level is not much lower at the 50-Day MA, as it relates to the trend. It is now at 2,012. Recently, the 50-Day MA has successfully been tested as support twice and each time it was followed by a rally. Further down is the 200-Day MA at 1,963. Although if the 200-Day MA is reached the price structure of the current uptrend will be violated as gold would have dropped below the December 13 swing low at 1,973. Nevertheless, if gold drops below the 50-Day line it first heads towards the 78.6% Fibonacci retracement at 1,998.
Advance Above 2,042 Shows Strength
Since Tuesday is an inside day, a bullish breakout is triggered on a rally above today’s high of 2,042. That would put the price of gold back above its 20-Day MA, now at 2,038. But an advance above the two-day high of 2,047 will provide a bullish signal that has a better chance of leading to higher prices. Although there are several interim higher price targets, including the recent swing high at 2,088, a rising ABCD pattern targets completion at 2,132, very close to the recent record high of 2,135 from early-December 2023.
Read Full Story »»»
DiscoverGold
Navigating Gold’s Path: Key Support Tests and Future Rally Prospects
By: Bruce Powers | January 8, 2024
• As gold tests support levels and the 50-Day MA, the stage is set for a potential rally towards new trend highs, signaling a nuanced shift in market dynamics.
Gold further retraced its prior advance today, dropping to a new retracement low, and falling below the uptrend line before finding intraday support. Support was seen at 2,017, right around a weekly low and the 61.8% Fibonacci retracement. An intraday bounce followed with gold on track to close above the prior retracement low of 2,024. However, it is also set to close weak relative to the uptrend line as it remains below the line at the time of this writing.

Support at 50-Day MA is Key
Either today’s decline tested support of the 50-Day MA (orange) or another drop is due to catch it more clearly. The 50-Day line is now at 2,011 (C). There have been two successful tests of the 50-Day line as support since gold rose above it on October 13 with a sharp rally. It is anticipated to show support again for the current approach as it has been identified by the market as a key trend indicator previously. Note that the shorter 20-Day MA has not been confirmed recently as it has not identified support for the three most recent approaches. For the bullish outlook to hold, gold needs to stay above the 50-Day MA.
Pullback Sets Stage for Next Rally
The current pullback should be setting the stage for at least another advance into new trend highs. There have been two rallies off the October 6 low to date, with a third in process. A measured move target for the current advance is around 2,176. At that price the rally would approximately match the two previous measured moves (purple arrows) at a minimum. Symmetry is reflected in the earlier advances with an approximate match in both time and price. That sets the stage for the current rally as symmetry between swing shows an organized structure within price history.
Watching For Bullish Signal Above Today’s High
Once the bottom is confirmed gold is anticipated to progress towards prior highs. As of today, a rally above today’s high of 2,047 would indicate strength. The ABCD pattern on the chart has been redrawn to include today’s low as point C. Once gold rallies above today’s high it should then head towards the recent trend high of 2,088 (B), followed by the 78.6% Fibonacci retracement at 2,100. Once 2,100 is cleared, the stage is set for new record highs.
Read Full Story »»»
DiscoverGold
Gold’s Retreat: Unveiling Potential Support Zones and Future Trajectory
By: Bruce Powers | January 2, 2024
• Navigating gold’s journey: From potential bearish triggers to support zones, the market’s path unfolds.
Gold completed a rising ABCD pattern at last week’s high of 2,088 before encountering resistance. Subsequently, a retracement began that may have further to go. Last week ended with a bearish weekly shooting star candlestick pattern. The pattern is generally bearish but only after having been triggered. That will occur on a drop below last week’s low of 2,053.

Target Support Zone: 38.2% Fibonacci at 2,044, with Prior High at 2,048
If the weekly potentially bearish candle triggers, gold will next be targeting lower price levels starting with a price zone around the 38.2% Fibonacci retracement at 2,044. Notice that the prior swing high is close by at 2,048 (B). Together, these two indicators identify a potential support zone from 2,048 to 2,044. If the retracement continues from there the next lower target is from around 2,034 to 2,031. That second zone consists of the 20-Day MA and 50% retracement, respectively.
Well Structured Rising Trend Channel Dominates
Gold has been rising from the October 6 corrective low of 1,810 in a parallel trend channel reflecting symmetry within the volatility of the advance. There have been two legs up off the bottom and gold is currently attempting to rally the third advance from that low. It is expected that gold will eventually reach new highs in the relatively near future. Three legs up in a rally at a minimum is common and the third leg up has not yet reached a target. A minimum target, just based on price structure, is at the 127.2% Fibonacci extension of the latest bearish retracement at 2,180.
2,006 is Strong Support
Given the clarity of the price structure of the rising channel, a drop to test the lower channel line as support would be the lowest price area anticipated during the developing retracement. The 50-Day MA can be used as a proxy for the trendline as it converged with the line starting in early-December 2023. It is now at 2,006. If a retracement does continue, the characteristics and extent of the decline may be telling as to what comes afterwards. For example, a shallower pullback and recovery will be a stronger sign of strength than a deeper retracement and slow recovery.
Read Full Story »»»
DiscoverGold
NY Gold Futures »» Weekly Summary Analysis
By: Marty Armstrong | December 30, 2023
At this time, the NY Gold Futures closed today at 20718. Caution is required for this market is starting to suggest it may now decline on the MONTHLY level. Up to this moment in time, this market has been rising for 2 months going into January reflecting that this has been only still, a bullish reactionary trend.
ECONOMIC CONFIDENCE MODEL CORRELATION
Here in NY Gold Futures, we do find that this particular market has correlated with our Economic Confidence Model in the past. The Last turning point on the ECM cycle low to line up with this market was 2022 and 2015. The Last turning point on the ECM cycle high to line up with this market was 2020 and 2011 and 1996.
MARKET OVERVIEW
NEAR-TERM OUTLOOK
The historical perspective in the NY Gold Futures included a rally from 2015 moving into a major high for 2023, the market has pulled back for the current year. The last Yearly Reversal to be elected was a Bullish at the close of 2022 which signaled the rally would continue into 2023.
This market remains in a positive position on the weekly to yearly levels of our indicating models. Pay attention to the Monthly level for any serious change in long-term trend ahead.
Focusing on our perspective using the indicating ranges on the Daily level in the NY Gold Futures, this market remains moderately bullish currently with underlying support beginning at 20651 and overhead resistance forming above at 20805. The market is trading closer to the support level at this time.
On the weekly level, the last important high was established the week of December 4th at 21523, which was up 9 weeks from the low made back during the week of October 2nd. Afterwards, the market bounced for 9 weeks reaching a high during the week of December 4th at 20106. Since that high, we have been generally trading down to sideways for the past 3 weeks, which has been a sharp move of 4.051% in a reactionary type decline. Nonetheless, the market still has not penetrated that previous low of 18235 as it has fallen back reaching only 4523 which still remains -75.1% above the former low.
When we look deeply into the underlying tone of this immediate market, The broader perspective, this current rally into the week of December 4th has exceeded the previous high of 20197 made back during the week of October 23rd. This immediate decline has thus far held the previous low formed at 18235 made the week of October 2nd. Only a break of that low would signal a technical reversal of fortune and of course we must watch the Bearish Reversals. Right now, the market is neutral on our weekly Momentum Models warning we have overhead resistance forming and support in the general vacinity of 20106. Additional support is to be found at 19672. From a pointed viewpoint, this market has been trading down for the past 3 weeks.
INTERMEDIATE-TERM OUTLOOK
YEARLY MOMENTUM MODEL INDICATOR
Our Momentum Models are declining at this time with the previous high made 2020 while the last low formed on 2023. However, this market has rallied in price with the last cyclical high formed on 2023 and thus we have a divergence warning that this market is starting to run out of strength on the upside.
Interestingly, the NY Gold Futures has been in a bullish phase for the past 13 months since the low established back in November 2022.
Critical support still underlies this market at 19070 and a break of that level on a monthly closing basis would warn that a sustainable decline ahead becomes possible. Immediately, the market is trading within last month's trading range in a neutral position.
DiscoverGold
Gold CoT: Peek Into Future Through Futures, How Hedge Funds Are Positioned
By: Hedgopia | December 30, 2023
• Following futures positions of non-commercials are as of December 26, 2023.
Gold: Currently net long 207.7k, up 6.4k.

Once again, gold bugs went after $2,080s and once again their effort failed to bear fruits.
Early this month, no sooner did gold break out of $2,080s than it quickly met with a nasty reversal. This level has a lot of memory attached to it. In August 2020, the metal posted a new all-time high of $2,089 and retreated. This occurred again in March last year when it printed $2,079 and in May this year when $2,085 was tagged.
On Wednesday and Thursday, gold touched $2,096 and $2,098 intraday, but only to finish the week at $2,072, forming a weekly shooting star. For December, a massive monthly spinning top formed.
Despite all these developments, gold remains in the periphery of the said level. Right here and now, the path of least resistance is down on the daily, with the 50-day at $2,014 and decent horizontal support at $2,000.
Read Full Story »»»
DiscoverGold
Jack Chan: Gold Price Exclusive Update
By: Jack Chan | December 30, 2023

Our proprietary cycle indicator is UP.
To public readers of our updates, our cycle indicator is one of the most effective timing tool for traders and investors. It is not perfect, because periodically the market can be more volatile and can result in short term whipsaws. But overall, the cycle indicator provides us with a clear direction how we should be speculating.
Investors
Accumulate positions during an up cycle and hold for the long term.
Traders
Enter the market at cycle bottoms and exit at cycle tops for short term profits.

GLD is on short term buy signal.

GDX is on short term buy signal.

XGD.to is on short term sell signal.

GDXJ is on short term buy signal.
Analysis

Current data favors overall higher prices.

Our ratio is on buy signal.

Trend is DOWN for USD.

Trend is UP for gold stocks.

Trend is UP for gold.

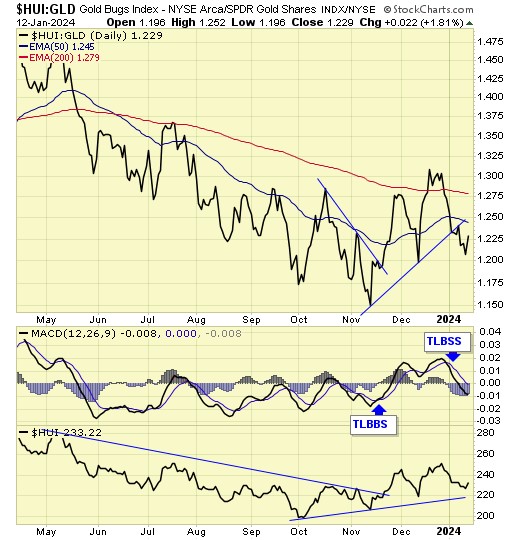
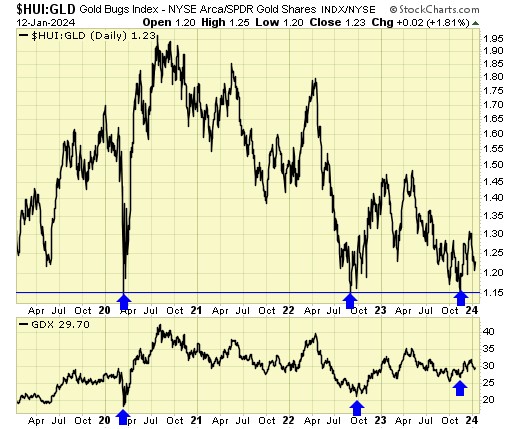
Our ratio of $HUI:GLD has confirmed an inverted head & shoulder bottom.

GDX is now in the process of a bigger inverted head& shoulder.
Summary
Gold sector cycle is up.
Trend is up for gold and gold stocks, and down for USD.
$$$ We closed out 2023 with a nice profit. This marks the 5th straight profitable year for us. Happy new year to all of you from all of us!
Read Full Story »»»
DiscoverGold
Real Gold Far From Peak
By: Adam Hamilton | December 29, 2023
Gold is forging into new-record-high territory for the first time in several years. That is starting to generate some excitement, with financial-media coverage growing more frequent and bullish. That’s increasingly attracting back traders, who love chasing upside momentum on record breakouts. Despite these recent nominal records, gold remains far from its real inflation-adjusted peak implying it still has a long ways to run yet.
On December’s opening trading day, gold blasted 1.7% higher to a $2,071 close. That strength resulted from the Fed chair speaking at an Atlanta college. Traders expected him to wax hawkish and push back against loosening financial conditions. Instead he declared Fed monetary policy was already “well into restrictive territory”. So market-implied rate-cut odds for the FOMC’s mid-March meeting doubled to 80%!
While that was a big up day for gold, its absolute level was more interesting. That $2,071 was gold’s first new record high since early August 2020’s $2,062 fully 3.3 years earlier! Records usually run in streaks, as traders pile in to ride breakouts which accelerates them. But gold suffered a sharp pullback right after, on fears top Fed officials would soon unleash hawkish fury at their looming mid-December FOMC meeting.
Yet instead they surprised, pivoting dovish. The latest Federal Open Market Committee statement added a qualifier making further rate cuts less likely, top Fed officials cut their year-end-2024 federal-funds-rate projections by 50 basis points, and the Fed chair himself sounded dovish in his press conference! So gold soared 2.3% to $2,024 on that Fed Day, violently reversing its healthy pullback to rally higher since.
Mid-week gold was trading near $2,084, and closed at another record of $2,077. So a typical new-record streak is building despite being interrupted by incorrect FOMC expectations. While the great majority of both speculators and investors love chasing winners on record breakouts, contrarians have always been gold’s core constituency. We want to buy low before selling high, not buy high then hope for a greater fool later.
Despite gold’s nominal records, it isn’t yet extremely high in real inflation-adjusted terms. Reflecting the endlessly-eroding purchasing power of money, real prices are far more relevant over multi-decade timeframes. Central banks perpetually grow their money supplies, and gold is prized for staying ahead of that inflation. Since mining gold is so challenging, its global above-ground supply only grows about 1% per year.
That’s a stark contrast to central banks’ fiat currencies, which often increase an order of magnitude faster. The Fed’s balance sheet is essentially the US dollar’s monetary base, controlling the world supply of them. Even in normal non-crisis times, that is constantly climbing. In the decade ending 2019, the Fed grew its balance sheet 86.5% which annualizes to a 6.4% rate. But that trajectory radically steepened in early 2020.
Top Fed officials panicked after the pandemic-lockdown stock panic, when the flagship S&P 500 stock index cratered 33.9% in just over a month! So they frantically redlined their monetary printing presses for over two years after that. From just before that stock panic in late February 2020 to mid-April 2022, the Fed ballooned its balance sheet an absurd 115.6% in just 25.5 months for crazy-extreme monetary inflation!
That monetary base more than doubling in a couple years is the dominant reason inflation has raged in recent years. The FOMC finally realized how dangerous its extreme monetary excesses were in mid-2022 as reported inflation soared. So the Fed has shrunk its balance sheet 13.8% since then. Yet crazily over these past four years, that monetary base has still skyrocketed 85.4% tying the previous decade’s growth!
That annualizes to a shocking 16.7% growth rate, well over an order of magnitude larger than gold’s world mined-supply growth! Unlike fiat currencies, gold can’t be conjured into existence by central banks. That natural scarcity is the main reason this leading alternative asset has been universally valued for millennia. No matter how extreme governments debasing their currencies becomes, gold preserves purchasing power.
That has seriously eroded in recent years thanks to the Fed’s epic monetary largesse. The most-closely-watched inflation gauge is the US Consumer Price Index. The Bureau of Labor Statistics in charge of it defines the CPI as “a measure of the average change over time in the prices paid by urban consumers for a market basket of consumer goods and services.” But the CPI chronically understates real-world inflation.
During these last four years where the Fed’s balance sheet soared 85.4%, the headline CPI has merely climbed 19.5%! Does that sound righteous to you? Are the prices you are paying for goods and services only about 20% higher than pre-pandemic levels? Anyone running a household or business has likely seen the prices they are paying soaring 50% to 100% in that timeframe! We all wish they were only up 20%.
The BLS has long intentionally lowballed the CPI for political reasons. Excessive money-supply growth is a devastating stealth tax on wealth, so Americans despise it. Politicians want to hide actual inflation from voters, otherwise they’d be run out of office. Higher reported inflation also limits government spending on multiple fronts. Politicians hate that, as they want to expand spending to bribe their constituents for votes.
The higher reported inflation, the higher prevailing interest rates. Those leave government borrowing and servicing debt more expensive, constraining its expansion. Higher rates also consume larger fractions of government budgets, restraining discretionary spending. They also increase transfer payments indexed to inflation, also leaving less money for politicians to spend. So they are loath to honestly report inflation.
General price levels Americans are paying have climbed faster than the CPI for the decades I’ve been studying both. Various statistical distortions the BLS uses to manipulate the CPI to placate its political masters have continually underreported true inflation. But that makes the CPI very conservative to use to illuminate real gold prices. Annualized CPI growth since late 2019 is only running 4.5%, which is laughable.
Gold’s real all-time-record high was seen in late January 1980, when prices skyrocketed to $850 nominal. That capped a mighty 10.0-year secular bull at life-changing 2,332% gains! That peak gold price inflated using the lowballed CPI as of its latest November 2023 print translates into $3,355 in today’s dollars! Gold won’t hit real records until at least that is exceeded, which is another 62% higher from mid-week levels.
Here’s a chart of gold’s 1970s super-bull rendered in current-dollar purchasing power as claimed by the CPI. Underneath those real gold prices are the CPI inflation rates, which were far-more honest back then. The political manipulation of key economic data has soared since, especially in the Biden years. Gold’s bull-market trajectories closely mirrored underlying monetary inflation, which gold stayed way ahead of.
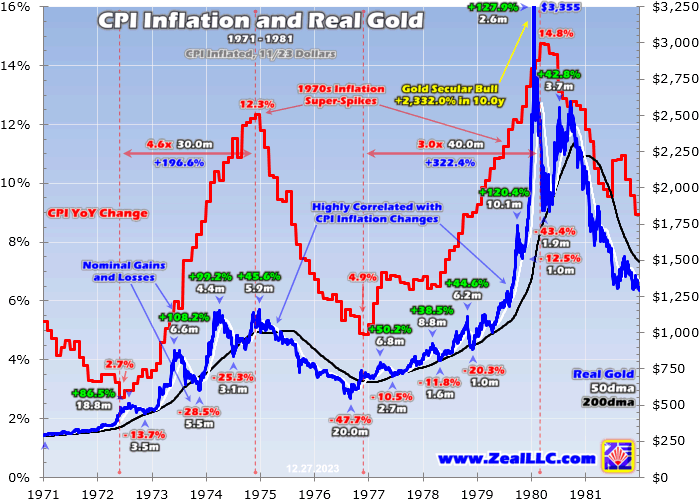
Gold is certainly high today challenging $2,100, but remains far from that $3,355 real peak. And $2,100+ gold in today’s dollars wasn’t a short-lived phenomenon back then. Gold first blasted above there in early January 1980, then didn’t fall back below for good until early January 1981. Gold was higher than today’s levels for fully 3/4ths of that 12.2-month span! Real gold soared way higher during the last inflation super-spike.
Nothing attracts investors to gold like new record highs. Early this month when gold achieved that first new nominal record close in over several years, gold’s latest upleg merely extended to 13.8% gains over 1.9 months. That’s still small by recent standards, and trivial by 1970s standards. Over 7.2 months into early May 2023, the last gold upleg powered up 26.3%. So many more records are coming as this upleg matures.
The last gold upleg achieving streaks of nominal record highs crested in early August 2020. During that gold soared 40.0% in 4.6 months, achieving 30 new record closes in that span! Those records put gold back on investors’ radars, who then swarmed back in droves to chase gold’s strong upside momentum. That was certainly evident in the best high-resolution daily proxy for worldwide gold investment demand.
That is the combined holdings of the globally-dominant GLD and IAU gold ETFs, which tend to mirror overall global investment demand reported quarterly by the World Gold Council. During that mid-2020 gold upleg achieving those last record closes, GLD+IAU holdings soared 35.3% or 460.5 metric tons! Investors were buying GLD and IAU shares faster than gold was rallying, forcing these ETFs to buy gold bullion...
Read Full Story »»»
DiscoverGold
Navigating Gold’s Path: Trends, Targets, and Signs of Short-Term Weakness
By: Bruce Powers | December 28, 2023
• As Gold tests limits, a bearish reaction at 2,091 suggests caution. Support at 2,031 becomes pivotal as the precious metal aims for a sustainable ascent.
Gold rises to a new trend low today before hitting resistance at 2,088 and backing off. It is set to end Thursday with a higher daily high and daily low but may close near lows of the day, a sign of short-term weakness. Subsequently, a decline below today’s low of 2,066 could signal the beginning of a retracement that began intraday following today’s high.

ABCD Pattern Target at 2,091 Reached; Bearish Reaction Followed
day’s high was close to hitting the 2,091 target that completes a rising ABCD pattern. The price rise in the two legs of the pattern, AB, and CD, are the same at that target. Given the bearish reaction following today’s high we can anticipate that the initial ABCD target has been reached unless there is an advance above today’s high within a few days and before price declines below the two-day low of 2,061.
Potential Pullback Targets at 2,048 and 38.2% Fibonacci at 2,044
If a continuation of the pullback is triggered on a drop below today’s low the first likely target looks to be around previous resistance at 2,048 (B) and the 38.2% Fibonacci retracement level at 2,044. Further down is the confluence of the 20-Day MA at 2,033 and the 50% retracement at 2,031. The bullish case for gold remains stronger if support is seen around the 50% retracement, at the lowest.
Weekly Support at 2,053
Also, for consideration is support at this week’s low of 2,053. A drop below it after this week will disrupt the weekly uptrend begun from the most recent swing low on December 13. Nevertheless, on the daily chart gold has been showing sign of strengthening as the 20-Day MA has recently successfully been tested as support for this first time since the trendline breakout triggered on October 18.
Eventual Rise to New Highs Anticipated
Gold looks to be getting ready to rise to a new record high, which may be sustained this time after several failed attempts over the past year. Each time a new high was reached it quickly encountered resistance leading to a correction. The latest attempt was earlier this month when a new high of 2,135 was reached.
Read Full Story »»»
DiscoverGold
Striking Gold: Charting the Path to New Highs and Targets
By: Bruce Powers | December 27, 2023
• As gold tests resistance at 2,082, the series of higher daily lows and signs of buyer dominance hint at a continued upward trajectory.
Gold triggers a bullish continuation as it breaks out from yesterday’s inside day and then triggers a new trend high above 2,071. It has since accelerated to the upside and is well on track to reach the next higher target zone around 2,091. Once reached, the initial target for a rising ABCD pattern (marked on chart) will be complete. Extended higher targets for the ABCD pattern include the 127.2% Fibonacci extension of the CD leg at 2,111, and the 161.8% extension at 2,137.

Daily Close Above 2,082 Confirms Strength
At the time of this writing, the high of the day is 2,084 and gold continues to trade near the top of the day’s range. During today’s advance the prior swing high and record high of 2,082 from May of this year was tested as resistance and looks to have stalled the ascent. However, a daily close above the 2,082-price level provides a clear signal to the 2,091-target price.
Recent Signs of Strength
Including today, gold has established a series of higher daily lows over seven days. This is a sign of strength initially seen on December 13, which completed a rising wide range green impulse candle. That is a sign that buyers are aggressively accumulating gold. Accumulation by institutional investors occurs over time. Although we’re not seeing such aggressive buying more recently, as noted above, we are seeing signs that buyers are dominating price action.
If a Pullback Comes the 20-Day MA Should be Support
Regardless of the potential for reaching the next higher target at 2,091, in the near term a pullback could come first. This is especially true given the signs of resistance seen following today’s high. A drop below today’s low of 2,061 points to a likely pullback. If a retracement from today’s high does occur the short and intermediate moving average lines is where support would be expected to be found. The first is the 20-Day MA, which currently resides at 2,032, while the 50-Day MA is near the internal uptrend line at 2,001. Note that the 50-Day line has converged with the trend line, highlighting that price area as a more significant dynamic support zone.
Read Full Story »»»
DiscoverGold
Gold’s Resilience: Multi-Timeframe Bullish Signals Hint at Upside
By: Bruce Powers | December 26, 2023
• Gold’s strength is evident across various timeframes, from the monthly chart confirming a bullish continuation to weekly signals post-retracement, suggesting a potential upside breakthrough.
Gold consolidates on Tuesday, trading inside day, as it sets up for a continuation higher. An advance above today’s high of 2,065 triggers a breakout of the inside day, signaling strength and the potential to trigger a continuation signal on a move above last week’s high of 2,071. The completion of a rising ABCD pattern is then targeted at 2,091 (D).

Monthly Bullish Signal Points to Higher Prices
A bullish continuation signal occurred in December on the monthly chart as gold advanced above November’s high of 2,052. Strength was confirmed on subsequent daily and weekly closes above that monthly high. In addition, gold is set to complete December above November’s high, which will confirm strength on the monthly chart. A monthly close for December, above the halfway point of the month’s range, will be a stronger indication for gold rather than a monthly close below the halfway point. The halfway point for December’s trading range is at 2,054, below where it is currently trading, around 2,063.
Weekly Bullish Signal as Well
Moreover, there are also recent bullish signals in the weekly time frame following the retracement bottom at 1,973 (A). A bullish reversal triggered last week on a move above the prior weekly high at 2,048. Strength was subsequently confirmed on last week’s close above that high.
Bullish on Multiple Time Frames
In summary, gold is showing bullish signs on multiple time frames. The monthly, weekly, and daily charts are all bullish and each recently confirmed the completion of a correction, followed by signs of strength. Typically, this type of price behavior leads to a continuation to the upside. How gold goes about reaching higher prices is where there is a question. Does it reach the initial target (D) prior to a pullback of note? Or does it pullback first, test support levels, and then turn higher? We’ll be watching for either scenario.
Short term Weakness May Test Support at 20-Day MA
A pullback lower soon could easily see gold test support around the 20-Day MA, currently at 2,030. The 20-Day line acted as support over several days the past two weeks, ending with price rising. If it is approached again, support should be seen at or above the line for the near-term bullish outlook in gold to be maintained.
Read Full Story »»»
DiscoverGold
I-80 Gold Corp.
Bullish chart ✔️
Jack Chan: Gold Price Exclusive Update
By: Jack Chan | December 23, 2023

Our proprietary cycle indicator is UP.
To public readers of our updates, our cycle indicator is one of the most effective timing tool for traders and investors. It is not perfect, because periodically the market can be more volatile and can result in short term whipsaws. But overall, the cycle indicator provides us with a clear direction how we should be speculating.
Investors
Accumulate positions during an up cycle and hold for the long term.
Traders
Enter the market at cycle bottoms and exit at cycle tops for short term profits.
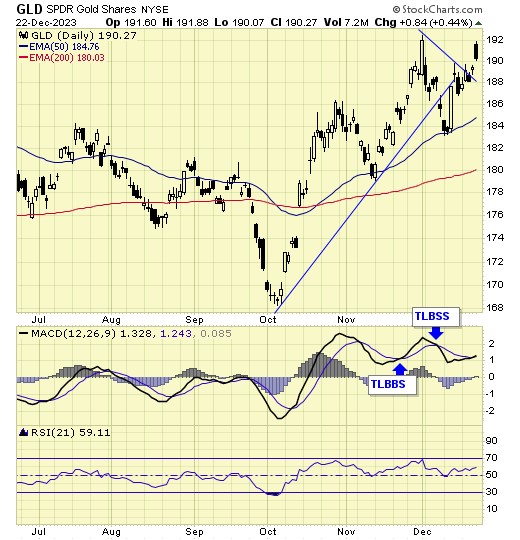
GLD is on short term sell signal.
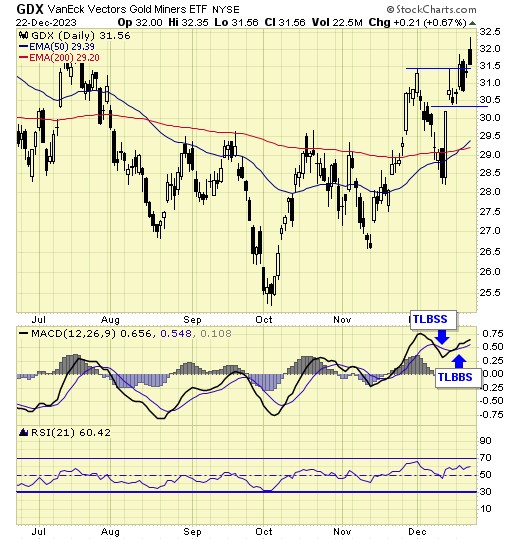
GDX is on short term buy signal.
XGD.to is on short term sell signal.
GDXJ is on short term buy signal.
Analysis
Current data favors overall higher prices.
Our ratio is on buy signal.
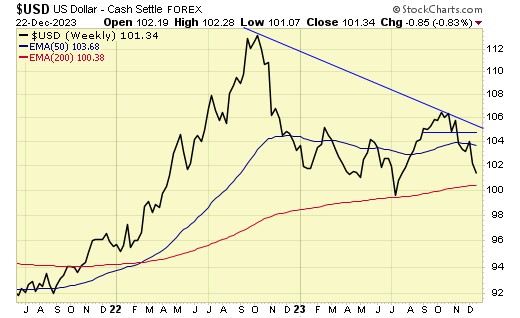
Trend is DOWN for USD.
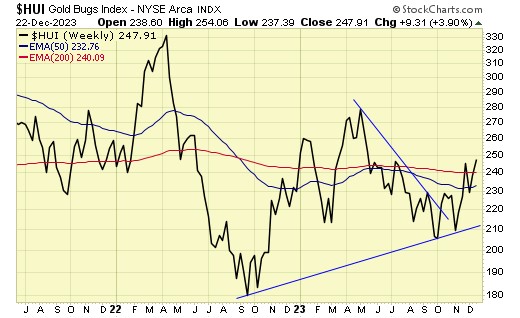
Trend is UP for gold stocks.
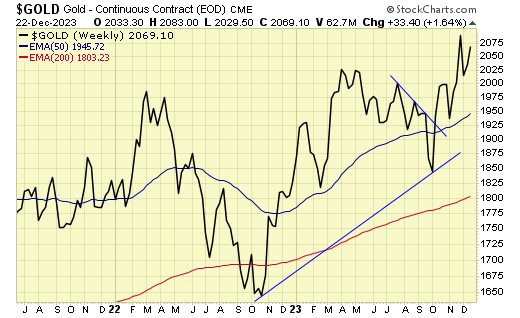
Trend is UP for gold.
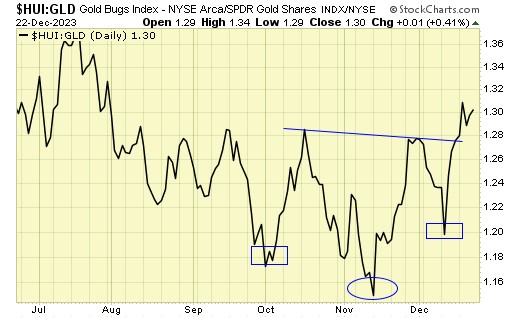
Our ratio of $HUI:GLD has confirmed an inverted head & shoulder bottom.
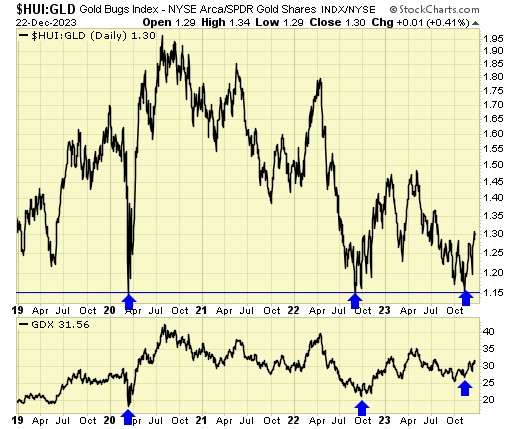
Our ratio is bouncing off major support.
Summary
Gold sector cycle is up.
Trend is up for gold and gold stocks, and down for USD.
$$$ We are fully invested.
Read Full Story »»»
DiscoverGold
Gold CoT: Peek Into Future Through Futures, How Hedge Funds Are Positioned
By: Hedgopia | December 23, 2023
• Following futures positions of non-commercials are as of December 19, 2023.
Gold: Currently net long 201.3k, up 13.1k.

Three weeks ago, no sooner did gold break out of $2,080s than it quickly met with a nasty reversal. This level has a lot of memory attached to it. In August 2020, the metal posted a new all-time high of $2,089 and retreated. This occurred again in March last year when it printed $2,079 and in May this year when $2,085 was tagged.
After the 4th reversal, gold stabilized just above the rising 50-day with a tag of $1,988 on the 13th, rallying back above $2,000 in the very next session. Yet, come Friday this week, as soon as the yellow metal rallied to $2,083, offers overwhelmed bids, closing the session/week at $2,069/ounce.
So, $2,080s it is for the bugs – a make-or-break.
Read Full Story »»»
DiscoverGold
NY Gold Futures »» Weekly Summary Analysis
By: Marty Armstrong | December 23, 2023
NY Gold Futures opened above the previous high and closed above it as well warning of a bullish posture right now. This market is above all our indicators at this time reflecting it is moving higher over recent activity. At this time, the market closed today at 20691. Caution is now required for this market is starting to suggest it may rally further on the MONTHLY level.
At the moment, this market has been rising for this month going into December reflecting that this has been only still, a bullish reactionary trend. As we stand right now, this market has made a new high exceeding the previous month's high reaching thus far 21523 while it has not broken last month's low so far of 19356. Nevertheless, this market is still trading above last month's close of 20572.
Up to now, we still have only a 1 month reaction rally from the low established during October. We must exceed the 3 month mark in order to imply that a trend is developing.
ECONOMIC CONFIDENCE MODEL CORRELATION
Here in NY Gold Futures, we do find that this particular market has correlated with our Economic Confidence Model in the past. The Last turning point on the ECM cycle low to line up with this market was 2022 and 2015. The Last turning point on the ECM cycle high to line up with this market was 2020 and 2011 and 1996.
MARKET OVERVIEW
NEAR-TERM OUTLOOK
The historical perspective in the NY Gold Futures included a rally from 2015 moving into a major high for 2023, the market has pulled back for the current year. The last Yearly Reversal to be elected was a Bullish at the close of 2022 which signaled the rally would continue into 2023.
This market remains in a positive position on the weekly to yearly levels of our indicating models. Pay attention to the Monthly level for any serious change in long-term trend ahead.
The perspective using the indicating ranges on the Daily level in the NY Gold Futures, this market remains in a bullish position at this time with the underlying support beginning at 20610.
On the weekly level, the last important high was established the week of December 4th at 21523, which was up 9 weeks from the low made back during the week of October 2nd. Afterwards, the market bounced for 9 weeks reaching a high during the week of December 4th at 20106. Since that high, we have been generally trading down to sideways for the past 2 weeks, which has been a significant move of 5.705% in a reactionary type decline. Nonetheless, the market still has not penetrated that previous low of 18235 as it has fallen back reaching only 4523 which still remains -75.1% above the former low.
When we look deeply into the underlying tone of this immediate market, we see it is currently still in a semi neutral posture despite declining from the previous high at 21523 made 2 weeks ago. Still, this market is within our trading envelope which spans between 17610 and 22050. The broader perspective, this current rally into the week of December 4th has exceeded the previous high of 20197 made back during the week of October 23rd. This immediate decline has thus far held the previous low formed at 18235 made the week of October 2nd. Only a break of that low would signal a technical reversal of fortune and of course we must watch the Bearish Reversals. Right now, the market is neutral on our weekly Momentum Models warning we have overhead resistance forming and support in the general vacinity of 20014. Additional support is to be found at 19356. Looking at this from a wider perspective, this market has been trading up for the past 7 weeks overall.
INTERMEDIATE-TERM OUTLOOK
YEARLY MOMENTUM MODEL INDICATOR
Our Momentum Models are declining at this time with the previous high made 2020 while the last low formed on 2023. However, this market has rallied in price with the last cyclical high formed on 2023 and thus we have a divergence warning that this market is starting to run out of strength on the upside.
Looking at the longer-term monthly level, we did see that the market made a high in May at 20854. After a six month rally from the previous low of 19360, it made last high in May. Since this last high, the market has corrected for six months. However, this market has held important support last month. So far here in December, this market has held above last month's low of 19356 reaching 19879.
This market is trading beneath that high of May which was 20854 by 0.78%. Critical support still underlies this market at 18107 and a break of that level on a monthly closing basis would warn of a further decline ahead becomes possible. Nevertheless, at this time, the market is still holding and is trading above last month's high.
DiscoverGold
Crucial Signals: Gold’s Weekly Breakout and Potential High Targets
By: Bruce Powers | December 23, 2023
• Despite a slight intraday pullback today, gold stands resilient, successfully testing support recently at the 50-Day and 20-Day MAs, reflecting its underlying strength.
Gold continued to strengthen on Friday as it exceeded Thursday’s high of 2,048 and is on track to close above that high. Moreover, that high is a weekly high from last week and if gold closes above 2,048 a bullish breakout on the weekly time frame will be confirmed thereby providing another sign of strength and opening the door to higher prices. Nevertheless, in the short-term resistance was seen at today’s high of 2,071, leading to an intraday pullback. That high is almost an exact match with the swing high and prior record high from March 2022.

Support at 50-Day and 20-Day MAs Signifies Gold’s Strength
At the time of this writing gold is on track to close relatively weak, below the halfway point of today’s trading range. However, in the larger picture gold remains strong and on track to attempt new highs again. During the most recent retracement, it successfully tested and held support of the 50-Day MA (orange) at the December 13 swing low. Subsequently, the 20-Day MA was successfully tested as support beginning last Friday. These are bullish signs for gold.
Measured Moves Suggest Potential Higher Target of 2,187
Today we look at recent measured moves to derive a potential higher target for gold. Relative moves and targets are marked with a rising purple line and labeled 1, 2, and 3. The first two moves saw the price of gold appreciate by approximately 199 to 215 points, or 11% to 11.1%, respectively. Since the two moves are almost an exact match the third move (3) may match or exceed the prior moves or swings. The third move starts from the most recent swing low of 1,973 on December 13. It will complete a 214 point or 10.8% advance at a new record high of 2,187. This provides a guide as to what could be possible when gold moves to new record highs.
Certainly, the are plenty of other possible higher targets for gold but this is a relatively simple approach to identify an initial new high target area. And it is not out of reach as the current record high is only a little lower at 2,145. Moreover, that target area is also marked by a 127.2% Fibonacci extension of the bearish retracement begun from the May 4, 2023, swing high.
Read Full Story »»»
DiscoverGold
Charting Gold’s Path: Resistance Tests and Bullish Breakout Signals
By: Bruce Powers | December 21, 2023
• As gold dances near resistance, a look at monthly and weekly trends reveals crucial breakout moments, setting the stage for potential bullish momentum.
Gold further tests resistance near the top of the current advance as it breaks out from Wednesdays inside day pattern. The top of the trend was 2,048 and today’s high was 2,046. It sure looks like gold wants to progress higher, but it needs to first trigger an advance above 2,048 and then close above that price level to confirm strength.

Initial ABCD Pattern Target is 2,091
The initial target from the current rally is up around 2,091. Once reached, that target completes the rising ABCD pattern as shown on the chart. Interim price levels are marked lower but they may be busted through relatively easily. Of course, this assumes the bullish momentum can be sustained or accelerated. Gold managed to rise back above its 20-Day MA six days ago and the moving average continued to reflect support following that rise. Gold is set to continue higher, but it first needs to break out above 2,048 and then keep rising. However, that may not occur until next week.
Momentum Should Trigger Again on Weekly Breakout
This week is on track to complete an inside week where this week’s trading activity happened at prices also traded last week. An upside signal is needed to trigger a weekly bullish breakout and therefore a continuation of the rally. Last week’s high was 2,048 and this week’s high is 2,047. Certainly, a bullish breakout can occur tomorrow on Friday, but if not, it can be anticipated for next week.
Although the 20-Day MA has been acting as support in recent days, until there is a rally above last week’s high that support zone remains at risk of being tested as support. If so, it could fail to hold as support and lead to a deeper bearish retracement.
Monthly Bullish Breakout Signal Earlier this Month
Earlier this month, a monthly continuation bullish breakout occurred on a rise above last month’s high of 2,052. A monthly close for December above November’s high would confirm the strength of the breakout. Further, a monthly close above November’s close of 2,036 would indicate greater strength than if the close is below that price level. Either way, a monthly breakout occurred, which is bullish for the lower weekly and daily time periods.
Read Full Story »»»
DiscoverGold
Momentum Building: Gold Eyes Higher Targets Amidst Pattern Developments
By: Bruce Powers | December 20, 2023
• As gold eyes targets at 2,070 and 2,082, a potential rising ABCD pattern unfolds, hinting at a surge in demand that may overcome resistance barriers.
Gold stalls out and trades inside day with a relatively narrow trading range. Yet, it remains well positioned to continue its ascent. Support around the 50-Day MA (orange) was successfully tested at the low of the recent correction ended last week. Following an advance off the 50-Day line gold rose back above the shorter period 20-Day MA (red). The 20-Day line was then successfully tested as support over the prior three trading days. This is a sign of strengthening as upward momentum improves and demand is sustained.

Advance Above 2,043 is Bullish
A rally above today’s high of 2,043 is short-term bullish. But gold really needs to get above the trend high at 2,048 before a more reliable continuation signal is generated. Initial higher targets are either shown on the chart with Fibonacci levels or a black horizontal line that marks previous swing high of some significance. For example, both the 2,070 and 2,082 level are from prior swing highs and record highs at the time.
Forming Bullish ABCD Pattern
Following the 1,973-retracement low from last week gold formed a potential rising ABCD pattern where we’re looking for a match between the CD leg of the rally and the rising AB leg. Once the CD leg matches the price change from the AB leg, a pivot level is identified at the completion of the pattern. Either a bearish reversal may follow or gold breaks through the price level to continue higher.
ABCD Pattern Targets 2,091
The first target from the rising ABCD pattern is at 2,091. Upward momentum represented by the rising ABCD pattern might be able to bust through lower potential resistance levels with little hesitation. This is not a prediction, just information to be aware of.
The ABCD pattern, sometimes called the zig zag or lightning bolt pattern, occurs relatively frequently in financial markets. It reflects the tendency towards similarity or mathematical relationships between the size of different price swings within the same instrument. As the ABCD pattern advances it may show a degree of power or strength of demand that can push price through potential resistance barriers.
Read Full Story »»»
DiscoverGold
|
Followers
|
403
|
Posters
|
|
|
Posts (Today)
|
2
|
Posts (Total)
|
43488
|
|
Created
|
01/21/05
|
Type
|
Free
|
| Moderators NYBob DiscoverGold | |||
GOLDBUGS - I-hub's #1 precious metals board was created for those with an affinity for the yellow stuff.
Gold has a long history as a hedge against inflation, and in these challenging times it seems prudent to have a certain portion of your portfolio in gold and other precious metals.
For the novice or experienced trader investing in mining stocks or NYMEX, bullion or coins, exploration stocks or producers, you'll find others with similar interests.
Whether a technical or fundamental trader, long or short term, your questions and input are welcomed and appreciated.
"The GOLDBUGS board" is the place where Goldbugs live.
Articles, technical analysis, charts, and data of interest to goldbugs are all welcome here. Information concerning currencies and commodities are also welcome as these markets influence the PM's.
Rules of the Road:
1) No insults or bashing of another member.
2) Members will maintain an attitude of humility.
3) Members who find they are able to help another member will do so.
If you find the board useful please let us know by clicking the "Add To Favorites" link.


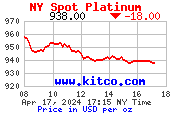
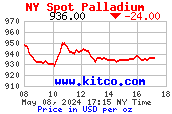


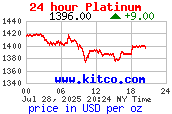


| Volume | |
| Day Range: | |
| Bid Price | |
| Ask Price | |
| Last Trade Time: |


