 News
News  Market Data
  Discover
Support: 888-992-3836
Copyright © 2023 InvestorsHub Inc.


Register for free to join our community of investors and share your ideas. You will also get access to streaming quotes, interactive charts, trades, portfolio, live options flow and more tools.
Gold’s Marginal High and Habitual Cry
By: Mark Mead Baillie | May 26, 2024

We start with this from the “Pat on the Back Dept.” Per the prior missive penned a week ago (“Another Gold All-Time High is Nigh”), ’twas therein stated that Gold (then 2420) was exhibiting sufficiently daily trading range such that one could reasonably expect a fresh All-Time High (above 2449) to occur as soon as last Monday … which is precisely what happened, the yellow metal trading up to 2454 … but that was it.
So let’s thus transit from that department to the “Pass the Hankie Dept.” as Gold’s new All-Time High was at best “marginal”. And All-Time Highs recorded by Gold since at least the COVID years-to-date have then — oft with promptness — seen price go through “habitual” selling. To wit: following Monday’s 2454 high, the yellow metal this past week hastily traded down -128 points to as low as 2326 before settling yesterday (Friday) at 2335. So yes, you may cry.
Yet we offer this broader-based solace. Century-to-date, Gold has amassed 5,887 trading days, of which All-Time Highs have been registered on 268 occasions. For those of you scoring at home, that means across these past 24 calendar years, Gold averages a fresh All-Time High every 22 trading days, which essentially is once per month, albeit that is far from linear: for the nearly nine-year stint from 07 September 2011 to 27 July 2020, nary an All-Time High was notched, price in that duration dropping as much as -46% down to 1045 on 03 December 2015.
‘Course more recently, not every incremental All-Time Gold High since the COVID outbreak in 2020 has then been swiftly sold off. And yet, an inevitably habitual pattern of selling certainly is made manifest by the following chronological table of just how far Gold — following a run of All-Time Highs — has then declined within one month:

And the low row in the above table reflects last Monday’s All-Time High at 2454. Note therein the decline with only four trading days having since passed, price already having come off by as much as -5.2%.
Now hardly are we bearish on Gold: but ‘twould not be untoward to see price glide lower still given Gold having just crossed below our Market Values “smooth valuation line” for the first time since 28 February. As you seasoned website followers know, eclipsing that line to the downside (be it for any of the five primary markets which comprise BEGOS, i.e. the Bond / Euro / Gold / Oil / S&P) regularly leads to further selling as we below show. Note this latest negative price crossover as encircled in red, (the lower panel oscillator being price less valuation):
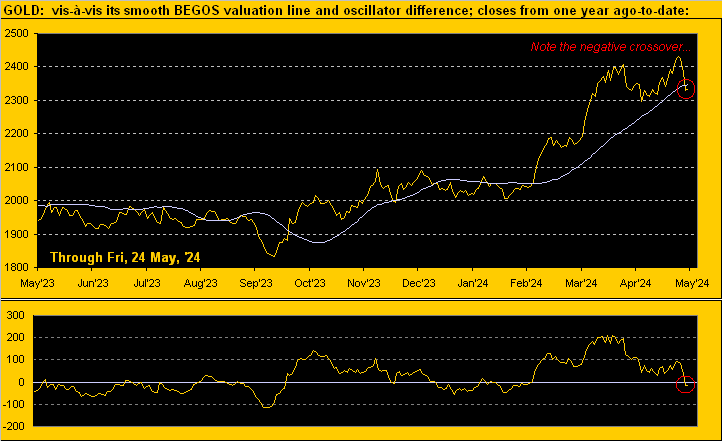
Specific to the current crossover, ’twas confirmed as of Thursday’s close at 2331. Year-over-year, ’tis the ninth such downside crossover. For the prior eight, the average negative penetration within one month is -65 points, (the median being -56 points). Thus in that vacuum alone, we’d see Gold 2275-2266 over the near term. ‘Course, rarely is “average” reality: there is pricing congestion for Gold from 2364-2285 to at least initially limit any truly material downside from here (2335). Still, we’re again placing for perspective purposes the underlying structural support zone of 2247-2171 on Gold’s weekly bars graphic — the crybabies notwithstanding — from one year ago-to-date. (Note at lower-right an Investing Age of Stoopid intruder…):

“Yeah, it snuck right past me, mmb“
Well, Squire, they’ll do anything and everything to convince you to dump Gold for “GameFlop” (GME, p/e 950x). But true to ongoing form, such Investing Age of Stoopid continues to run its inevitably-ending course, the “live” price/earnings ratio of the S&P 500 (aka “Casino 500”) now 39.4x and yield 1.380% versus the U.S. annualized three-month rate of 5.245%. The S&P’s market-capitalization is now $46.3T supported by a liquid U.S. Money Supply (M2) of only $21.3T. ‘Course when you WestPalmBeachers are sufficiently shaken to sell along with the rest of the herd, your brokers shall all be good for the money, right? (Recall, too, the ten stock market crash catalysts itemized in Gold Update no. 712 from last 08 July: today, all ten remain firmly bona fide).
Speaking of crash catalysts, we’ve some good news as regards the StateSide economy. Incoming metrics this past week for the Economic Barometer were so sparse (just five inputs), that it suffered limited additional damage. Next week is again rather light as well with just nine metrics due, notably including the Fed-favoured inflation gauge of Personal Consumption Expenditures for April which is not expected to have slowed from March’s annualized pace of +3.6%. But net-net by consensus, the Baro looks to be lower still in a week’s time as stagflation creeps ‘cross the nation:

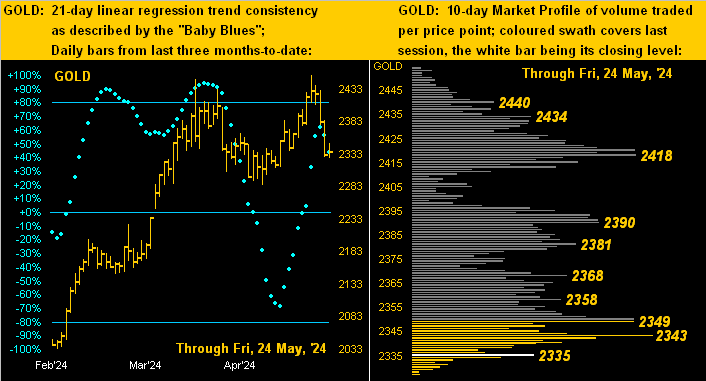
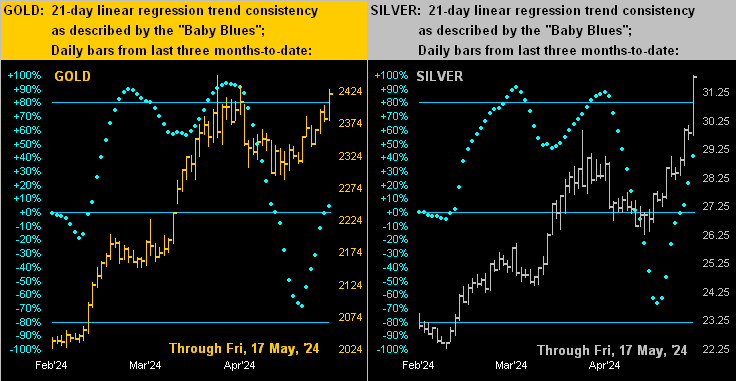
Hardly was Gold’s decline this past week at a crawl. The yellow metal’s net two-day drop (from Tuesday’s settle at 2425 to that for Thursday at 2331) was -94 points: that ranks ninth-worst by points for any two-day span century-to date; (the like -3.9% drop has been worse on many two-day occasions, the most extreme being -13.3% in mid-April 2013). Still, the week’s fallout was enough to drive price from nearly the top of its 10-day Market Profile toward the bottom per the below right hand panel. The left-hand panel of Gold’s daily bars from three months ago-to-date depicts the baby blue dots of trend consistency having just turned lower. Again as aforementioned, the 2364-2285 area is price-congestive, and thus for now, supportive:
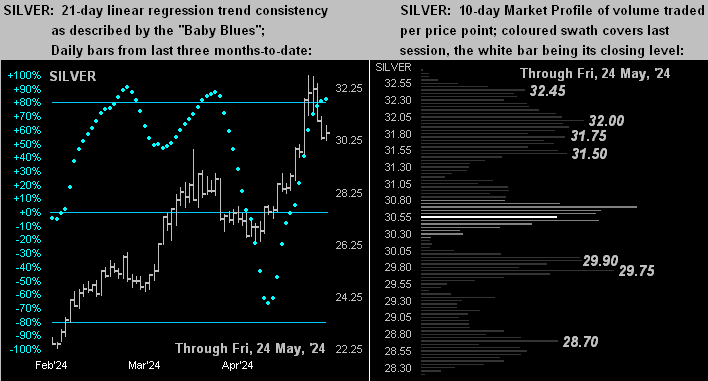
As for Silver, her two-day (Tue-Thu) drop was -5.8%. But unlike Gold, hardly did she hoover her whole Market Profile, basically finishing in the center of that two-week stack (below right). Too, her “Baby Blues” have (yet) to lurch lower per the three-month stint (below left). Indeed ’tis heartening to see Silver Silver getting some degree of respect lately. Further, she remains quite cheap relative to Gold, even as the Gold/Silver ratio (as noted a week ago) has moved sub-80x. Today ’tis 76.5x … however the century-to-date average is 68.3x. So priced at that average with Gold at 2335 today, Silver would be +12% higher than her current 30.54 level at 34.21:
Our takeaway is: ‘twould be folly not to anticipate lower Gold prices near-term. In addition to price having just crossed beneath the aforeshown smooth valuation line, we’ve the following technical negatives: Gold’s daily Parabolics flipped from Long to Short effective yesterday’s open as did the MACD (moving average convergence divergence); the daily Price Oscillator is dwindling and the Moneyflow is nearing a cross from inflow to outflow.
Still, with prudent cash management always paramount — and acknowledging that “shorting Gold is a bad idea” — let’s wrap with the stack:
The Gold Stack
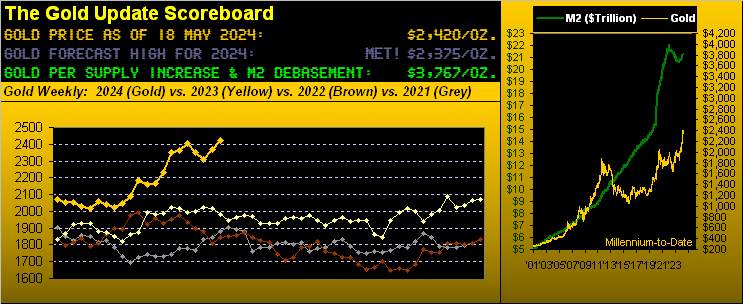
Gold’s Value per Dollar Debasement, (from our opening “Scoreboard”): 3769
Gold’s All-Time Intra-Day High: 2454 (20 May 2024)
2024’s High: 2454 (20 May 2024)
Gold’s All-Time Closing High: 2430 (20 May 2024)
10-Session “volume-weighted” average price magnet: 2385
Trading Resistance: various per the Profile from here at 2335 up to 2440Gold Currently: 2335, (expected daily trading range [“EDTR”]: 38 points)
10-Session directional range: down to 2326 (from 2454) = -128 points or -5.2%
Trading Support: none per the ProfileThe Weekly Parabolic Price to flip Short: 2263Structural Support: 2247-2171The 2000’s Triple-Top: 2089 (07 Aug ’20); 2079 (08 Mar’22); 2085 (04 May ’23)The 300-Day Moving Average: 2046 and rising2024’s Low: 1996 (14 February)The Gateway to 2000: 1900+The Final Frontier: 1800-1900The Northern Front: 1800-1750On Maneuvers: 1750-1579The Floor: 1579-1466Le Sous-sol: Sub-1466The Support Shelf: 1454-1434Base Camp: 1377The 1360s Double-Top: 1369 in Apr ’18 preceded by 1362 in Sep ’17Neverland: The Whiny 1290sThe Box: 1280-1240
‘Course the bottom line is, regardless of its marginal high but then habitual cry, don’t miss out when Gold goes to the sky!
Read Full Story »»»
 DiscoverGold
Jack Chan: Gold Price Exclusive Update
By: Jack Chan | May 25, 2024

Our proprietary cycle indicator is now DOWN.
To public readers of our updates, our cycle indicator is one of the most effective timing tool for traders and investors. It is not perfect, because periodically the market can be more volatile and can result in short term whipsaws. But overall, the cycle indicator provides us with a clear direction how we should be speculating.
Investors
Accumulate positions during an up cycle and hold for the long term.
Traders
Enter the market at cycle bottoms and exit at cycle tops for short term profits.

GLD is on short term sell signal.

GDX is on short term sell signal.

XGD.to is on short term sell signal.

GDXJ is on short term sell signal.
Analysis

Current data favors overall lower gold prices.

Our ratio is on buy signal.

Trend is UP for USD.

Trend is UP for gold stocks.

Trend is UP for gold.

A double top so far.

A five wave pattern is now complete. Looking for a zigzag correction.

A diamond bottom is in progress.
Summary
Gold sector cycle is now down.
Trend is up for gold and gold stocks..
$$$ We were stopped out with a small profit.
Read Full Story »»»
DiscoverGold
Gold Forecast: Gold Nearing Key Countertrend Low
By: Jim Curry | May 26, 2024
From the comments made in recent months, Gold's upward phase was favored to hold up into the mid-April timeframe, before turning south into a (countertrend) correction low, made into late-May to early-June. With the most recent decline in the metal, we are moving into the expected range for a key bottom to form.
Gold's 72-Day Cycle
As per some of my past articles, the last peak of significance was expected to come from our 72-day time cycle, which is currently the most dominant cycle in the Gold market.
Here again is that 72-day cycle:
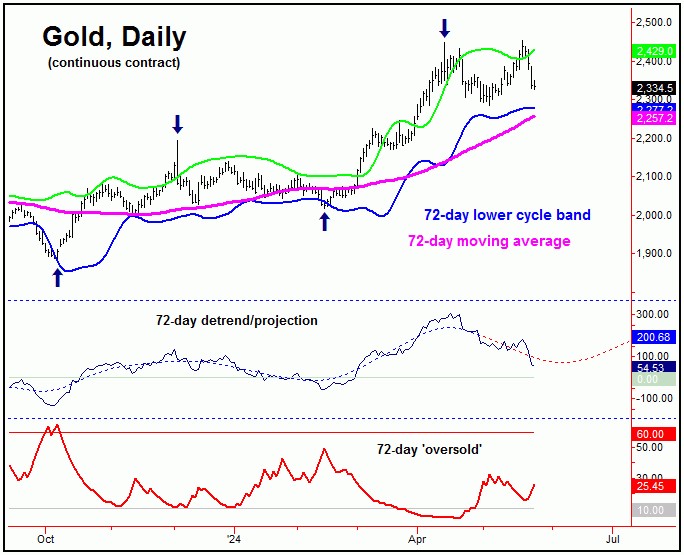
As pointed out back in March, the average rallies with this 72-day cycle - when coming off the expected pattern of a 'higher-low' - took around 39 trading days before completing. That action favored its most recent upward phase to remain intact until the April 9th timeframe or later, which was seen - with the metal spiking up to an April 12th peak of 2448.80 (June, 2024 contract).
In terms of price, Gold proceeded to drop to a May 3rd low of 2285.20 - a decline of 6.6% from the 2448.80 swing high, a normal low-end decline with this 72-day cycle. However, from there, the metal proceeded to rally back to a minor new high for the swing, doing so with the 2454.20 figure, made on May 20th.
Diverging Technicals at Recent Swing High
With the recent action, there is at least some potential that our 72-day bottomed out back in early-May. Having said that, the most recent spike high was not confirmed by technical action - as per our Gold Timing Index, shown on the chart below:
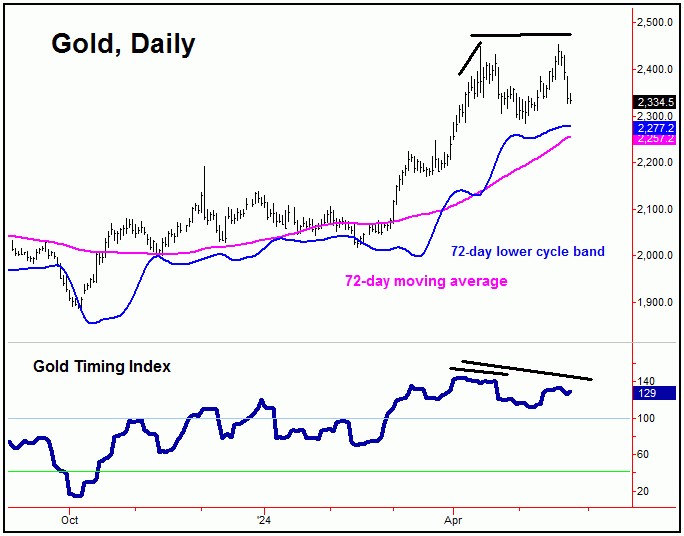
Our Gold Timing Index is our (proprietary) measure of momentum for the Gold market. That is, when price makes a higher high - and the indicator does not follow - a divergence is seen, and with that is viewed as a technical negative.
What normally follows is a sharp decline in price, in order to correct that divergence.
As mentioned in my last article, a divergence was seen between our Gold Timing Index and price at the April 12th spike high - which gave way to a 6.6% decline into early-May.
From there, however, a spike back to higher highs was seen into May 20th, though - as mentioned above - with our Timing Index having registered yet another divergence. With that, we pointed out (in our Gold Wave Trader report) the potential for another sharp correction, some of which has been seen with the decline into last week.
Price/Time Considerations
Going back to our 72-day cycle, in regards to price, we normally expect to see a drop back to the lower 72-day cycle band as this wave bottoms out - something that has been seen prior to 85-90% of the lows for this particular wave.
In terms of time, this 72-day cycle is still projecting a bottom in the coming weeks, and with that - until proven otherwise - we would like to see additional weakness playing out, then to be on the lookout for technical signs of a bottom forming with this component.
The above is key, as - following countertrend lows with this 72-day cycle - the following upward phases have seen rallies of some 10-14% or more. With that, we will be looking for indications to re-enter the long side going forward, based on the position of our 72-day cycle, as well as due to technical considerations.
The Big Picture for Gold
For the bigger picture, the larger upward phase has come from our bigger 310-day cycle - as well as the even-larger four-year wave - with the smaller 310-day component shown on the chart below:
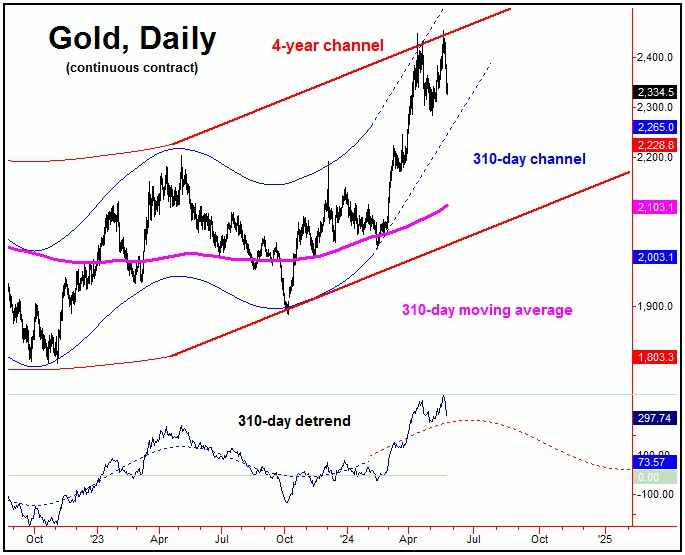
As mentioned back in the Autumn of last year, the last mid-term low was expected to come from this 310-day wave. In terms of price, the average rallies with this cycle were noted as having been some 20-25% off the bottom.
The upward phase of our 310-day cycle was confirmed to be back in force back in late- October of last year, thus indicating a 20-25% rally to be underway - and lasting into the Spring of this year. This was met with the strength into April/May.
Even said, with our detrend that tracks this wave looking for additional (time) strength, the overall assumption is that higher highs will be seen with this 310-day wave, upon the completion of the short-term correction, coming from the 72-day cycle.
The Four-Year Cycle in Gold
Above our 310-day wave, the largest-tracked cycle in Gold is the four-year component, which last bottomed back in October, 2022.
Here is that four-year wave:
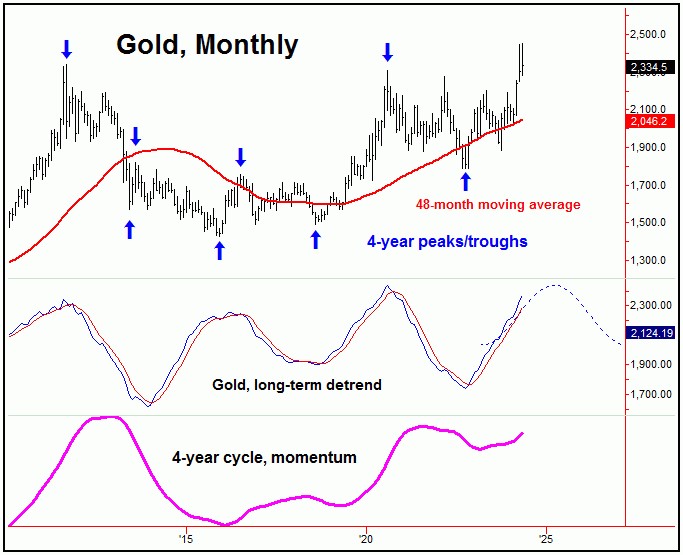
As can be seen on the above chart, our last four-year trough for Gold was made back in October, 2022. In terms of time, the upward phase of this wave is favored to remain intact until later next year, where it should peak again - giving way to another decline into what (tentatively) looks to be the late-2026 timeframe.
With the above said and noted, the overall positioning of the 310-day and four-year cycles tell us that Gold should remain in a larger bull market phase for at least the next year or more, though with the various corrections in-between, coming from the smaller-degree waves (such as the 72-day cycle).
In terms of price, we have recently confirmed an upside target with this four-year cycle in Gold, which gives us a precise level that we expect to reach going forward - with exact details of this target posted in our thrice-weekly Gold Wave Trader market report.
Read Full Story »»»
DiscoverGold
NY Gold Futures »» Weekly Summary Analysis
By: Marty Armstrong | May 25, 2024
Next Monday is Memorial Day, which is a holiday in the United States. NY Gold Futures closed today at 23345 and is trading up about 12% for the year from last year's settlement of 20718. Caution is required for this market is starting to suggest it may now decline on the MONTHLY level. Presently, this market has been rising for 6 months going into May suggesting that this has been a bull market trend on the monthly time level which has been confirmed by electing all of our model's long-term Bullish Reversals from the key low. As we stand right now, this market has made a new high exceeding the previous month's high reaching thus far 24542 while it has not broken last month's low so far of 22491. Nevertheless, this market is still trading above last month's close of 23029.
ECONOMIC CONFIDENCE MODEL CORRELATION
Here in NY Gold Futures, we do find that this particular market has correlated with our Economic Confidence Model in the past. The Last turning point on the ECM cycle low to line up with this market was 2022 and 2015. The Last turning point on the ECM cycle high to line up with this market was 2020 and 2011 and 1996.
MARKET OVERVIEW
NEAR-TERM OUTLOOK
The NY Gold Futures has continued to make new historical highs over the course of the rally from 2015 moving into 2024. However, this last portion of the rally has taken place over 9 years from the last important low formed during 2015. We have elected four Bullish Reversals to date.
This market remains in a positive position on the weekly to yearly levels of our indicating models. Pay attention to the Monthly level for any serious change in long-term trend ahead.
Looking at the indicating ranges on the Daily level in the NY Gold Futures, this market remains moderately bearish position at this time with the overhead resistance beginning at 23387 and support forming below at 23182. The market is trading closer to the resistance level at this time.
On the weekly level, the last important low was established the week of April 29th at 22852, which was down 3 weeks from the high made back during the week of April 8th. So far, this week is trading within last week's range of 24542 to 23263. Nevertheless, the market is still trading downward more toward support than resistance. A closing beneath last week's low would be a technical signal for a correction to retest support.
When we look deeply into the underlying tone of this immediate market, The broader perspective, this current rally into the week of May 20th reaching 24542 has exceeded the previous high of 24488 made back during the week of April 8th. That high was likewise part of a bullish trend making higher highs over the week of January 29th. We have seen a rally thus far from the last low of 22852 for the past 3 weeks. Only a break of that low would signal a technical reversal of fortune, however, the market remains strong at this time. Right now, the market is neutral on our weekly Momentum Models warning we have overhead resistance forming and support in the general vacinity of 22852. Resistance is to be found starting at 23402. Looking at this from a wider perspective, this market has been trading up for the past 3 weeks overall.
INTERMEDIATE-TERM OUTLOOK
YEARLY MOMENTUM MODEL INDICATOR
Our Momentum Models are declining at this time with the previous high made 2020 while the last low formed on 2023. However, this market has rallied in price with the last cyclical high formed on 2023 and thus we have a divergence warning that this market is starting to run out of strength on the upside.
Interestingly, the NY Gold Futures has been in a bullish phase for the past 17 months since the low established back in November 2022.
Critical support still underlies this market at 20030 and a break of that level on a monthly closing basis would warn that a sustainable decline ahead becomes possible. Nevertheless, the market is trading above last month's high showing some strength.
DiscoverGold
once spot snaps the neck line of futures, its blue skies. all the noise below will be for dwelling on the past.

Gold CoT: Peek Into Future Through Futures, How Hedge Funds Are Positioned
By: Hedgopia | May 25, 2024
• Following futures positions of non-commercials are as of May 21, 2024.
Gold: Currently net long 229.8k, up 25.3k.

Non-commercials raised net longs in gold futures to the highest since April 2022. They were probably lured into the trade by the metal’s recent strength. This month, gold rallied from $2,285 on the 3rd to $2,454 on the 20th, with the latter a fresh record, surpassing the recent all-time high of $2,449 posted on April 12th.
However, gold bugs were unable to latch on to the 20th (this Monday) high. By the end of the week, the yellow metal gave back 3.4 percent to $2,335/ounce.
More weakness probably lies ahead, particularly if the bulls are unable to defend the 50-day moving average at $2,319. There is decent support at $2,240s.
Read Full Story »»»
DiscoverGold
Gold Weekly Price Forecast – Gold Continues to See Volatility as We Consolidate
By:
Christopher Lewis
Updated: May 24, 2024, 18:47 GMT+00:00
The gold market has fallen hard this week, but at this point in time, it is worth knowing
that the market will continue to be in an uptrend at this point, and that hasn’t changed.


Gold Faces Resistance, Eyes 50-Day MA
By: Bruce Powers | May 24, 2024
• After reaching support at 2,325, gold bounces to 2,347 but finds resistance, suggesting further decline towards the 50-Day MA.
Gold stalled its bearish retracement today with a narrow range day after dropping briefly below yesterday’s low to reach support at 2,325. Subsequently, an intraday bounce found resistance at the 20-Day MA with a high for the day at 2,347. Both the narrow range day with consolidation near the lows of Thursday’s trading range and a successful test of prior support as resistance, are potentially bearish indications that may occur in downtrends.
Further, trading is occurring back near the lows of the day at the time of this writing, and therefore gold may close weak, in the bottom third of the day’s range. And unless something changes in the next few hours it will end the week with a large red candlestick pattern, closing near the lows of the week.

Weekly Breakdown Triggered
Yesterday, gold triggered a breakdown below last week’s low of 2,332. A daily close below that price level will confirm the bearish implications. But it will then depend on what happens after that. Nevertheless, given today’s sustained selling pressure it looks like the 50-Day MA around 2,309 is next on the agenda. The successful test of resistance at the 20-Day line today is a small clue that the retracement is likely to continue to lower prices.
Whether it has the potential to fall below the 50-Day MA remains to be seen. Certainly, it is an important trend indicator for the current advance especially since the 20-Day line has failed to stop the decline. Yesterday’s selloff was clear with little hesitation as the 20-Day line was broken.
Anticipating Test of Support at 50-Day MA
If support can be found at or above the 50-Day MA, a continuation of the rally may follow. However, a sustained drop below it puts the recent swing low at 2,277 from early-May at risk of being broken. If that happens the price structure of the uptrend is violated as it is a higher swing high. There are less significant potential support levels just below the 50-Day line but above the early-May swing low. The 50% retracement of the internal uptrend is at 2,289 and a top trend channel line is a little higher from there.
Read Full Story »»»
DiscoverGold
Gold Continues to See Volatility as We Consolidate
By: Christopher Lewis | May 24, 2024
• The gold market has fallen hard this week, but at this point in time, it is worth knowing that the market will continue to be in an uptrend at this point, and that hasn’t changed.
Gold Markets Weekly Technical Analysis
You can see we’ve had a pretty ugly week. But really when you look at the week in the totality of the entire trend, it’s just consolidation. It’s brutal. It’s violent and it’s scary why you’re going through. But when you look at these longer term charts, you can see clearly the buyers are still in control.
We may be working off some of the excess froth and that’s not necessarily a bad thing either. The $2,400 level above is a significant barrier to overcome and you can see we’ve done it a couple of times momentarily but not have the strength to leave it in the rear view mirror for good. Eventually we will and we will more likely than not go looking to the $2,500 level at that point.
The $2,300 level underneath is a significant support level, but really at this point in time, if we were to break down below there, I think it just offers even more value at even lower levels. In general, I think gold continues to go higher based on a whole plethora of reasons, not the least of which is the United States borrowing a trillion dollars every three months.
We also have central bank buying and of course we have geopolitical concerns. Because of all of these reasons, I just don’t see gold falling for a substantial move anytime soon. With this, and the overall picture of the charts, it looks as if we are going to be bullish going forward, and these drops are now thought of as “value.”
Read Full Story »»»
DiscoverGold
I-80 Gold Corp. a lot of high grade
drilling hits in Nevada!
Yet trading fairly low for its
valuation ✔️
Maple Gold still trading at about 5c.
Hard to say what’s going on, but
they’ve proven up about four
million ounces on their property, and
have a joint venture with Agnico.
a five dollar stock...yikes....good luck
ARIS MINING TO INCREASE OWNERSHIP IN SOTO NORTE PROJECT TO 51% AND
COMMENCES STUDY TO ASSESS NEW DEVELOPMENT PLAN
NEWS PROVIDED BY
Aris Mining Corporation
May 23, 2024, 07:00 ET
SHARE THIS ARTICLE
VANCOUVER, BC, May 23, 2024 /PRNewswire/ - Aris Mining Corporation (Aris Mining or the Company) (TSX: ARIS) (NYSE-A: ARMN)
announces that it has entered into a binding agreement with MDC Industry Holding Company LLC (Mubadala),
a wholly-owned subsidiary of the Abu Dhabi based investment company Mubadala Investment Company PJSC, whereby,
subject to certain customary conditions,
Aris Mining will acquire an additional 31% joint venture interest in the Soto Norte gold-copper project in Colombia
(Soto Norte or PSN) and amend the current Joint Venture Agreement to account for this change in ownership.
Soto Norte is one of the largest undeveloped underground gold projects in South America, set to employ modern and
sustainable mining practices.
https://www.prnewswire.com/news-releases/aris-mining-to-increase-ownership-in-soto-norte-project-to-51-and-commences-study-to-assess-new-development-plan-302153640.html
ARIS MINING REPORTS 2023 RESULTS WITH GUIDANCE ACHIEVED, NET EARNINGS OF $11.4M,
ADJUSTED EARNINGS OF $52.2M ($0.38/SHARE),
ADJUSTED EBITDA OF $159M
March 06, 2024
Download(opens in new window)
VANCOUVER, BC, March 6, 2024 /PRNewswire/ -
Aris Mining Corporation (Aris Mining or the Company) (TSX: ARIS) (NYSE-A: ARMN) announces financial and
operating results for the three and twelve months
ended December 31, 2023 (Q4 2023 and FY 2023, respectively). All amounts are in US dollars unless otherwise indicated.
https://www.aris-mining.com/news/news-details/2024/ARIS-MINING-REPORTS-2023-RESULTS-WITH-GUIDANCE-ACHIEVED-NET-EARNINGS-OF-11.4MADJUSTED-EARNINGS-OF-52.2M-0.38SHARE-ADJUSTED-EBITDA-OF-159M/default.aspx
https://investorshub.advfn.com/boards/read_msg.aspx?message_id=173916527
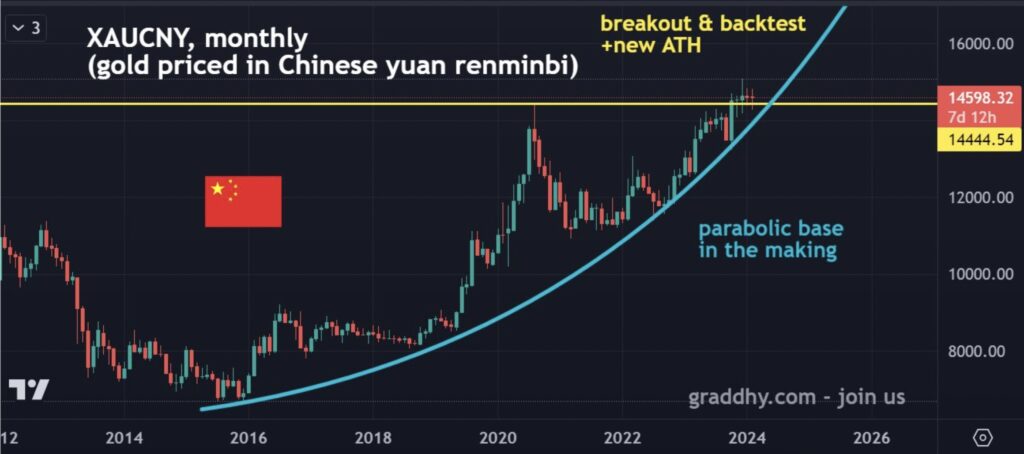
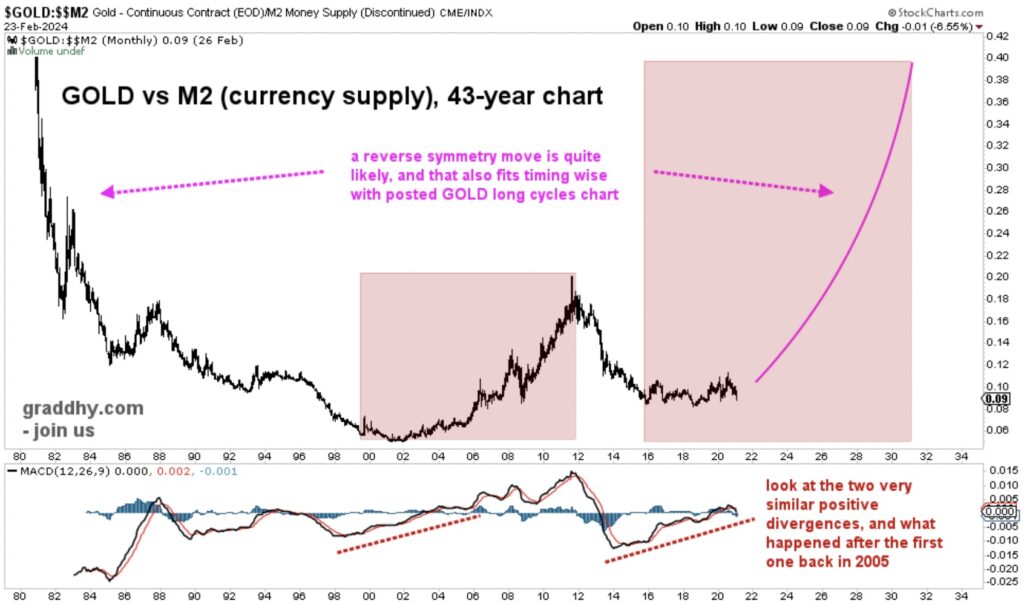
Gold vs M2 Money Supply:
Gold Massively Undervalued vs US Money Supply
$NEWS - Is Gold Setting Up for a Huge, Once in a Generation, Rally?
By Chris Vermeulen
Is there a generational opportunity coming to get into gold?

 )
) 

Gold Breaks Support Levels, Risk of Further Decline
By: Bruce Powers | May 23, 2024
• Gold falls below multiple support levels to 2,332, indicating a potential bearish reversal and increasing risk of a deeper correction.
Gold sold off again on Thursday as it fell below several points of potential support to reach a low of 2,332. Trading continues near the lows of the day and gold may continue lower. Several trendline support areas failed to halt the decline and the 20-Day MA was broken to the downside.
Further, it looks like the daily close may come in below the 20-Day line. Today’s low is also a weekly low from last week. If gold falls below last week’s low and stays there, a bearish weekly reversal will be triggered. How gold does or does not follow through from there will be key.

Watching 50-Day Moving Average
If a more significant retracement than what was seen most recently is beginning the 50-Day MA will be the next key test of support at 2,306. Gold has traded above the 50-Day line since the acceleration in momentum following a symmetrical triangle breakout on February 29. If it is busted to the downside there is a good chance that the recent 2,277 swing low support is broken. That can easily lead to a test of support around 2,195, which is a prior swing high. Further down is the prior swing high at 2,135.
This Week’s High Completes a 23.5% Advance
As of this week’s high of 2,450 gold was up by 465.80 points or 23.5%, when measured from the mid-February low of 1,984. Today’s price action indicates that the risk of a deeper correction since the mid-February 1.94 bottom is increasing. There were three trendlines that cross just above the 20-Day MA that created a potential support zone. That zone failed today as gold dropped through each one. Further, the near-term trending indicator, the 20-Day MA, was attempting continue to represent dynamic support for the uptrend as gold dropped below it recently and then rallied back above it.
Today’s High of 2,384 is Near-term Resistance
On the upside, a minimum rally above today’s high 2,384 would be needed for the first sign of strength. That should be followed by a daily close above that level. Nevertheless, as stated above, the preference next for gold seems to be leaning more to the downside than the upside.
Read Full Story »»»
DiscoverGold
Gold - Popped that Bull 'Flag'. And dropped back for a B/Test (Hopefuly) Watching the 4Hr 150/MA & Fibs to hold. Otherwise it will pressure the Up/Trend Channels Lwr-Parallel...
By: Sahara | May 23, 2024
• $GOLD - Popped that Bull 'Flag'.
And dropped back for a B/Test (Hopefuly) Watching the 4Hr 150/MA & Fibs to hold. Otherwise it will pressure the Up/Trend Channels Lwr-Parallel...

Read Full Story »»»
DiscoverGold
Gold Price Falls Further After Record High, Eyes Key Support Levels
By: Bruce Powers | May 22, 2024
• Gold's decline from its peak of 2,450 brings it near vital support zones, including the 20-Day MA at 2,348.
Gold lost its upward momentum and fell below the lows of the past two days before finding support at a three-day low of 2,375. However, trading remains near the lows of the day at the time of this writing. Sellers took control today following Monday’s new record high of 2,450. That day closed weak, with the price of gold ending in the lower half of the day’s trading range. Nonetheless, it is fast approaching initial potential support levels for the uptrend.

Three Trendlines for Support
There are several trendlines that converge around 2,364 to 2,356. A little lower is the 20-Day MA at 2,348. How gold reacts to the 20-Day line will be telling. It was broken for a little more than two weeks in April before gold rallied back above it on May 9. Support was confirmed over the next few days before it began to rise again leading to a new record high. If today’s weakness leads to a retest of support around the 20-Day line and price is rejected to the upside, the trend structure will be maintained. Or, if support is seen above the 20-Day MA.
Weekly Uptrend Intact Until 2,332
Further, last week’s low is at 2,332 and it provides another lower possible support area. The weekly chart (not shown) has an uptrend in place with this week being the third with a higher weekly low and higher high. Therefore, it is another key price level to watch if the retracement eventually starts to approach that price zone. On the daily chart the weekly low is the most recent swing low where the 20-Day line was tested as support.
Watching Reaction to Support Levels
Until proven otherwise, the uptrend can be anticipated to continue following a pullback. A daily close below the 20-Day MA might change the near-term situation. It would put the current uptrend structure at risk of changing the slope of the ascent. As discussed previously, the current advance from the most recent swing low made a second attempt to breakout from two rising parallel trend channels. The more significant line is the longer one that marks support around 2,364 if was reached today.
Read Full Story »»»
DiscoverGold
Gold Minor Pullback Following New Record High
By: Bruce Powers | May 21, 2024
• Gold retreated slightly on Tuesday, pulling back from the new record high of $2,450 hit in the previous session.
Following an advance to a new trend high of 2,450 yesterday, gold pulled back slightly on Tuesday, falling below Monday’s low of 2,407. Today is the first day in six that the price of gold fell below a prior day’s low. Last week gold ended strong, closing at its highest weekly closing price ever. However, following a rise to a new record high, Monday ended weak, in the lower half of the day’s range and below the prior record high of 2,431. The closing price was 2,426.

Top Channel Line Shows Support
Nevertheless, there was a minor bullish indication given with today’s low of 2,406, as it successfully tested support at a top trend channel line. Last Thursday that line was specifically resistance at the peak of the day, and now showing signs of support. This is bullish price action that is typical for a developing bull trend. Subsequently, we have near-term support at today’s low of 2,406 and resistance at the high of 2,434. A breakthrough either should point to the next likely direction in gold, either bullish continuation or retracement and consolidation.
Rally Above Today’s 2,434 High is Bullish
A decisive rally above today’s high of 2,434 shows strength and may lead to a test of Monday’s 2,450 high and possibly a continuation higher. The next higher target zone was almost reached yesterday. It includes two Fibonacci extension targets and runs from 2,461 to 2,462. The 2,462 has potentially greater significance as it covers a measurement from a longer time frame than the 2,461 level. When measuring the retracement of the 51-month decline that started from the August 2011 trend high at 1,921, a 161.8% extended retracement completes at 2,461. That price level is enhanced by a shorter Fibonacci extended target marking 2,460 as a target.
Outlook Remains Bullish
The overall outlook for gold is clearly bullish given recent price action. Notice that the purple 20-Day MA has started to turn up after a minor downward sloping phase, and it has converged with the internal uptrend line. As of last Friday, gold was back above both top trend channel lines following a drop back below the lines on April 22. An initial bullish breakout from the parallel trend channel triggered on April 8. Notice that both lines identified a similar resistance area on the breakout day as the lines were crossing. A second breakout of the channels looks like it may be the one that can keep advancing.
Read Full Story »»»
DiscoverGold
Gold Continues to See Bullish Pressures
By: Christopher Lewis | May 21, 2024
• The gold market continues to see a lot of upward pressure in general, and I suspect that will continue to be the case as we have a lot of reasons to think the economic outlook won’t change much.
Gold Markets Technical Analysis
Gold initially pulled back just a bit during the trading session on Tuesday, reaching the $2,400 level before rallying again and taking off to the upside. Ultimately, this is a market that I think will eventually try to break out and perhaps take out the top of the shooting star from the previous session. Breaking above that would obviously be a very bullish sign, and could send more FOMO trading into the picture.
The $2,450 level has been a bit of resistance, and I think that gets taken out rather soon. In that environment, it opens up the door to the $2,500 level. An alternate scenario would be that we just go sideways, and if that’s the case, the $2,400 level should continue to be supported. If we were to break down below there, then we would just simply reenter the previous consolidation area, which has a massive amount of support underneath the $2,300 level where the 50 day EMA currently sits.
So, with all of this, I do like the idea of buying dips. And I do think that longer term geopolitics, central bank monetary policy, profligate spending from governments around the world, all will continue to push gold higher. At this point, I don’t really have a longer term target, as the market certainly has a lot to take into account, and of course we have the possibility of further escalation of tension in the Middle East that could really send gold soaring.
Read Full Story »»»
DiscoverGold
Another Gold All-Time High is Nigh
By: Mark Mead Baillie | May 19, 2024
One week ago we herein opened with this query: “Is Gold’s near-term correction completed?” Given the yellow metal’s upside price action since then, we can now answer in the affirmative, (which for you WestPalmBeachers down there means “Yes”).
As for employing the word “Another” in this week’s title, ’twasn’t that long ago in milestone missive No. 700 (15 April 2023 with Gold then 2018) we wrote “Gold: The Next All-Time High is Nigh“, which of course obviously came to pass, indeed on 16 daily occasions since then. Now Gold is merely on go to do it again.
Our Mighty Metal settled at an All-Time Weekly Closing High yesterday (Friday) at 2420, just -29 points shy of the most recent All-Time Intra-Day High of 2449 this past 12 April. Further, given Gold’s “expected daily trading range” (per the website’s Market Ranges page) is 36 points, price is within such range of reasonably reaching above 2449 as soon as Monday, (just in case you’re scoring at home).
True, a week ago — at least technically — we were reserved about Gold’s then imminent direction, price having completed a perfect Golden Ratio retracement, from which at 2386 it swiftly sank in the new week to 2338. To wit as we penned in Wednesday’s Prescient Commentary: “…until the former clears … the Golden Ratio retracement … the recent near-term correction would technically remain in place…” But having then since risen higher still, there’s really not that much pricing congestion now between here (2420) and there (2449).
“And so the question becomes ‘How high is high?’, right mmb?“
That is a critical knowledge point there, Squire. To be sure, Gold has already surpassed our forecast high for this year upon achieving 2375 this past 09 April; (recall such prognosis having been made last 30 December in “Gold – We Conservatively Forecast 2375 for 2024’s High”).
Yet to Squire’s query as to “How high is high?” — at least fundamentally — we can see per the opening Gold Scoreboard that by Dollar debasement (even accounting for the annual increase in the supply of Gold itself), we’ve the yellow metal’s value at 3767, or +56% above today’s “lowly” price at 2420.
But given this ceaseless Investing Age of Stoopid wherein — save for central/sovereign banks — Gold is considered “passé”, determining the inevitable “when” for 3767 (and beyond) is subjective. The art of designing Fibonacci retracements per our prior missive may be one thing: but, the art of future Fibonacci extensions we leave to you “seers” out there.
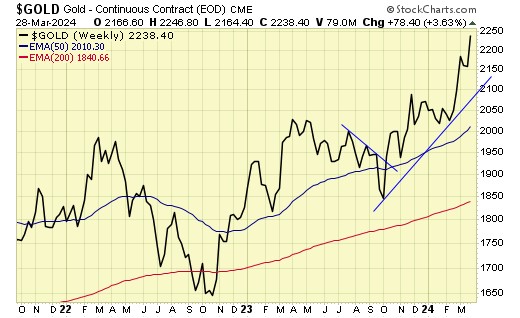
Either way, ’tis a pleasant gaze at the past via this view of Gold’s weekly bars from one year ago-to-date, again the rightmost nub being an All-Time Weekly Closing High. Indeed through these first 20 trading weeks of 2024, this past one ranks fifth-best by both points (+53) and percentage (+2.2%) gains. As for the more skeptical amongst you — and price is arguably “too high” above the rising dashed regression trendline — we’ve again depicted the green-bounded 2247-2171 structural support zone, within which is the current “flip to Short” price of 2236. (But let’s not go there…)

And no, that Gold/Silver ratio at the foot of the above graphic is not a typo: 76.2x champions Silver’s stellar week wherein price rose +3.27 points (+11.5%), the white metal’s best weekly gain by both measures since that ending 07 August 2020. ‘Tis why we oft quip: “Don’t forget Sister Silver!”
Whilst speaking of metals, surely you saw Copper having reached its own All-Time High at $5.128/pound this past Wednesday, which may give further boost toward Gold’s next All-Time High. For be it lore, or substantively more, ’tis said the red metal leads the yellow metal. Here are their respective daily percentage tracks decade-to-date: just one of those things that makes you go “Hmmmm…”

But next we go to something guaranteed to make you go “Ugghh…”: the stagflating StateSide Economic Barometer. Its outright dump just in this past week is the worst for such stint since April a year ago. Moreover: for the nearly 26 calendar years that we’ve maintained the Econ Baro, such five-day fall ranks in the 99th percentile of worst plunges. Here’s the year-over year view:

‘Course, this can make Gold quite happy, for now the Federal Reserve must be forced to cut its Bank’s Funds rate … except that April’s just-reported inflation numbers belie that notion. First at the wholesale level (Producer Price Index) the 12-month summation is spot-on the Fed’s +2.0% target … except that April’s pace annualized was +6.0%. Second at the retail level (Consumer Price Index), it slowed by one percentage pip … except that the 12-month summation is well above target at +3.2% (and +3.7% core), with April alone annualized at +3.6%. And by now you well know the formula:
• Inflation + Shrinkage = Stagflation
“But mmb, is it really fair to say the economy is actually shrinking?“
As opposed to its growth merely slowing, Squire? We shan’t see the Bureau of Economic Analysis’ first read of Q2 Gross Domestic Product until late July. And already per their initial Q1 read, the annualized pace fell from +3.4% to just +1.6%. As well, the Conference Board’s “U.S. Leading Economic Index” (which we regularly quip is in fact “lagging” given the Econ Baro is always well ahead of it) has reported only one month of growth (for February of this year) since March of 2022(!) Is it any wonder the broad tilt of the above Baro is negative? No, ’tisn’t.
However, we sense what “is” is a fresh Gold high soon nigh. Let’s go to the two-panel graphic of Gold’s daily bars from three months ago-to-date on the left and same for Silver on the right. Therein per the baby blue dots of trend consistency, our thought is that present upside price momentum can pull the “Baby Blues” for both precious metals up above their respective +80% axes. Again, “Follow the Blues…”:
Also we’ve the two-panel graphic of the 10-day Market Profiles for Gold (below left) and Silver (below right). Whether marching or looking up toward higher highs, ’tis what our analysis implies:

Let’s wrap with our assessment of Q1 Earnings Season. As just ended “by the calendar”, for the S&P 500 — which also set a record high on Thursday at 5325 — we count 439 constituents having reported. Of those, 64% improved their bottom lines over Q1 of a year ago, (meaning that 36% did not so do). Excluding the four COVID quarters of 2020, the average year-over-year improvement runs ’round 69%: thus this past Earnings Season might be couched as rather sub-par. Yet upon its start back on 08 April, the S&P was 5204 and its “live” price/earnings ratio 46.1x. Today they are respectively 5303 and 39.9x: so some relative progress was made there in getting the p/e down a bit. Yet by any historical yardstick — especially in this positive interest rate environment — the p/e of 39.9x remains treacherously (understatement) high.
Read Full Story »»»
DiscoverGold
Gold CoT: Peek Into Future Through Futures, How Hedge Funds Are Positioned
By: Hedgopia | May 19, 2024
• Following futures positions of non-commercials are as of May 14, 2024.
Gold: Currently net long 204.5k, up 4.9k.

Gold rallied for a second week in a row, up 1.8 percent this week. The mettle has been rallying since May 3rd when it ticked $2,285 intraday. As a matter of fact, this week represents a new closing high of $2,417 – just ahead of $2,414 recorded four weeks prior. Back then, gold had just printed a new intraday high of $2,449, which occurred on April 12th, but the session reversed hard to close at $2,361.
Kudos to gold bugs for having rallied the metal back to those highs. The action after that high lasting five weeks now qualifies for sideways congestion, giving the bulls another opportunity to break out.
Read Full Story »»»
DiscoverGold
NY Gold Futures »» Weekly Summary Analysis
By: Marty Armstrong | May 18, 2024
NY Gold Futures closed today at 24174 and is trading up about 16% for the year from last year's settlement of 20718. Caution is required for this market is starting to suggest it may now decline on the MONTHLY level. Up to this moment in time, this market has been rising for 6 months going into May suggesting that this has been a bull market trend on the monthly time level which has been confirmed by electing all of our model's long-term Bullish Reversals from the key low.
ECONOMIC CONFIDENCE MODEL CORRELATION
Here in NY Gold Futures, we do find that this particular market has correlated with our Economic Confidence Model in the past. The Last turning point on the ECM cycle low to line up with this market was 2022 and 2015. The Last turning point on the ECM cycle high to line up with this market was 2020 and 2011 and 1996.
MARKET OVERVIEW
NEAR-TERM OUTLOOK
The NY Gold Futures has continued to make new historical highs over the course of the rally from 2015 moving into 2024. However, this last portion of the rally has taken place over 9 years from the last important low formed during 2015. Noticeably, we have elected four Bullish Reversals to date.
This market remains in a positive position on the weekly to yearly levels of our indicating models. Pay attention to the Monthly level for any serious change in long-term trend ahead.
From a perspective using the indicating ranges on the Daily level in the NY Gold Futures, this market remains in a bullish position at this time with the underlying support beginning at 23956.
On the weekly level, the last important high was established the week of April 8th at 24488, which was up 8 weeks from the low made back during the week of February 12th. We have been generally trading up for the past 2 weeks from the low of the week of April 29th, which has been a move of 6.222%. When we look deeply into the underlying tone of this immediate market, we see it is currently still in a semi neutral posture despite declining from the previous high at 24488 made 5 weeks ago. Still, this market is within our trading envelope which spans between 21048 and 24294. The broader perspective, this current rally into the week of April 8th has exceeded the previous high of 20832 made back during the week of January 29th. This immediate decline has thus far held the previous low formed at 19964 made the week of February 12th. Only a break of that low would signal a technical reversal of fortune and of course we must watch the Bearish Reversals.
Right now, the market is above momentum on our weekly models hinting this is still bullish for now. Looking at this from a wider perspective, this market has been trading up for the past 13 weeks which from a timing perspective warrants concern.
INTERMEDIATE-TERM OUTLOOK
YEARLY MOMENTUM MODEL INDICATOR
Our Momentum Models are declining at this time with the previous high made 2020 while the last low formed on 2023. However, this market has rallied in price with the last cyclical high formed on 2023 and thus we have a divergence warning that this market is starting to run out of strength on the upside.
Interestingly, the NY Gold Futures has been in a bullish phase for the past 17 months since the low established back in November 2022.
Critical support still underlies this market at 20030 and a break of that level on a monthly closing basis would warn that a sustainable decline ahead becomes possible. Immediately, the market is trading within last month's trading range in a neutral position.
DiscoverGold
Jack Chan: Gold Price Exclusive Update
By: Jack Chan | May 18, 2024

Our proprietary cycle indicator is now DOWN.
To public readers of our updates, our cycle indicator is one of the most effective timing tool for traders and investors. It is not perfect, because periodically the market can be more volatile and can result in short term whipsaws. But overall, the cycle indicator provides us with a clear direction how we should be speculating.
Investors
Accumulate positions during an up cycle and hold for the long term.
Traders
Enter the market at cycle bottoms and exit at cycle tops for short term profits.

GLD is on short term buy signal.

GDX is on short term buy signal.

XGD.to is on short term buy signal.

GDXJ is on short term buy signal.
Analysis

Current data favors overall lower gold prices.

Our ratio is on buy signal.

Trend is UP for USD.

Trend is UP for gold stocks.

Trend is UP for gold.

A clear five waves pattern is in progress, and perhaps ending soon.

A diamond bottom is a bullish chart pattern.
Summary
Gold sector cycle is now down.
Trend is up for gold and gold stocks..
$$$ We were stopped out with a small profit.
Read Full Story »»»
DiscoverGold
Gold Is Doing Great!
By: Carl Swenlin | May 17, 2024
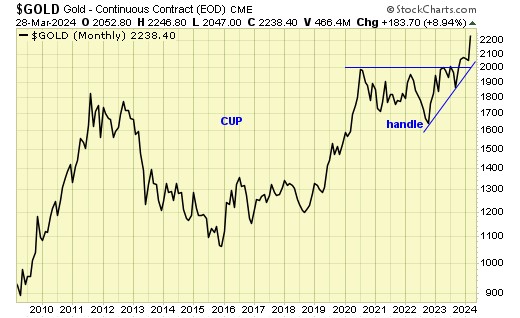
While we don't typically begin with a monthly chart, it seems like a good place to start, as most of the good news is present there.
Beginning on the left side, we can see how gold made a parabolic advance into an all-time high in 2011. Parabolic advances beg for correction, and boy did gold correct. It declined almost -50% into a low in 2015, then advanced for over three years into a new all-time high in 2020. During that time, a bullish cup formation emerged. After that, it consolidated for over three years (the handle), ultimately breaking out of a 12-year consolidation.
I think it is an important point that gold took over 12 years to digest the huge advance into the 2011 top. In my opinion, it puts a solid floor under the most recent advance.

Currently, we can see that gold has gone parabolic again, and it is hard to know when it will top. The preferable resolution to this vertical move would be a sideways consolidation, but we'll just have to wait and see. In my opinion, we shouldn't see any kind of parabolic crash.
Another bullish sign is that sentiment is still bearish. We assess sentiment by seeing if the closed-end Sprott Physical Gold Fund (PHYS) is selling at a discount or a premium. As you can see, it has been selling mostly at a discount for 11 years, clearly showing that the public is still not yet excited about owning gold. We think this is because cryptocurrencies are attracting a lot of the money that might otherwise be moving into gold. In any case, bearish sentiment is bullish for gold.
Looking at the daily candlestick chart below, we can see that the Gold ETF (GLD) closed at an all-time high today, just above a solid level of support. To clarify, GLD is a vehicle that can be used to trade/invest in gold, while the symbol $GOLD is a continuous contract dataset used to track the price of gold, but it cannot be owned.

Conclusion: Gold spent a long time, over 12 years, consolidating huge gains in the early part of the century. It recently broke out decisively from that trading range, and it appears to be at the start of another strong, long-term rally.
Read Full Story »»»
DiscoverGold
Gold, is really a market linked to confidence in government rather than the nonsense of inflation, has traditionally rallied during times of war.
When people loose confidence in their government Gold goes up. It is expected to reach $4,500 by 2027.
DiscoverGold
Yes why start now LOL
I like ARMN, but i give no buy or sell advice to anyone.
R U trying to get in or thinking of getting out of something?
Yes I know all that ...but why the sudden spike
Reality is catching up. gold is the most undervalued anything in possibly the history of this country. but this spike is mostly due to copper.
So what's going on now with this spike
What is causing this spike?
Gold Surges to New Highs, Targets 2,462 Next
By: Bruce Powers | May 17, 2024
• Gold rallies to new high of 2,419, targeting 2,462 as strong bullish momentum pushes towards record weekly closing price.
Gold continued its rally today with a new swing high of 2,419. Momentum was strong indicated by the wide range day and full green candle. A top trend channel line and the 78.6% Fibonacci retracement were exceeded during today’s advance. Gold is set to close strong, near the top of this week’s trading range. Nevertheless, baring an extreme move before the close, it should end at its highest ever weekly closing price. That bodes well for future prices and alludes to a continuation higher and a possible breakout to new record highs.

Gold Targets 2,462 if 2,431 is Exceeded
The recent record high in gold was 2,431. If exceeded to the upside gold looks to be heading towards 2,462. That price area is the confluence of two Fibonacci levels. One is an extended retracement of the September 2011 decline, and the other is the 127.2% extended retracement from the recent pullback off the 2,431-record high. Since they line up and represent both a long-term price projection and a short-term level, it should be watched closely for signs of resistance. Regardless, demand could remain strong and push prices right through that zone. Whatever the reaction around that price level, it is a potential pivot to be watched.
Further Up is 2,480
That price target is followed by a slightly higher target at 2,480, which is the completion of a measured move. Gold rallied by 870 points from the August 2018 swing low of 1,160. The current advance, when measured from September 2022 trend swing low at 1,615, will be up by 870 when the price of gold is at 2,485. That is a target. After that there are a variety of possible interim targets if the bull trend in gold continues to advance, and it looks like it will.
Strong Follow Through from March Breakout
As discussed previously, gold successfully broke out of a multi-year basing period in March of this year. The subsequent follow-through has been bullish as momentum has stayed strong and retracements or consolidation periods have been minor. For example, the recent retracement found support and reversed higher with less than a 38.2% Fibonacci retracement being completed. This reflects demand from buyers. It has stayed strong.
Read Full Story »»»
DiscoverGold
Gold Continues to Look Strong
By: Christopher Lewis | May 17, 2024
• The gold market rallied again in the early hours of Friday, as it looks like we are doing everything we can to breakout above the crucial level above.
Gold Markets Technical Analysis
You can see that the gold market rallied early during the trading session on Friday, as it looks like we are going to threaten the $2,400 level again. This is an area that has had significant resistance previously. So, if we can break above there, that would obviously be a huge victory at that point in time.
Gold, almost certainly, will try to look at the $2,500 level. On the other hand, if we see the market pullback from here, we could see plenty of support areas, especially all the way down to the $2,300 level. The 50 day EMA comes into that picture, and I think that solidifies at $2,300 level as support in general. At this point, the question isn’t so much as to whether or not gold is strong or whether or not it’s in a bullish market.
It’s just a question now as to when will we breakout to the upside with the geopolitical concerns around the world, it does make a certain amount of sense that gold and tends to rise. And then of course, you have the interest rate situation which is all over the place. Yes, rates are high, but at the same time, Wall Street continues to have this fantasy that the Federal Reserve is going to come and cut rates aggressively.
Perhaps more importantly, both of those central banks are out there buying masses of gold, so that obviously puts a little bit of a bid under the market as well. In general, this market continues to see a lot of noise, but I do think that it’s positive overall.
Read Full Story »»»
DiscoverGold
Gold Price Forecast: Will the Rally Continue?
By: Bruce Powers | May 16, 2024
• Gold surged to a new high but encountered resistance, pausing its advance. Key trendlines suggest further upside potential, with the rally likely leading to new record highs.
Gold rallied to a new trend high of 2,397 on Thursday before encountering resistance and pulling back intraday. At the time of this writing gold is on track to complete the day with a narrow range, reflecting a pause in the advance. Resistance was seen at the 78.6% Fibonacci retracement and further confirmed by a top rising trend channel line that marked the same price. Support for the day was at 2,371, right at the 61.8% Fibonacci retracement zone (prior resistance becomes support).
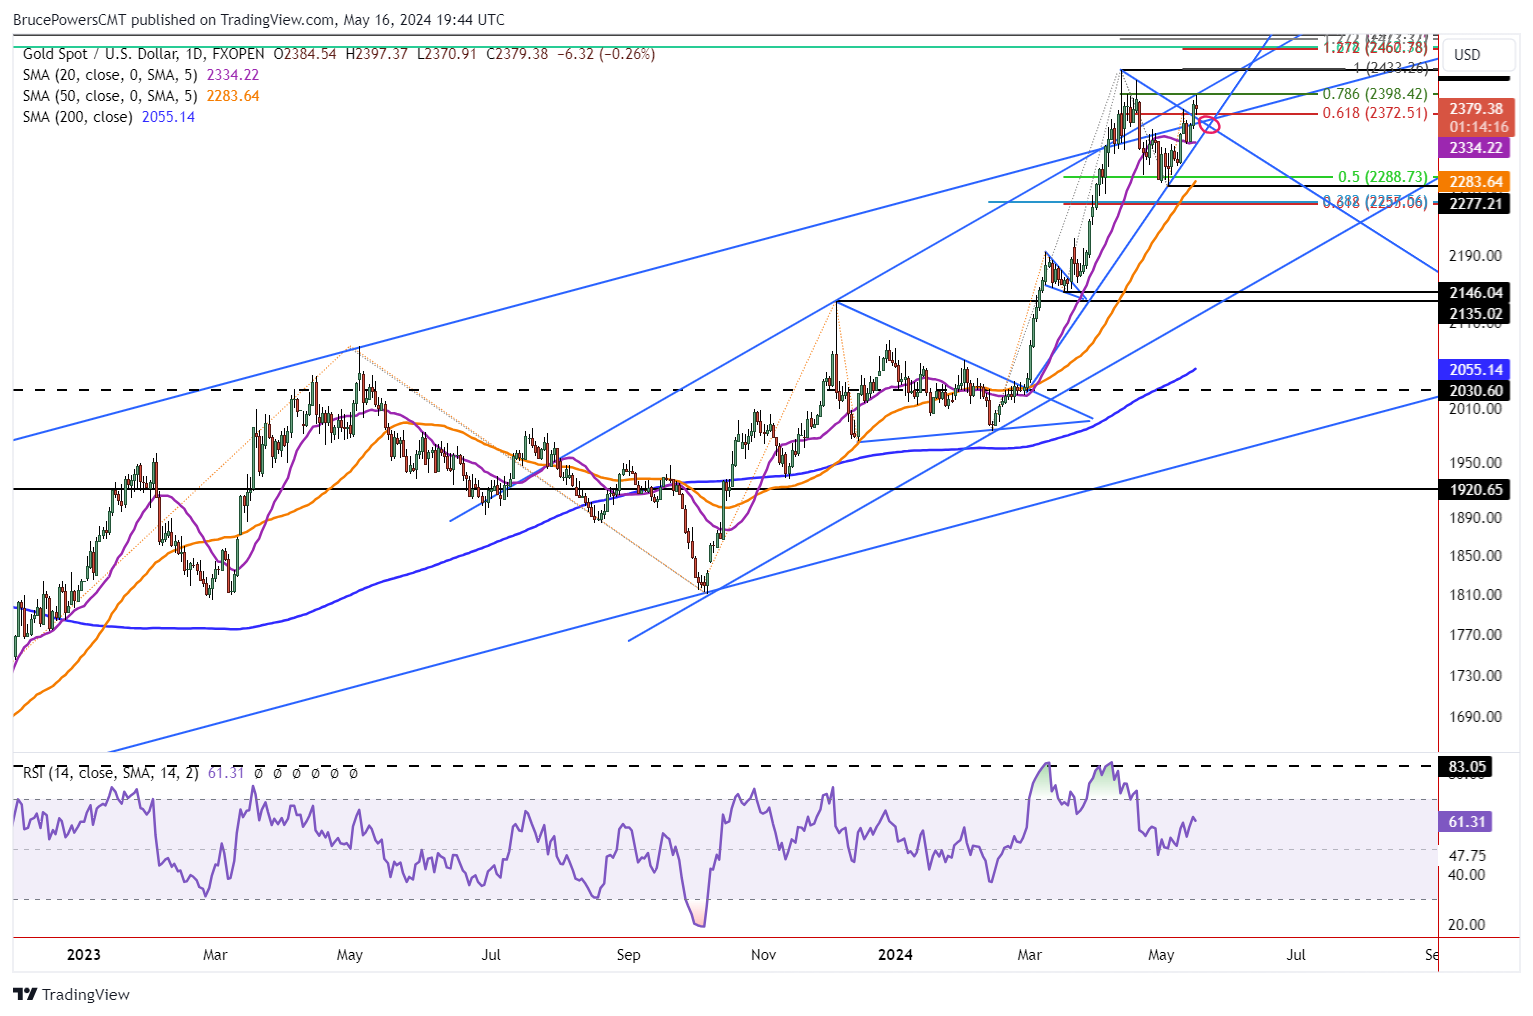
Trendlines Indicate Higher Prices for Gold
Of note is the relationship of the price of gold with two trendlines. The more significant line is the rising line connecting the recent May 3 swing low, as it covers a longer time frame than the second line. If gold stays above that line, it can be anticipated to continue to strengthen. Also, gold rose above the downtrend line starting from the April 12 record high of 2,431 yesterday, and it exceeded the prior trend high at 2,378 as well. Wednesday’s close was above both the line and prior trend high thereby confirming strength.
Second Breakout of Trend Channel in Process
Moreover, yesterday’s advance ended clearly above the longer top rising channel line, triggering a second bullish breakout from the parallel trend channel. Will the second breakout lead to upside follow through? Certainly, it is starting to look that way. In addition to the trendlines noted above, the purple 20-Day MA is critical support if a retracement begins. It happens to match the price represented by the rising trendline today at 2,334.
Breakout Above 2,397 Triggers Bullish Continuation
A decisive rally above today’s high of 2,397 provides a bullish signal. If this occurs the record high of 2,431 is the next target. Gold is likely to then continue to advance into new record high territory. The first new high target is around 2,461/2,462, marked by the confluence of two Fibonacci levels. It includes a 161.8% extension at of the retracement from the decline that began off the August 2011 trend high of 1,921. Therefore, it is potentially a significant price level as it covers a long period of time.
Read Full Story »»»
DiscoverGold
Gold Continues to See $2400 as Trouble
By: Christopher Lewis | May 16, 2024
• The gold market continues to see the $2400 level as a major barrier to continuing the gains in this market. However, it is most certainly a market that can’t be shorted, and at this point, should be a “buy on the dips” scenario.
Gold Markets Technical Analysis
The gold market rallied a bit during the trading session on Thursday to hit the $2,400 level. The $2,400 level is an area that previously has seen a pretty significant barrier. The $2,400 level being broken to the upside opens up the possibility of the market going to the $2,500 level, perhaps even higher than that.
At this point though, it would not surprise me at all to see a little bit of a pullback, mainly due to the fact that we have gotten a little stretched. A pullback could look like the gold market dropping all the way down to the $2,300 level, which is the bottom of the most recent pullback. We also have the 50-day EMA hanging around in the same area, and therefore I think it is more or less a hard floor at the moment.
Short-term pullbacks will more likely than not be a scenario where we can get a little bit of a buy on the dip mentality of most traders around the world. Keep in mind that the gold market is being stepped into by central banks as they’ve been accumulating for some time. The gold market is also highly sensitive to the interest rate situation around the world. So, pay attention to that. And at this point in time, it just looks like we are continuing the overall upward pressure, but I don’t necessarily want to chase right into this resistance.
If we get a daily close that is significantly above $2,400, then fine, I will jump in, but I think you probably get a little bit of a pullback here to offer some value, especially as may wish to take their profit later on on Thursday and into early Friday, we’ll just have to wait and see. Either way, selling gold isn’t even a thought.
Read Full Story »»»
DiscoverGold
Gold Price Breaks Resistance, Eyes Further Gains
By: Bruce Powers | May 15, 2024
• Gold price hits new high at 2,390, showing signs of strength and potential for further gains.
Buyers stepped up on Wednesday to help push the price of gold to a new trend high of 2,390. A bullish breakout triggered on the weekly chart on a move above last week’s high of 2,378. At the time of this writing the high of the day is 2,390. Today’s advance took gold back above a top channel line, which has been tested as resistance several times in the past few weeks and it provides another sign of strength for the precious metals. It doesn’t hurt that silver has also shown signs of continuing higher (not shown) as it rapidly approaches the high for the year.

Next Higher Target Zone is 2,398
Next, gold faces potential resistance around the 78.6% Fibonacci retracement at 2,398. That price area also marks a top channel line. An advance through 2,398 will put gold back above both rising parallel trend channels following a failed breakout in early-April. A recovery following a failed breakout initially sets the stage for a continuation of the trend into higher prices. The first upside target is the trend high of 2,431. If a bull trend continuation signal is generated on a decisive rally above 2,431, the next higher target is at 2,431. Two Fibonacci levels mark that spot.
Second Channel Breakout Attempt
If gold advances above the top channel line and stays there, and then further strengthens, it will confirm strength. The advance to date has seen the price of natural gas appreciate at a rapid pace. A steep angle of ascent represents strength but also increases the risk for a sharp retracement. A daily close or more above the channel will go a long way to satisfying the bulls.
Long-Term Outlook is Bullish
As discussed more than once before, gold is in the process of following through on a bullish breakout above a multi-year base building period. Today’s advance triggered a breakout of the downtrend line and last week’s high. It shows buyers getting aggressively interested in gold as global uncertainty in government broadens. Moreover, a pullback remains a possibility if signs of weakness start to show up. The first sign of weakness that could lead to a deeper retracement would be on a drop below today’s low of 2,352.
Read Full Story »»»
DiscoverGold
Gold Testing Support, Eyes on Upside Breakout
By: Bruce Powers | May 14, 2024
• Gold's position above 20-Day MA is critical, with a potential breakout above 2,364 indicating further strength towards the trend high of 2,378.
Gold has traded above the 20-Day MA for the past few days and again successfully tested the line as support today. This puts it in a critical short-term position. A drop below yesterday’s low of 2,332 is a break below daily support and the 20-Day MA, which is at 2,333 today.
Alternatively, a decisive advance above today’s high of 2,359, at the time of this writing, is a sign of strength, as it would signal an inside day breakout. However, a rise above Monday’s high of 2,364 is a more significant signal and has a better chance of seeing gold continue to strengthen from there. But the trend high of 2,378 needs to be exceeded to the upside before a trend continuation signal is generated.

Two Lines Mark Support
In addition to trend support represented by the 20-Day line, the uptrend line touching the lows of the most recent price action should also be given some attention. Notice that the 20-Day line and nearby uptrend line will converge within a day or two.
It could be hinting at further consolidation for a few more days. This week is an inside week so far. It is possible the week ends with the price of gold staying within the trading range of last week. If so, a sharper and sustained advance to challenge the 2,378 high and possibly exceed it, may have to wait until next week.
Drop Below 2,324 Eyes Deeper Pullback
On the downside, a bear flag may be in the process of forming with the internal uptrend line as a proxy for the lower boundary of the flag. It is not clearly formed yet but deserves to be watched to see if it progresses and becomes more clearly defined.
A drop below the trend line could see gold drop to test the 50-Day MA at 2,274. That price level is very close to the most recent swing low of 2,277. Given gold’s strong rally from the mid-February swing low, a test of support around the 50-Day line would not change the overall bullish outlook for gold. In fact, it would better prepare the market for a continuation into new record highs.
Read Full Story »»»
DiscoverGold
China’s Central Bank Topped Up Its Gold Reserves For An 18th Straight Month
By: Frank Holmes | May 14, 2024
Strengths
• The best performing precious metal for the week was silver, up 6.56%, which can be an indicator of speculative interest being revived in the precious metal trade. Gold consolidated early in the week between $2,340 to nearly $2,310, but the weaker than expected initial jobless claims came in higher than expectations, which launched gold higher, and the momentum continued Friday with the weaker than expected preliminary survey of consumer sentiment by the University of Michigan.
• K92 Mining reported drilling results from the Kainantu gold mine in Papua New Guinea that extended multiple high-grade zones and included a new dilatant zone discovery. At the Kora South deposit, a new dilatant zone was discovered with intercepts of 78.50 meters at 27.03 grams per ton gold equivalent and 34 meters at 8.14 grams per ton gold equivalent.

• Kinross reported operating results that surpassed RBC and consensus expectations with 4% higher production and 5% lower costs. This supported higher adjusted earnings per share (EPS) ($0.10 versus RBC $0.09). KGC reiterated annual guidance—in their view 1Q positions the company favorably to achieve annual targets.
Weaknesses
• The worst performing precious metal for the week was gold, but still up 2.66%. Gold Fields reported its Q1/24 operational results. While BMO had incorporated the softer quarter, costs came in significantly higher than expected. However, with backend-weighted production in H2/24, the company has kept overall guidance unchanged.
• Following a strong start to 2024, SA PGM exports for the month of March declined 13% year-over-year (YoY) and 12% month-over-month (MoM) to 504,000 ounces to the lowest levels since 2020. However, SA PGM exports year-to-date are still up 12% YoY and UBS continues to see increased exports for these metals to the West.
• Gatos' Q1 EPS of $0.04 compared with BMO’s $0.06 estimate, which included revenue of $72 million versus their $79 million. Notably, the JV continued to make strong capital distributions increasing Gatos' cash balance to $85.4M. All-in sustaining costs (AISC) of $14.36/ounce silver was at the low end of guidance and below their estimate.
Opportunities
• Data dating back to 2010 shows that in times of buoyant gold prices, exploration spend has typically followed. However, since 2019, exploration spend and the gold price have decoupled, Canaccord thinks driven by M&A. Over the last 10 years, periods of sustained exploration spend have typically been followed by several world-class discoveries.
• China’s central bank topped up its gold reserves for an 18th straight month in April, although the pace of buying slowed in the face of record prices. The People’s Bank of China has long been one of the market’s largest buyers, steadily growing its bullion holdings since 2022. However, the precious metal’s record-breaking rally since mid-February — with successive all-time-highs reached last month — seems to have dented demand, according to Bloomberg.
• A booming solar-power industry is driving a surge in the demand for silver, which is needed in large quantities to make photovoltaic panels. Silver is integral to the production of solar photovoltaic -- or solar PV -- panels because of its high electrical conductivity, thermal efficiency and optical reflectivity, as reported by the Wall Street Journal.
Threats
• JPMorgan summarized rainfall data for the April month for a selection of Australian projects, utilizing Bureau of Meteorology data. Rainfall 25%+ above the monthly mean was recorded at 11 sites, with East Coast assets in New South Wales and Queensland bearing the brunt coming out of the wet season.
• Gold’s 12% rally this year has put major bond and stock markets in the shade, but it does look to be losing momentum. That happens to coincide with a slowdown in the Chinese central bank’s purchases of the precious metal, according to Bloomberg.
• The Pan American Silver Escobal mine in Guatemala remains on care and maintenance as the ILO 169 consultations continue with the Xinka indigenous representatives and as a new government gains familiarity with the project. Management notes that the ILO 169 consultation process has experienced delays since the new government in Guatemala took office in January 2024, according to Canaccord.
Read Full Story »»»
DiscoverGold
NY Gold Futures »» Weekly Summary Analysis
By: Marty Armstrong | May 11, 2024
NY Gold Futures closed today at 23750 and is trading up about 14% for the year from last year's settlement of 20718. Caution is required for this market is starting to suggest it may now decline on the MONTHLY level. At the moment, this market has been rising for 6 months going into May suggesting that this has been a bull market trend on the monthly time level which has been confirmed by electing all of our model's long-term Bullish Reversals from the key low.
ECONOMIC CONFIDENCE MODEL CORRELATION
Here in NY Gold Futures, we do find that this particular market has correlated with our Economic Confidence Model in the past. The Last turning point on the ECM cycle low to line up with this market was 2022 and 2015. The Last turning point on the ECM cycle high to line up with this market was 2020 and 2011 and 1996.
MARKET OVERVIEW
NEAR-TERM OUTLOOK
The NY Gold Futures has continued to make new historical highs over the course of the rally from 2015 moving into 2024. However, this last portion of the rally has taken place over 9 years from the last important low formed during 2015. Noticeably, we have elected four Bullish Reversals to date.
This market remains in a positive position on the weekly to yearly levels of our indicating models. Pay attention to the Monthly level for any serious change in long-term trend ahead.
Looking at the indicating ranges on the Daily level in the NY Gold Futures, this market remains in a bullish position at this time with the underlying support beginning at 23479.
On the weekly level, the last important high was established the week of April 8th at 24488, which was up 8 weeks from the low made back during the week of February 12th. We have been generally trading up for the past week from the low of the week of April 29th, which has been a move of 4.380%. When we look deeply into the underlying tone of this immediate market, we see it is currently still in a semi neutral posture despite declining from the previous high at 24488 made 4 weeks ago. Still, this market is within our trading envelope which spans between 20767 and 23969. Immediately, this decline from the last high established the week of April 8th has been important Before, this recent rally exceeded the previous high of 20832 made back during the week of January 29th. Nonetheless, that high was actually lower than the previous high made the week of December 25th suggesting this market has really been running out of sustainable buying for right now. This immediate decline has thus far held the previous low formed at 19964 made the week of February 12th. Only a break of that low would signal a technical reversal of fortune and of course we must watch the Bearish Reversals. Right now, the market is neutral on our weekly Momentum Models warning we have overhead resistance forming and support in the general vacinity of 23402. Additional support is to be found at 22491. Looking at this from a wider perspective, this market has been trading up for the past 12 weeks overall.
INTERMEDIATE-TERM OUTLOOK
YEARLY MOMENTUM MODEL INDICATOR
Our Momentum Models are declining at this time with the previous high made 2020 while the last low formed on 2023. However, this market has rallied in price with the last cyclical high formed on 2023 and thus we have a divergence warning that this market is starting to run out of strength on the upside.
Interestingly, the NY Gold Futures has been in a bullish phase for the past 17 months since the low established back in November 2022.
Critical support still underlies this market at 20030 and a break of that level on a monthly closing basis would warn that a sustainable decline ahead becomes possible. Immediately, the market is trading within last month's trading range in a neutral position.
DiscoverGold
Gold Price Exclusive Update
By: Jack Chan | May 11, 2024

Our proprietary cycle indicator is now DOWN.
To public readers of our updates, our cycle indicator is one of the most effective timing tool for traders and investors. It is not perfect, because periodically the market can be more volatile and can result in short term whipsaws. But overall, the cycle indicator provides us with a clear direction how we should be speculating.
Investors
Accumulate positions during an up cycle and hold for the long term.
Traders
Enter the market at cycle bottoms and exit at cycle tops for short term profits.

GLD is on short term sell signal.

GDX is on short term sell signal.

XGD.to is on short term sell signal.

GDXJ is on short term sell signal.
Analysis

Current data favors overall lower gold prices.

Our ratio is on buy signal.

Trend is UP for USD.

Trend is UP for gold stocks.
Trend is UP for gold.

GDX is bound by support and resistance in a tight range.

A diamond bottom is a bullish chart pattern.

An ending diagonal has a bearish bias.
Summary
Gold sector cycle is now down.
Trend is up for gold and gold stocks..
$$$ We were stopped out with a small profit.
Read Full Story »»»
DiscoverGold
Gold CoT: Peek Into Future Through Futures, How Hedge Funds Are Positioned
By: Hedgopia | May 11, 2024
• Following futures positions of non-commercials are as of May 7, 2024.
Gold: Currently net long 199.6k, down 4.6k.

Last Friday, gold bugs showed up at $2,285 – well before testing horizontal support at $2,240s. They built on that this week, as the metal rallied 2.9 percent to $2,375/ounce. This comes after two weeks of decline.
On April 12th, gold printed a new intraday high of $2,449 but only to then reverse hard to close the session at $2,361. Friday’s intraday high of $2,385, in fact, kissed a falling trendline from that high. This resistance likely gives way in the sessions ahead.
Read Full Story »»»
DiscoverGold
Gold's $9K will take us all by surprise! How Many Ounces Of Gold & Silver Are You HOLDING? -
Rule
The Market View
Gold Price Breakout Above Key Levels Signals Strength
By: Bruce Powers | May 10, 2024
• After triggering a bullish weekly reversal, gold's advance signals strength, with potential for further upside towards recent highs.
Gold triggered a bullish weekly reversal on Friday as it advanced above last week’s high of 2,347. The high of the day was 2,378 before it pulled back intraday. Gold is on track to end the week above last week’s high and above the most recent swing high at 2,352, further confirming strength. Yesterday, gold gave an initial sign of strength with a daily close above the 20-Day MA.
Today’s advance completed a 61.8% Fibonacci retracement of the recent decline around 2,373. Also, notice that today’s rally got above a top channel trendline and is set to close above it. That line represented resistance recently during the pullback.

Bullish Reversal on Weekly Chart
This could be the beginning of a bullish reversal that tests recent highs and potentially begins an advance to new record highs. The recent retracement stalled at a low of 2,277, which is near the 50% retracement of an internal upswing. However, when measuring a larger portion of the uptrend that starts from the February swing low, support came in above the 38.2% Fibonacci retracement.
A retracement to the 38.2% price level would also be relatively minor and reflect underlying strength. However, buyers were more aggressive and turned the price of gold back up at a higher price area. And momentum has been strong the past two days as the ascent began.
Price Levels to Watch on the Way Up
Price levels to watch on the way up include the three-week high of 2,389 and the 78.6% Fibonacci retracement at 2,398. There is then an interim swing high at 2,418 and the trend high at 2,431. An initial breakout above the top trend channel line triggered on April 8. But it failed to continue and led to the recent retracement. It is interesting to note that the market recognized that pivot as the two channel lines crossed at that point (circled).
Subsequently, the top lines acted as support for the next nine days as gold attempted to go higher. Watch for similar or more bullish price action once gold gets above both lines. It is now above one line. But that line is more significant as it measures the larger rising parallel trend channel.
Read Full Story »»»
DiscoverGold
Gold $GLD - Update...
By: Sahara | May 10, 2024
• $GOLD $GLD - Update.
Held that Channel (Shaded) and now pressuring the 'Flag' B/Out Line. If successful will bring $2500-$2600 Level into focus...

Read Full Story »»»
DiscoverGold
Maple Gold Mines:
This penny gold stock may have five million ounces in the ground by year end (2024) when fully funded drilling is completed.
✔️📈👍
Gold Price Forecast: What’s Next for the Precious Metal?
By: Bruce Powers | May 9, 2024
• A breakout above key resistance levels, including 2,347 and this week's high, could signal a sustained advance for gold, following its multi-year basing pattern breakout in March.
Gold showed strength today, rising to test resistance around the 20-Day MA with the day’s high of 2,342, at the time of this writing. That is an eight-day high for which it traded within a relatively tight range. Today’s high generates a new high for the consolidation range. Although it is a sign of short-term strength, it doesn’t change the near-term outlook. A daily close above the 20-Day MA at 2,335 would begin to do that. Also, after today’s session, a daily close above today’s high would also be a sign of strength that may lead to increased demand.
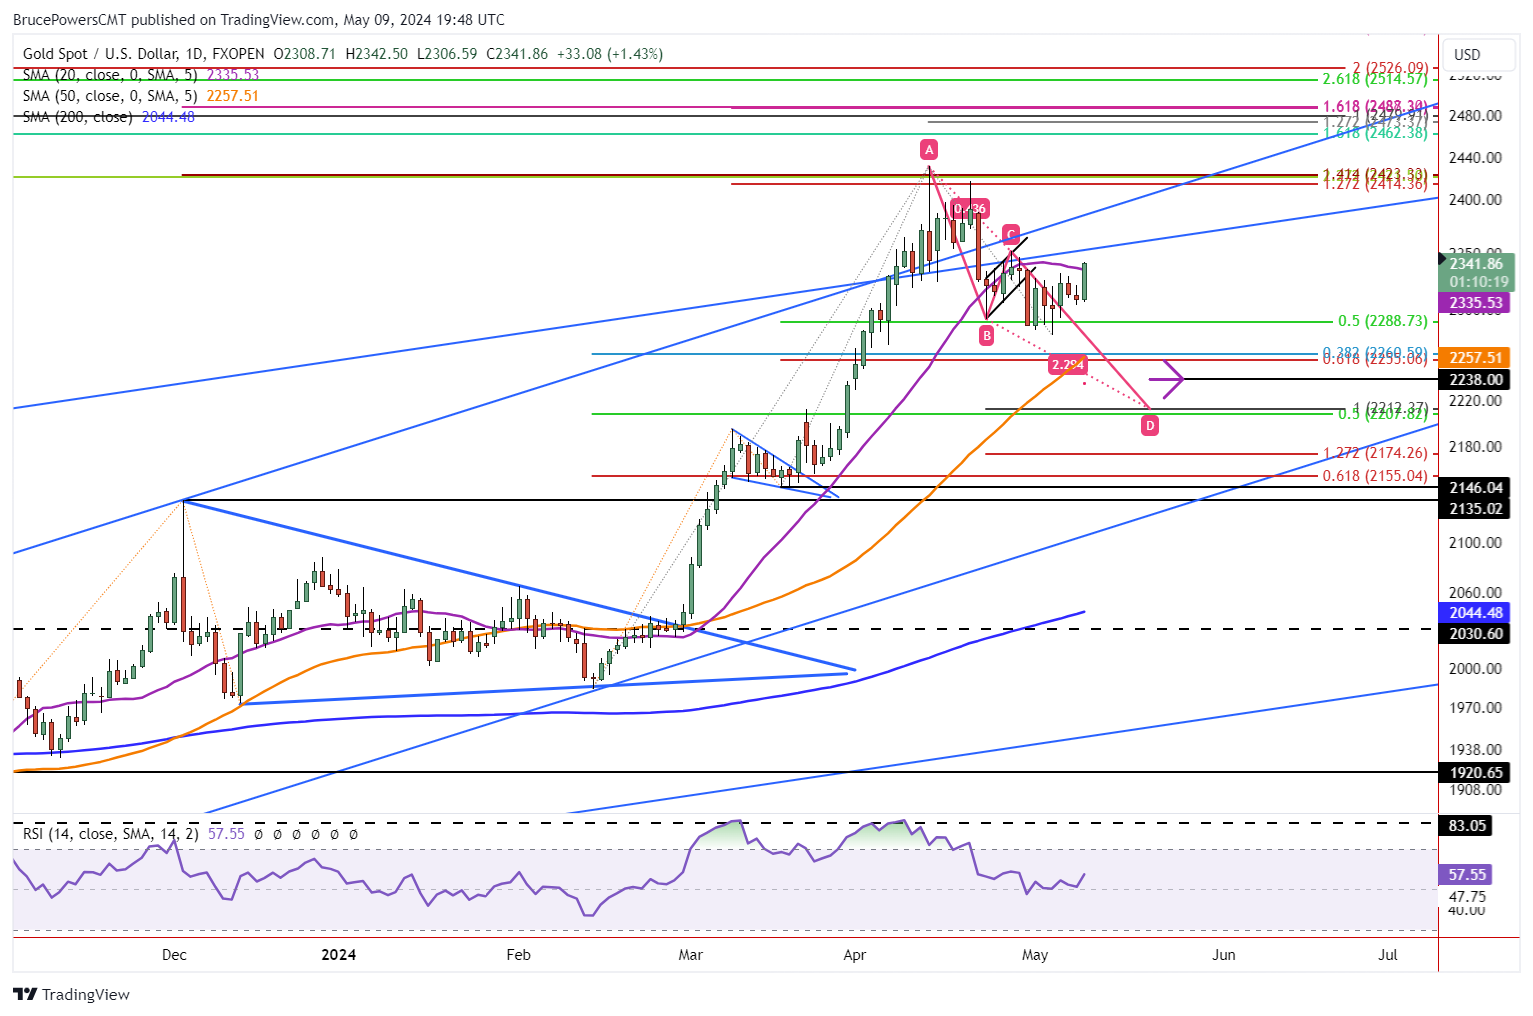
Testing Resistance
So, what happens next will be of interest. If gold moves above today’s high (also 20-Day MA), then higher prices may follow. But if today’s resistance holds and is followed by a pullback, a continuation of the retracement remains in play. Last week’s high of 2,347 is also an important near-term price level as a rally above it will trigger a bullish reversal in the weekly time frame. Currently, gold is set to complete this week as an inside week.
Therefore, starting next week a breakout above this week’s high would provide a bullish signal, keeping in mind that such a move would also exceed resistance around the 20-Day line. Buyers have regained control of silver following today’s rally above its 20-Day MA. This might be a warning that gold could be about to do the same. Price action will provide a guide.
Watching for Signs of Strength
Potential lower targets have been discussed in recent articles, so today let’s consider the upside potential. A decisive breakout above last week’s high of 2,347 will provide a bullish signal that could lead to higher prices, or above this week’s high once the week completes. Additional strength will be indicated on a rally above the most recent swing high on the daily chart at 2,352 (C). Once there is a daily close above the slightly higher level, the chance for a sustained advance improves.
Minor Retracement Shows Underlying Strength
When considering the larger picture. Gold broke out of a multi-year basing pattern in March and kept going until reaching the current record high of 2,431. If last week’s low of 2,277 is the completion of a retracement, it would reflect strong underlying demand for gold as buyers stepped up before a 38.2% Fibonacci retracement completed.
Read Full Story »»»
DiscoverGold
Gold Bearish Bias Persists as Consolidation Persists
By: Bruce Powers | May 8, 2024
• Gold's price movements suggest a bearish bias, with key support levels and potential targets indicating a possible continuation of the current downtrend.
Gold continues to go nowhere as it further trades within a seven day price range on Wednesday. The stage is set for a continuation lower. A bearish bias remains given the breakdown from a bear flag last week. Gold also continued to fall away from the 20-Day MA, which was tested as resistance all this week. April 23 was the first decline below the 20-Day line since the rally began on February 29 with a breakout from a symmetrical triangle bottom pattern.
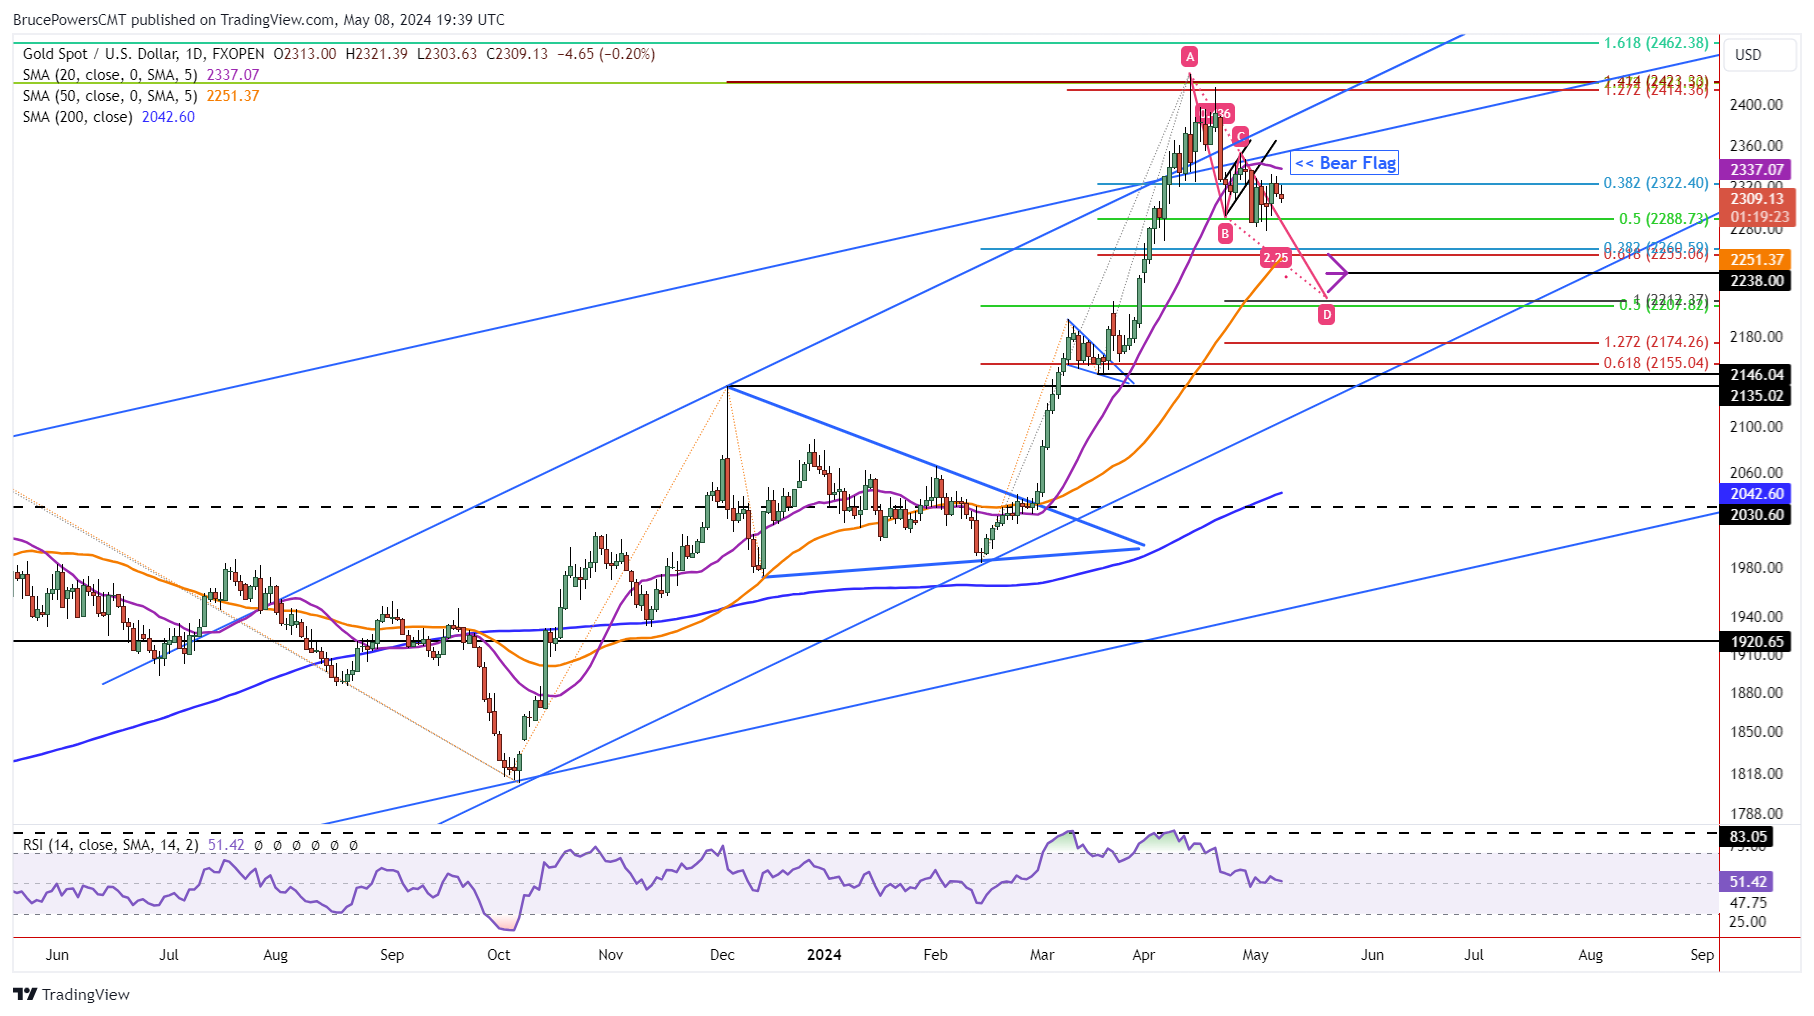
50-Day Moving Average is Key Lower Target
A key lower potential support level is around the 50-Day MA, currently at 2,251. It is close to converging with a Fibonacci confluence zone from 2,261 to 2,255. Together, they create a price range from 2,261 to 2,255. This will be a decision zone where there may be signs of support followed by a bullish reversal. However, there are lower price targets in the case that gold continues to retrace the previous advance.
Lower Targets if 50-Day Line Fails to Hold
The initial target from the bear flag pattern is at 2,238, while a falling ABCD pattern targets 2,212. That lower price level is given added significance by the 50% retracement at 2,208. It is important to be aware that the low support level from April was at 2,228. This means that if gold falls below 2,228 on the way to the lower price zone, it will have triggered a bearish move on the monthly chart. That would be a sign of weakness that could make it more difficult for the uptrend to recover without further consolidation or retracement.
Recognition of Rising Trend Channels
How down might gold go? There are two rising trend channels on the chart of gold. A larger one and smaller one. Gold remains within the boundaries of the smaller channel, that is within the larger channel. Last month there was a false breakout of both trend channels, leading to the current retracement. Typically, once a side of the channel has been tested as resistance in this case, the potential for gold to fall to test the lower channel line becomes possible. Of course, that would occur first on the smaller channel. But the price represented by the line will depend on when it is approached given its downward slope.
Read Full Story »»»
DiscoverGold
Gold Sideways Trend Continues, Bear Flag Pattern Signals Potential Decline
By: Bruce Powers | May 7, 2024
• Gold remains in consolidation below key resistance levels, with a bearish flag pattern indicating potential for lower prices unless it rallies above recent highs.
Gold remains stuck in consolidation and has been trending sideways for the five days. Consolidation is occurring just below resistance represented by the purple 20-Day MA, currently at 2,330, and the 38.2% Fibonacci retracement at 2,322. The 38.2% price zone previously represented support and now resistance. Further, gold remains under a bear flag that triggered a sharp decline starting with a break below 2,320 last Tuesday. Since then, recent price action has done nothing to negate the potential for a deeper pullback and lower prices indicated by the breakdown of the flag.
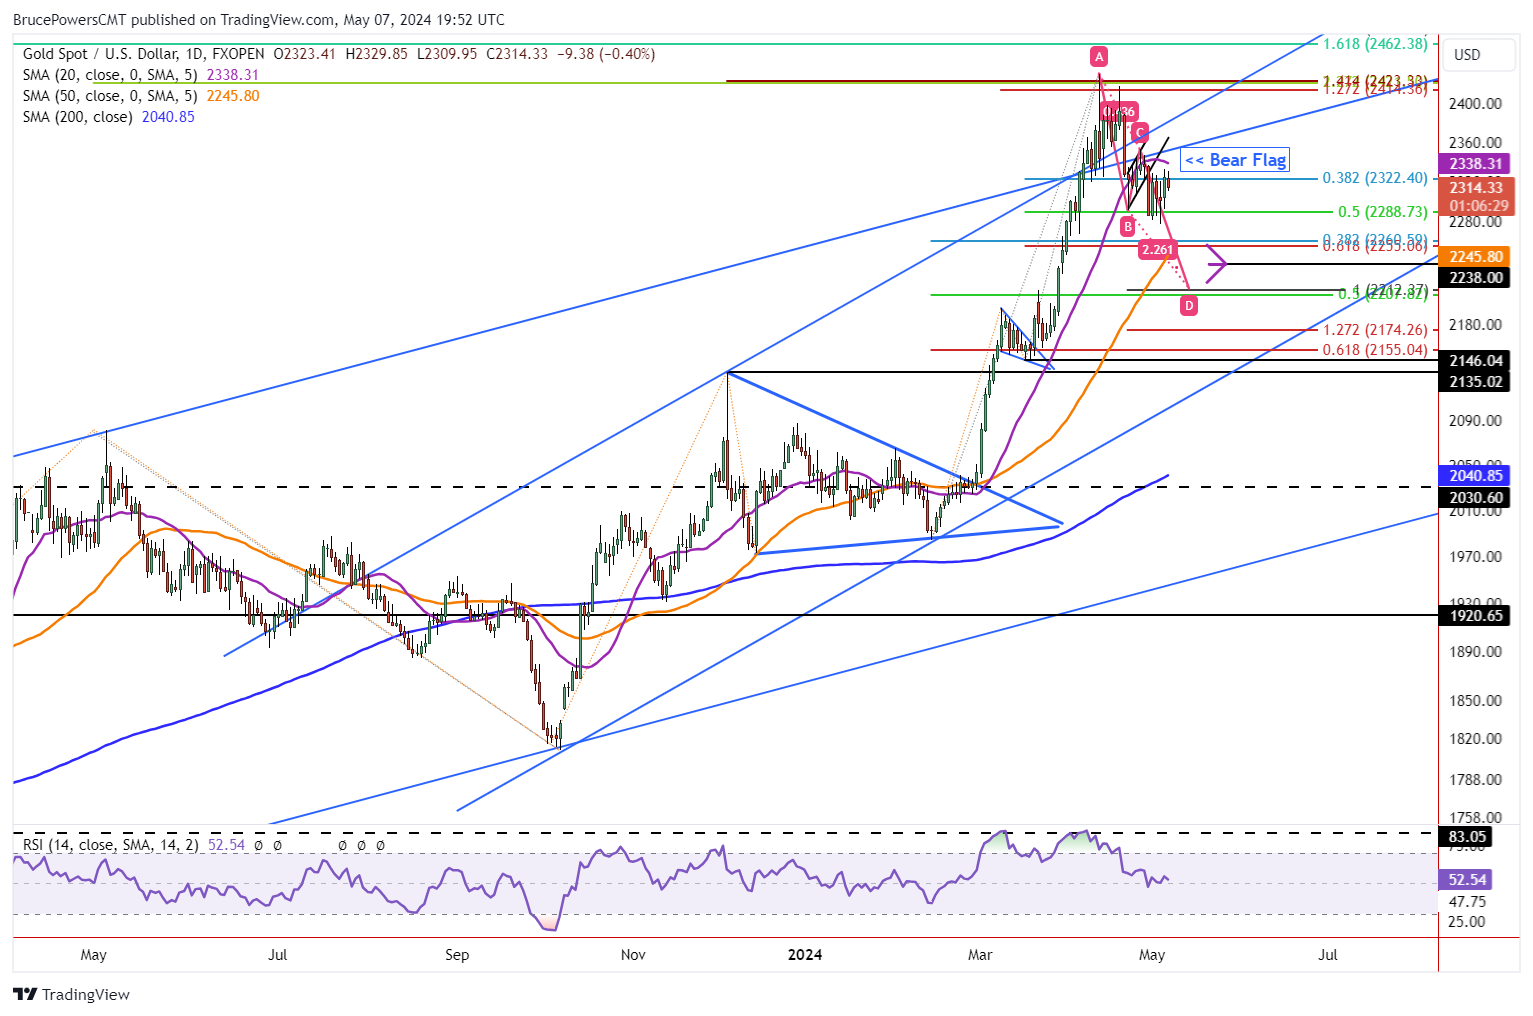
Bear Flag on Deck
The bear flag shows a small rising parallel trend channel. Each boundary line has three touches from price. There is symmetry represented in the pattern as the channel can be divided in half. In other words, it is a clear and solid pattern that has been broken. It shows a pause in the degree of selling that occurred prior to the flag’s formation. Therefore, a continuation lower is the most likely resolution and that has been indicated by the breakdown last week.
Nevertheless, a five-day pause below the breakdown level does not show selling pressure increasing. It leaves open the possibility of a failure of the bearish pattern. A failure would occur during an advance prior to new retracement lows. However, a rally above last week’s high of 2,347 would need to occur for signs of a failed bearish pennant.
Key Near-Term Support at 2,227
Support from the recent consolidation is at last week’s low of 2,227. The next bearish signal will be indicated on a drop below that price level. Calculating the measuring objective for the bear flag provides a minimum target of 2,238. However, the orange 50-Day MA has been rising as the price of gold consolidates. If it continues to consolidate for a while longer, the 50-Day line may join a slightly higher target zone from 2,261 to 2,255. If it does, the chance of hitting that price zone will increase. The 50-Day line is currently at 2,246.
There is also a lower potential target zone from around 2,212 to 2,208. However, last month’s low support was at 2,228. If this lower price zone is reached, then the monthly low would have been broken. A drop below a monthly low would diminish the current underlying bullishness that remains in the market.
Read Full Story »»»
DiscoverGold
Gold Forecast: Gold Cycles Warned of Current Decline
By: Jim Curry | May 5, 2024
From my last article posted back in mid-April ("Gold Cycles Move into Topping Range"), Gold has turned south, and is in the midst of a correction with our 72-day time cycle. Though this decline looks to have further to run, it is expected to end up as an eventual countertrend affair - due to the position of the larger-degree waves.
Gold's Dominant 72-Day Cycle
As in past articles, the last low for our 72-day wave was made back in mid-February, later confirmed by the subsequent reversal above the 2086 figure. In terms of price, that action triggered a 10-14% rally for the metal, which was easily met with the action that followed.
Here again is our 72-day time cycle for Gold:
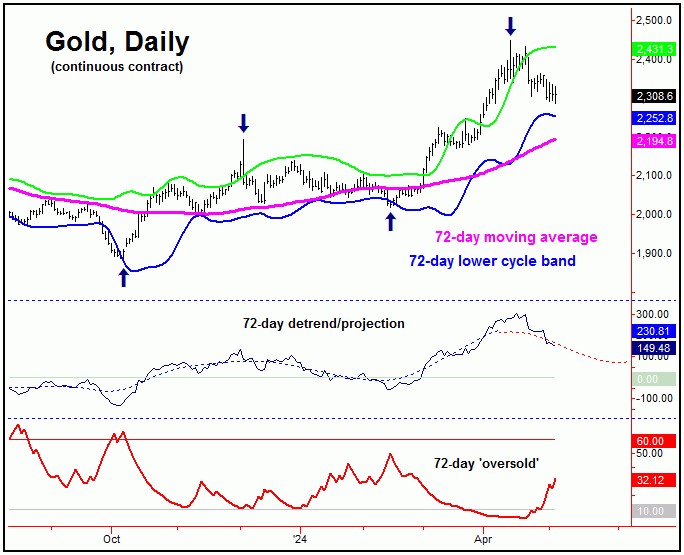
From my April 14th article: "the average rally phases with this 72-day wave were noted as having taken 39 trading days before topping, which favored higher highs into April 9th or later. With that, the highest high seen was Friday's (April 12th) peak of 2448.80, which puts us into the expected topping range with this cycle. Once this 72-day wave turns, a decent correction should be expected to unfold."
As originally noted in article back in March, the average rallies with this 72-day cycle - when coming off a 'higher-low' - took around 39 trading days before completing. This made the inference for strength into April 9th or later, which was seen - with the highest high made with the April 12th tag of 2448.80 (June, 2024 contract).
There were technical signs that Gold was peaking back on April 12th, with the main one of these being our Gold Timing Index, shown on the chart below:
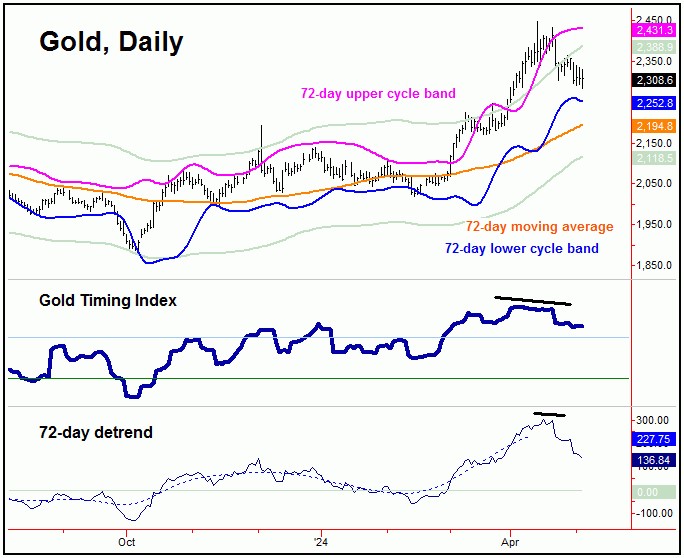
One of the things that we look for at Gold cycle tops (such as with our 72-day wave) is a divergence between our Gold Timing Index, and the actual price of the metal. Typically, the indicator and the price of Gold will move in tandem.
Having said the above, when Gold spikes to a higher price high - and is accompanied by a divergence in our Gold Timing Index - the market is often near a peak of importance. And, since the last peak was expected to come from our 72-day time cycle, the assumption was that this wave was topping - as per my last article from mid-April.
Going further, since the long side was at higher risk - based on the above divergence signal - we managed to exit our open long GLD position on April 12th, the exact day of the high for the last swing. With that, we will be looking for indications to re-enter the long side going forward, based on the position of our 72-day cycle.
Potential Downside & Expected Pattern
In terms of price, following my rule that a valid cycle will see a reversion back to a moving average of the same length better than 85% of the time, the downside 'risk' is back to the 72-day moving average in the coming weeks. Even said, the decline into the next 72-day trough is unlikely to be a straight shot down (though anything is possible).
Having said the above, if the downward phase of our 72-day wave is to remain intact into the late-May to early-June window, this would tell us to expect any short-term rallies to end up as countertrend. With that, we are in the range for a short-term low to develop, coming from a smaller-tracked 20-day cycle, shown in the chart below:
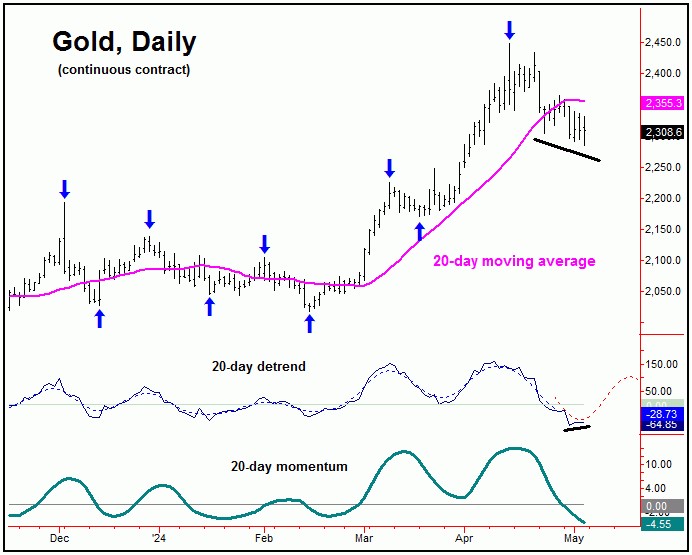
With the above said and noted, a short-term rally with the 20-day wave could see the 20-day moving average acting as the magnet - and may also act as resistance, to a move expected to end up as countertrend, due again to the position of our 72-day wave. If correct, a drop back to lower lows would play out into late-May to early-June.
Stepping back then, if Gold is making lower lows for the 72-day cycle downward phase into late-May to early-June, we will need to be on the lookout for indications of a bottom forming with this wave, as what follows is expected to be another sharp rally of some 10-14% off the low, lasting well into the Summer of this year.
With that, we can look at a chart of our 72-day wave once again, this time adding in both our Gold Timing Index - as well as our 72-day 'oversold' indicator:
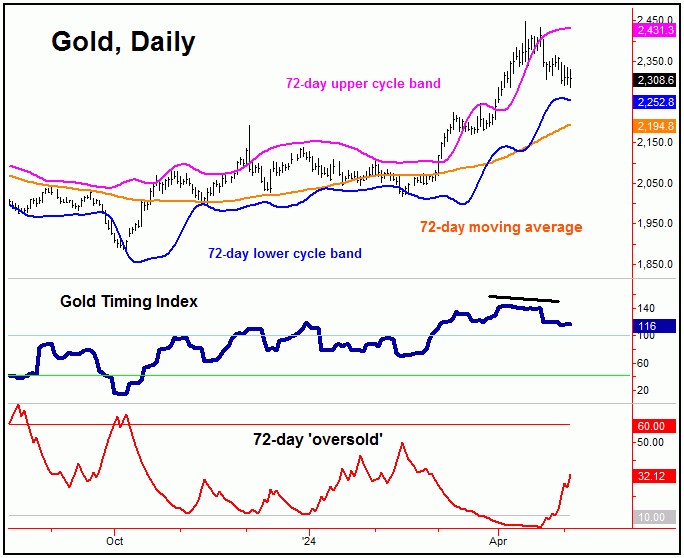
What we like to see as our 72-day wave bottoms out is either (1) a drop below the 40 level in our Gold Timing Index, and/or (2) a spike above the 72-day 'oversold' indicator's upper reference line of 60. If either (or the combination of the above) are seen going forward, this would be our indication to re-enter the long side, in the anticipation of a sharp 10-14% rally playing out into this Summer.
Read Full Story »»»
DiscoverGold
|
Followers
|
408
|
Posters
|
|
|
Posts (Today)
|
1
|
Posts (Total)
|
43788
|
|
Created
|
01/21/05
|
Type
|
Free
|
| Moderators NYBob DiscoverGold | |||
GOLDBUGS - I-hub's #1 precious metals board was created for those with an affinity for the yellow stuff.
Gold has a long history as a hedge against inflation, and in these challenging times it seems prudent to have a certain portion of your portfolio in gold and other precious metals.
For the novice or experienced trader investing in mining stocks or NYMEX, bullion or coins, exploration stocks or producers, you'll find others with similar interests.
Whether a technical or fundamental trader, long or short term, your questions and input are welcomed and appreciated.
"The GOLDBUGS board" is the place where Goldbugs live.
Articles, technical analysis, charts, and data of interest to goldbugs are all welcome here. Information concerning currencies and commodities are also welcome as these markets influence the PM's.
Rules of the Road:
1) No insults or bashing of another member.
2) Members will maintain an attitude of humility.
3) Members who find they are able to help another member will do so.
If you find the board useful please let us know by clicking the "Add To Favorites" link.


| Volume | |
| Day Range: | |
| Bid Price | |
| Ask Price | |
| Last Trade Time: |


