 News
News  Market Data
  Discover
Support: 888-992-3836
Copyright © 2023 InvestorsHub Inc.


Register for free to join our community of investors and share your ideas. You will also get access to streaming quotes, interactive charts, trades, portfolio, live options flow and more tools.
No it's not. I have repeatedly revealed technical indicators, the longer term ones work better. But that's alright, I'll simply stop posting my charts here. Some of them were private and that was a mistake. Goodbye.
Oh boy......sigh......well I'm happy for you. So how about this for a challenge, right here and now I want all the "professional technicians" to tell me exactly what the price of silver and gold will be precisely 5 minutes before Ben Bernankes next speech, and 5 minutes after his speech is over. I'm sure you can google search when the next FOMC hearing will be with his scheduled press conference to follow. Or another fun one, lets go back prior to the announcement of QE2 and see what happened to gold and silver. Is anyone going to honestly say they were due for double digit gains percentage wise, following that announcement??? enough said on the issue.......
Let me explain it in simple English for you, what I am trying to get across is that no fricken chart told anyone that there was going to be a $75 drop in gold and a $3 drop in silver in a matter of minutes. I can read and understand technical analysis enough to understand that! Where the metals due for a correction? Yes they most certainly were as your charts depicts. I'm not arguing that but if you could see past the end of your nose you would understand what I was getting at. Obviously you are interpreting what I said to mean something else. Further more without having to look at "charts", it has been quite easy for me to pick buy and sell points on price action alone especially with silver. Now if you wanna talk about how charts are more useful when trading equities, I'm game and have found charting very useful. So I'm pretty confident I "know half as much as I think I do" and you won't ever here me crying about the prices in metals as I have been very successful trading my way in and out of my position. I would like to kindly thank you for your concern over my vision but I can read just fine. I would also kindly thank you for your concern about me knowing as much as I think I do but I never claimed to know everything or be a professional technical analyst, must be another mis-interpratation because according to my english and comprehension skills, I never claimed anything of the sort. I do however know a little about a lot of things. I'm done conversing with you over this subject........
There has been quite a bit of recent commentary suggesting the smack down had nothing to do with anything related to supply and demand.
The Norcini article I posted earlier once again exposed the fraud and demonstrated how investors are played like so many fiddles at the whim of the banker crooks and their various accomplices.
Until you have true price discovery, the technical stuff is meaningless.
You simply don't know how to read a chart. If you knew half as much as you think you do you could see the negative macd histogram divergence in gold just before the smackdown to get that gap to fill.
Norcini - Gold & Silver Smashed as Bullion Banks Cover Shorts
March 6, 2012
http://kingworldnews.com/kingworldnews/KWN_DailyWeb/Entries/2012/3/6_Norcini_-_Gold_%26_Silver_Smashed_as_Bullion_Banks_Cover_Shorts.html
With gold and silver plunging, along with stock markets and crude oil, today King World News interviewed legendary Jim Sinclair’s chartist Dan Norcini. Norcini told KWN what we are seeing today in the gold and silver markets is not what most people think: “People will tend to blame this take down in gold and silver on the bullion banks. Interestingly, I don’t think that’s the case this time, Eric. I think what happened last Wednesday was bullion bank selling related to central bank intervention, when we had that big takedown, which was timed with Bernanke’s Congressional testimony.”
Dan Norcini continues:
“That did get the ball rolling, but once these guys create enough downside momentum and downside support levels are breached, the bullion banks don’t have to do any selling. At that point, the hedge funds and algorithms start to do the selling for them. (playing investors like a fiddle - cork)
On a day like this, I expect the bullion banks to be covering shorts. They are buying back some of their shorts they put on at higher levels. We’ve had a decade now to see their modus operandi and this has been the pattern. We’ve seen downdrafts in gold and silver accompanied by sharp reductions in open interest and short covering from commercials.
If past patterns hold true, and I’m sure it will, we will see sharp hedge fund liquidations on the long side being met by bullion banks buying or short covering. Remember, the bullion banks were big sellers up at the highs....
“That’s where they (commercials) do their selling is at the upper end of the range in order to cap the price rise.
Once the momentum slows down as a result of the capping efforts, then the bullion banks can just sit back and let the hedge funds do the selling for them and come in and begin to cover their shorts. That’s how the manipulation works and that’s how they make their money.
It’s corrupt. It’s hopelessly corrupt because you have the central banks interfering with the natural process of a market. The markets are all about price discovery. When the central banks look at market action and look at price action and they are not happy with the direction certain markets are headed, they deliberately interfere to alter or change the course of those markets. Of course that’s corrupt.
When you look at a day like today we have the S&P, gold and crude oil all trading down almost exactly the same in percentage terms. These markets are trading lower by 1.85%, 1.88%, 1.85% respectively. What this tells you just from looking at those numbers is this is algorithm selling. Nothing sells that precisely unless it’s being run by computers. So you have a massive amount of selling coming in due to hedge fund algorithms kicking into sell mode.
Obviously, Eric, for those of us who look at gold as a safe haven and a store of value, you realize this type of trading in gold is ridiculous. It’s not based on fundamental, value based selling or anything based on the physical market. It’s simply computer selling.
The catalyst for this today seems to be renewed fears concerning the Greek bailout package that was being put together. There are concerns that some of the private bondholders are not going to accept this arrangement. In fact, a large number of them may not accept this arrangement and that would mean you get a sovereign default.
This is what the market is reacting to. This is a time where the markets begin to price in the deflationary trade and that’s generally a tough time for the metals in the very short-term.”
Norcini also added: “When it comes to the physical market, we know that Eastern central banks have been buyers of physical gold whenever we get these bouts of liquidation. So we are now down at the level where we are going to see a fair amount of central bank buying. It will be interesting to see if this is enough to absorb the selling from the hedge funds.”
© 2012 by King World News®. All Rights Reserved. This material may not be published, broadcast, rewritten, or redistributed. However, linking directly to the blog page is permitted and encouraged.
Eric King
KingWorldNews.com
To return to BLOG click here.
http://kingworldnews.com/kingworldnews/KWN_DailyWeb/Entries/2012/3/6_Norcini_-_Gold_%26_Silver_Smashed_as_Bullion_Banks_Cover_Shorts.html
Wednesday's Analytical Charts for Gold, Silver and Platinum and Palladium

http://www.kitco.com/reports/template_jimw.htm
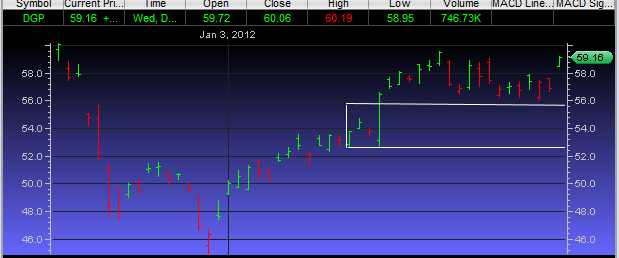
"there is no damn chart or technical analysis that suggested the dramatic drop in gold and silver spot price." You're wrong. I just did it with HL and GPL and DGP. They all came back to the zones I pointed out on charts posted on this board BEFORE it happened. Spot price behaved in the exact same way.
If you are mocking me, enjoy yourself, but you may want to re-read what I have written. I don't give a rats ass how you think charts work or don't work, my point is that there is no damn chart or technical analysis that suggested the dramatic drop in gold and silver spot price. But oh boy is it easy afterwards to paint your pretty pictures. So let's be clear on my opinion when it comes to charts when it pertains to gold and silver o.k.?
Oh, one caveat. A lot of weekly charts appear overbought so that's the lemon inside the pickle. LOL.
I think gold and silver may have bottomed yesterday. Basically, I figure gold should hold $1650 or higher, Silver $31 or higher. This is March, they're supposed to be pulling back. The cycle looks to be 2-3 weeks early this year so far.
Those are not designed to be long term holds. Those are day trading vehicles, at the most swing trade.
You all see IAG lately? In the 13's. There's a tiny gap in the 9's. I'm getting all excited, because we are going down. Just don't know how far. I'm going to be buying low.
Probably a relief rally to my favorite spot 15 1/2.
ZSL, DUST, GLL all on deck for next week.
Prodigy Gold Inc. (PDG) 666-fiat$0.78 UP $0.03 +4.00% 
Volume: 495,513 @ 3:55:11 PM ET Good Demand
Bid Ask Day's Range
0.76 0.78 0.75 - 0.78
TSX:PDG Detailed Quote Wiki
http://investorshub.advfn.com/boards/read_msg.aspx?message_id=72930139
God Bless
PMO SELL Signal - Market Vectors Gold Miners (GDX) By Erin Swenlin Heim
* Monday, March 5, 2012
![]()
Market Vectors Gold Miners (GDX) generated a PMO (Price Momentum Oscillator) SELL signal because the PMO crossed down through its 10-EMA. This signal was flagged on today's ETF Tracker Report.
Positive:
PMO SELL signal occurred in recent overbought territory.
Double-top formation, bearish with price close to reaching the neckline.
20/50-EMAs have turned down.
Long-term Trend Model SELL signal (50-EMA crossed below 200-EMA last December).
Negative:
PMO only somewhat overbought.
Technically still on an intermediate-term Trend Model BUY signal (20-EMA is above the 50-EMA).
Neckline has not been penetrated yet.
http://blogs.decisionpoint.com/chart_spotlight/2012/03/pmo-sell-signal-market-vectors-gold-miners-gdx.html
George.
Yup, and that's why over the long term, they have not been good investments.
These gold and silver ETFs really take it on the chin on these down drafts. I got stopped out of USLV twice already and just now bought it back--only to see red again. NUGT is back in the $18s. GDXJ has to be a buy under $25.
The miners are reluctant to go up with the metals...but have no problem collapsing on a day such as today.
Prodigy Announces Closing of $42.5 Million Bought Deal Financing -
![]()

Prodigy Announces Closing of $42.5 Million Bought Deal Financing
NOT FOR DISTRIBUTION TO UNITED STATES NEWSWIRE SERVICES OR FOR DISSEMINATION IN THE UNITED STATES
Vancouver, British Columbia CANADA, March 05, 2012 /FSC/ -
Prodigy Gold Inc.
(PDG - TSX Venture)("Prodigy" or the "Company") has completed
its previously announced bought deal financing (the
"Offering"). Pursuant to the Offering, the Company has issued
37,500,000 Common Shares at a price of $0.80 per Common Share
and 13,158,000 flow-through Common Shares (the "Flow-Through
Shares") at a price of $0.95 per Flow-Through Share, for
aggregate gross proceeds of $42,500,100.
The syndicate of underwriters was led by Casimir Capital Ltd.
and Paradigm Capital Inc., and included National Bank Financial
Inc., Byron Capital Markets Ltd. and PI Financial Corp.
The Flow-Through Share proceeds will be used to incur eligible
Canadian exploration expenditures that will be renounced to
subscribers effective on or before December 31, 2012.
This news release does not constitute an offer to sell, or the
solicitation of an offer to buy, ----or for the account or
benefit of, a U.S. person, absent U.S. registration or an
applicable exemption therefrom.
On behalf of the Board of Directors
Brian J. Maher
President and Chief Executive Officer
FOR FURTHER INFORMATION, PLEASE CONTACT:
Prodigy Gold Incorporated
Email: ir@prodigygold.com
Website: http://www.prodigygold.com
tel.: 1-604-688-9006 Fax: 1-604-688-9029
Neither TSX Venture Exchange nor its Regulation Services
Provider (as that term is defined ----statements whether as a
result of new information, future events or otherwise except as
otherwise required by applicable securities legislation.
To view this release as a web page, please click on the
following link:
http://www.usetdas.com/pr/prodigy03052012.htm
Source: Prodigy Gold Inc. (TSX-V: PDG)
http://www.www.prodigygold.com
Maximum News Dissemination by FSCwire.
http://www.fscwire.com
http://tmx.quotemedia.com/article.php?newsid=48215912&qm_symbol=PDG
Magino Gold Mines Property -
http://prodigygold.com/projects/gold_division/magino/
http://prodigygold.com/
To view this release as a webpage, please click on the following link:
http://www.usetdas.com/pr/prodigyprfeb152012.htm
http://investorshub.advfn.com/boards/read_msg.aspx?message_id=71346228
http://investorshub.advfn.com/boards/read_msg.aspx?message_id=72124412

God Bless
Charts tell the story..Here's a post from 2/21. DGP has held up the theory as did GPL when I posted the chart on that one. These spaces act like magnets to the price of ANYTHING. This is how it works and has been proven once again...DGP has now retraced the box in the chart below to 53.28.
RBKissMyAs Member Profile RBKissMyAs
Tuesday, February 21, 2012 11:24:47 AM
Post # of 26436
Nice spike but let's use DGP as another example to be cautious here. Notice the huge space left behind as outlined by the box. Then note the long bar on the left. This tends to act as a magnet to draw the price down before the uptrend continues much further. Could be this is the ONE TIME that this theory doesn't not play out but take the chart back at least a year and see that there are NO bars like that left that have not been retraced. Not one.
Playing what hopefully is the bounce right here.
I think some covering in silver is in order. EOM
AUMN way oversold now (RSI under 30).
3M shares short (float 35M, average volume 300K)
They try to keep it down to cover.
All the lights are green, even with silver at 25$, this is very cheap (500M silver ounce high grade for sub 300M$)
ALREADY PRODUCING IN MEXICO, ARGENTINA COME NEXT !
Very nice lookiing charts.
Should I explain to these two what's cooking with gold? Should I bother?
The weekly stochastic is overbought. The buys are generally at 20 or better and its near 80 here.
The buy was Dec 29th. This is the A rise. It's either over or will continue. The D decline ended Dec 29th. I'm on record.
March gold pulls back. That's what it's doing and it will be near $1800 or higher by sometime during May. Gold's pretty closely following its 10 year average seasonal pattern, perhaps reacting a little earlier by 1-3 weeks.
If you bought Dec 29th heavy you should be all set.
Nope, charts don't work. Can't believe what I read here.
Giving all my good shit away on deaf eyes. Maybe they don't know how to read a chart, could be.
It wouldn't be so bad if the supply and demand information was reliable. The technical stuff might might work if they had honest data to work with.
The problem is unreliable data.
A programer friend of mine explained it to me as Garbage in, Garbage out.
Doesn't matter how perfect the methodology is, if the premise is faulty, the conclusion must necessarily be faulty too.
Collusive interactions between Governments, bullion banks, and central banks (and the financial perversions and machinations that necessarily follow), render any resulting price discovery highly suspect.
It is "gross" analysis in my opinion and just more evidence that most of the time charting gold and silver is useless. Think of the technical indicators that may have caused some traders to take a position.......and how did that work out......opps, back to the charts I guess....lmao
As I do not own a TV can someone please inform me when the talking heads push their focus here. TIA
http://www.zerohedge.com/news/chris-martenson-japan-now-another-spinning-plate-global-economy-circus
The ones I WANT to go down are demonstrating that tenacious buoyancy reserved only for before I buy LoL!

Gold is down, the markets are down, the miners are down. No reason not for your stock to be down too...
NUGT is down 1.50 or so....
Looks like it wants to go to 6.65ish.
SBSS 9. Gold is the Gut Reaction, Silver is the Smart Decision
It's just (roughly) paralleling the manipulations in the metals prices, hope you are getting some good deals. They still won't fill my Silvermex order!
Cherry Picking Time sounds like happy time and it should be a lark.
It is when money is no object but it takes guts to trust your research when resources are scarce. GL P


AUMN bleeding like a pig for me because I did not make good use of the buying opportunity in the 5's......
AUMN is bleeding like a PIG for no reason at all !!!!!!
AUNFF Aurcana Corp. (1.00) Silver Producer. Owns 100% of the Shafter silver mine and 99.86% of the La Negra silver-copper-lead-zinc mine. In 2010 La Negra, located in Queretaro State, Mexico, was expanded to mill 1,500 tonnes per day, in early 2012 the capacity will increase to 2000 tonnes per day. La Negra has identified 28 ore bodies, only 3 are currently being mined. Silver production for 2011 increased 20.1% to over 1 million (1,007,256) ounces.
The completed development of the company's new silver mine at Shafter will advance Aurcana from a producing silver company to a mid-tier silver producer beginning in mid 2012.
The Shafter silver mine, located in Presidio County, S.W. Texas, has a NI 43-101 silver resource of 24.6 million ounces Measured and Indicated (2,900,000 tons @ 8.48 opt), 22.8 million ounces Inferred (2,167,000 @ 10.52 opt) and a pre-feasibility completed. Production is forecast at 3.8 million ounces silver recovered once the mine and mill are operating at capacity beginning in mid 2012. Aurcana is on track to complete construction on the silver mine in May, 2012.
Once complete Shafter will be the 2nd largest producing pure silver mine in the U.S. and will supply 10% of all U.S. silver.
Website: http://www.aurcana.com/s/Home.asp
TSX as AUN: http://tmx.quotemedia.com/quote.php?qm_symbol=AUN
Pinksheets: http://www.otcmarkets.com/stock/AUNFF/quote
IHUB: http://investorshub.advfn.com/boards/board.aspx?board_id=19542
1-12-12 Aurcana Reports: Record Silver Production at La Negra
http://tmx.quotemedia.com/article.php?newsid=47482058&qm_symbol=AUN
img]stockcharts.com/c-sc/sc?s=aunff&p=d&yr=1&mn=0&dy=0&id=p74710333207[/img]
Amen to that Montanore. Well put as usual.
They should come out with a chart that tracks insider rigging and corruption. It would be at an all-time high.
Aurcana Increases Shafter's 2012 Exploration Budget to $3M
VANCOUVER, BRITISH COLUMBIA--(Marketwire -03/05/12)- Aurcana Corporation (TSX-V: AUN.V - News)(OTCQX: AUNFF.PK - News)(Pinksheets: AUNFF.PK - News) ("Aurcana" or the "Company") is pleased to report an increased 2012 Exploration Program for the Shafter Project with an approved budget of $3,000,000. The program, designed under the guidance of Dr. P. Megaw, CPG, calls for:
Geophysical surveys
Modern ground geophysics over the mine area is expected to aid in defining the strike and dip extensions of the mineralized zones and their potential structural controls. Historic CSAMT and IP surveys in the early 1980's identified anomalies that appear to correlate well with the location of the known mineralization at the Presidio and Shafter deposits. Additional anomalous responses were also detected that have not been followed up.
Aurcana has engaged Zonge International Inc. to conduct an orientation NSAMT (Natural Source Audio-frequency Magnetotellurics) survey over the Presidio and Shafter deposit area. Initial interpretations are expected next week. The resulting information will assist in developing a comprehensive, focused, drill program.
Diamond Drilling
Carbonate replacement deposits frequently exhibit stacked mineralized horizons where favourable conditions existed that allow deposition of mineralization in multiple beds. An initial 15,000 foot (4,900 m) drill program, supported by Boart Longyear, is designed to test the potential for mineralization hosted by carbonate units lying below the thickest and highest grade historic intersections within the Shafter deposit.
Hole 401, the first hole completed, was drilled to pass under historic hole SD 62 and intersected mineralization from 921 to 933 feet, over a true width of 10.5 feet (3.2 m) with a grade of 8.0 ounces (274 g/t) of silver per ton. This intersection is interpreted to be located approximately 100 feet down dip to the southeast of the ore zone that was intersected in historic Hole SD 62, thus providing confidence that the mineralized zone continues to the southeast.
 ---------------------------------------------------------------------------
 Sample Interval (ft)           meters           Ag (oz/t)          Ag (gm/t)
 ---------------------------------------------------------------------------
 921-922                           0.3              5.039                172
 ---------------------------------------------------------------------------
 922-923                           0.3              7.353                251
 ---------------------------------------------------------------------------
 923-924                           0.3               9.55                327
 ---------------------------------------------------------------------------
 924-925                           0.3              3.531                121
 ---------------------------------------------------------------------------
 925-926                           0.3              0.453               1.55
 ---------------------------------------------------------------------------
 926-927                           0.3              5.947                203
 ---------------------------------------------------------------------------
 927-928                           0.3             11.621                398
 ---------------------------------------------------------------------------
 928-929                           0.3             22.138                380
 ---------------------------------------------------------------------------
 929-930                           0.3             12.865                440
 ---------------------------------------------------------------------------
 930-931                           0.3              8.247                282
 ---------------------------------------------------------------------------
 931-932                           0.3                3.9                133
 ---------------------------------------------------------------------------
 932-933                           0.3              5.171                177
 ---------------------------------------------------------------------------
Technical Weekly Precious Metals Report
* Monday, March 5, 2012
Gold
Weekly Report
> See Charts
Gold is still trading within narrow levels since Friday's session, but technical signs suggest that a downside movement could control the metal's movement today, affected by the breach of the ascending main support shown above in pink in addition to the bearish candlestick formation that started after reaching the top of 1790.00. Gold could test areas around 1687.00 and 1656.00, but consolidation below 1763.00 is required. Momentum indicators are negative and support our expectations.
The trading range for this week is among the key support at 1656.00 and key resistance now at 1800.00.
The short-term trend is to the upside with steady weekly closing above 1475.00 targeting 1945.00.
Silver
Weekly Report
> See Charts
Trading below the main resistance of the downside movement and also below the ascending support level shown above in pink suggests that the downside movement could extend this week, especially when momentum indicators support our bearish outlook. In fact, consolidation below 34.40 is required to confirm the negativity. But in general, any trading below 35.75 supports our negative outlook to remain valid.
The trading range for this week is among the key support at 31.80 and key resistance now at 38.35.
The short-term trend is to the downside with steady weekly closing below 38.00 targeting 20.05.
http://ecpulse.com/en/dailyreports/technicalpreciousmetals/2012/03/05/06-20-13/index.htm
George.
Click on "In reply to", for Authors past commentaries.
No, there is no doubt in my mind about Silver. Have been and will continue to be a buyer of Silver, and always will take delivery of it.
Thanks for the charts.
George.
Ron Paul proofs 2012 available with lower prices this morning:
http://www.providentmetals.com/1-10th-oz-ron-paul-gold-bullion-round.html?utm_source=homepage&utm_medium=slideshow
Here's a link to both of
Fraily's weekend newsletters. http://tinyurl.com/7539e3p
Excellent basserdan, and absolutely, a "must watch."
Those that know better and perpetuate the fraud are the most criminal of all.


Warren Buffett.... unplugged and undressed!
I believe this video should be considered a "must watch!"
ISVLF Impact Silver (2.07) 1 million ounce x year profitable silver producer. Extensive portfolio of advanced silver projects in Mexico totaling 623 sq km. Currently produces silver from multiple mines feeding a 500 tonnes per day processing plant at the Royal Mines of Zacualpan. A new open pit mine, the Capire Project in the Mamatla Mineral District, is scheduled for production in late 2012, and will significantly increase production into 2013 and onwards.
Website: http://www.impactsilver.com/s/Home.asp
TSX as IPT: http://tmx.quotemedia.com/quote.php?qm_symbol=IPT
Pinksheets: http://www.otcmarkets.com/stock/ISVLF/quote
IHUB: http://investorshub.advfn.com/boards/board.aspx?board_id=7290
1-12 Corporate Presentation: http://www.impactsilver.com/s/CorpPresentations.asp
1-23-12 IMPACT Silver 2011 Exploration Review and 2012 Outlook
http://tmx.quotemedia.com/article.php?newsid=47733410&qm_symbol=IPT
11-28-11 IMPACT Silver Corp. Announces Record Revenues and Net Earnings for the Nine Months Ended September 30, 2011
http://tmx.quotemedia.com/article.php?newsid=46443328&qm_symbol=IPT
img]stockcharts.com/c-sc/sc?s=ipt.v&p=d&yr=1&mn=0&dy=0&id=p44033100056[/img]
The Maund "analysis" was pretty ridiculous. Classic example of trying to make the "puzzle fit the piece," instead of the other way around, as it should be.
Trying to explain that kind of blatant collusive manipulation (with a straight face) as if it were somehow part of a natural supply and demand driven process would be funny
if it weren't so grounded in fraud.

Can't say I agree with Clive's analysis. I would like to see him incorporate the number of contracts traded which caused silver to plummet around the time of uncle Benny's speech, add gold to that also, and then analyze how useless the charts "can" sometimes be. Not real hard to paint a picture the way Clive has! I'm also pretty sure silver did break out, the rest is self explanatory! Thanks for sharing Mr.Maund's chart! :)
|
Followers
|
404
|
Posters
|
|
|
Posts (Today)
|
0
|
Posts (Total)
|
43453
|
|
Created
|
01/21/05
|
Type
|
Free
|
| Moderators NYBob DiscoverGold | |||
GOLDBUGS - I-hub's #1 precious metals board was created for those with an affinity for the yellow stuff.
Gold has a long history as a hedge against inflation, and in these challenging times it seems prudent to have a certain portion of your portfolio in gold and other precious metals.
For the novice or experienced trader investing in mining stocks or NYMEX, bullion or coins, exploration stocks or producers, you'll find others with similar interests.
Whether a technical or fundamental trader, long or short term, your questions and input are welcomed and appreciated.
"The GOLDBUGS board" is the place where Goldbugs live.
Articles, technical analysis, charts, and data of interest to goldbugs are all welcome here. Information concerning currencies and commodities are also welcome as these markets influence the PM's.
Rules of the Road:
1) No insults or bashing of another member.
2) Members will maintain an attitude of humility.
3) Members who find they are able to help another member will do so.
If you find the board useful please let us know by clicking the "Add To Favorites" link.


| Volume | |
| Day Range: | |
| Bid Price | |
| Ask Price | |
| Last Trade Time: |


