 News
News  Market Data
  Discover
Support: 888-992-3836
Copyright © 2023 InvestorsHub Inc.


Register for free to join our community of investors and share your ideas. You will also get access to streaming quotes, interactive charts, trades, portfolio, live options flow and more tools.
TQQQ moves more IMHO.
What are your views on TNA?
CHANGE OF DIRECTION
1 MACD
2 RSI(10) < 30
3 RIS(10) > 70
4 2 CLOSING POINTS
5 BREAK OF TREND LINE
Bernstein: fund flow indicator that monitors the pace of sentiment deterioration at 2nd most pessimistic level in 14 years $SPX

Barron`s
MONDAY, MAY 7, 2018 INVESTOR SENTIMENT READINGS
High bullish readings in the Consensus stock index or in the Market Vane stock index usually are signs of Market tops; low ones, market bottoms.
http://www.barrons.com/public/page/9_0210-investorsentimentreadings.html
May 4, 2018
Are Investors Overlooking The Forest Due To The Volatile Trees?
MOVING PAST DAY TO DAY VOLATILITY
https://www.ccmmarketmodel.com/short-takes/
Looking like a new uptrend for $TNA with Friday's close!!!!!!!!!!
IJR Triggers Mean Reversion Signal
The rest of this commentary is devoted to the mean-reversion trade. Given the decline in junk bonds and rise in Treasury bonds, it may be time to hold off and watch price action as certain areas of the market become oversold. The short-term mean-reversion system using oversold levels in RSI triggered on Wednesday for the S&P SmallCap iShares (IJR).
A bullish signal occurs when RSI(5) moves above 30, which means RSI became oversold (<30) prior to this signal.
The system holds this position until a close below the Chandelier Exit (22,1), which is the red line.
IJR is currently below the Chandelier Exit so a move above the Chandelier Exit is required before a sell signal is possible
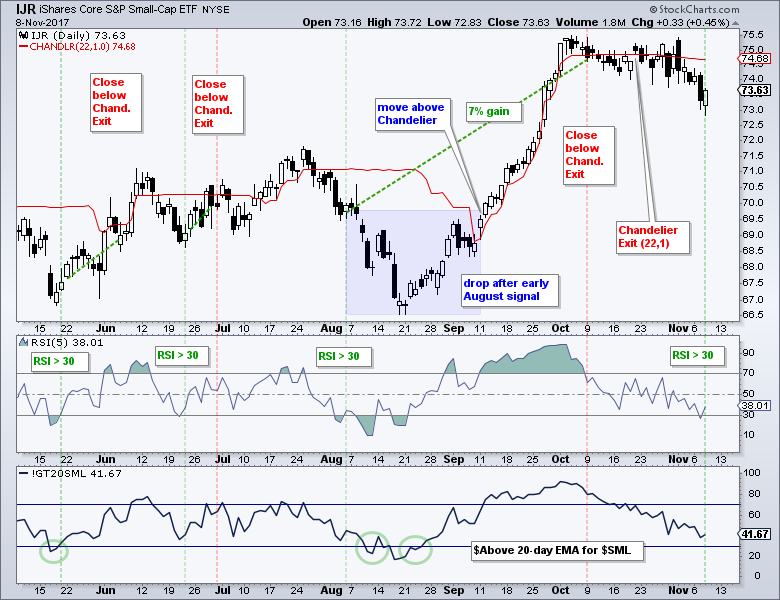
It is imperative that we fully understand an indicator and trading system before we actually trade them. Let's review the last trade for more insight. A bullish signal triggered on August 4th when RSI moved above 30 and IJR was trading around 70. IJR then fell below 67 over the next two weeks and bounced in the second half of August. The Chandelier Exit fell in early September because the 22-day high fell and IJR crossed above this exit on September 11th. Thus, a sell setup was not in place for over a month. Even though the trade got off to a rough start, it finished strong because IJR did not close below the Chandelier Exit until October 9th. The trade ended up with a 7% gain and this was the best trade of 2017. There is a full System Trader article on this mean-reversion system as well as ChartSchool articles on the Chandelier Exit and RSI.
TNA depends on what IWM does.
If IWM goes up 1 % TODAY
TNA goes up 3 % today
So a $100 gets you a $115.00 at 5% for the day?
It is an ETF that tracks 3 TIMES the IWM index.
It is for trades of short term moves only.
Long term it loses value like an option.
What kind of stock is this? 1:1 2:1 3:1 or a reverse stock it seems is possible 1:2?
Small Cap Bull 3x (TNA) surged back to $107 on Friday. TNA is a strong buy on all major pullbacks in 2017, especially into the $65-$72 range.
TNA continues to skyrocket and outperform the stock market. TNA has now rallied from $64-$109 since Donald Trump was elected President and is my top stock to buy going forward on any major pullback.
Small Cap Bull 3x (TNA) continues to surge and is now up about 40% in four days after the Trump victory. TNA will always be a screaming strong buy on every pull back going forward.
TO CHART
TRADES ONLT AT CLOSE
YESTERDAY=SELL AT CLOSE=DOTTED BLUE LINE
http://investorshub.advfn.com/boards/read_msg.aspx?message_id=125110642
Small Cap Bull 3x (TNA) has now rallied from $35.50 to over $80 since February which is why it has been my top stock to trade in 2016. TNA is a super strong buy if we ever see a correction back below $60.
|
Followers
|
40
|
Posters
|
|
|
Posts (Today)
|
0
|
Posts (Total)
|
586
|
|
Created
|
11/07/08
|
Type
|
Free
|
| Moderators | |||
| Volume | |
| Day Range: | |
| Bid Price | |
| Ask Price | |
| Last Trade Time: |


