


Thursday, November 09, 2017 11:58:03 AM
The rest of this commentary is devoted to the mean-reversion trade. Given the decline in junk bonds and rise in Treasury bonds, it may be time to hold off and watch price action as certain areas of the market become oversold. The short-term mean-reversion system using oversold levels in RSI triggered on Wednesday for the S&P SmallCap iShares (IJR).
A bullish signal occurs when RSI(5) moves above 30, which means RSI became oversold (<30) prior to this signal.
The system holds this position until a close below the Chandelier Exit (22,1), which is the red line.
IJR is currently below the Chandelier Exit so a move above the Chandelier Exit is required before a sell signal is possible
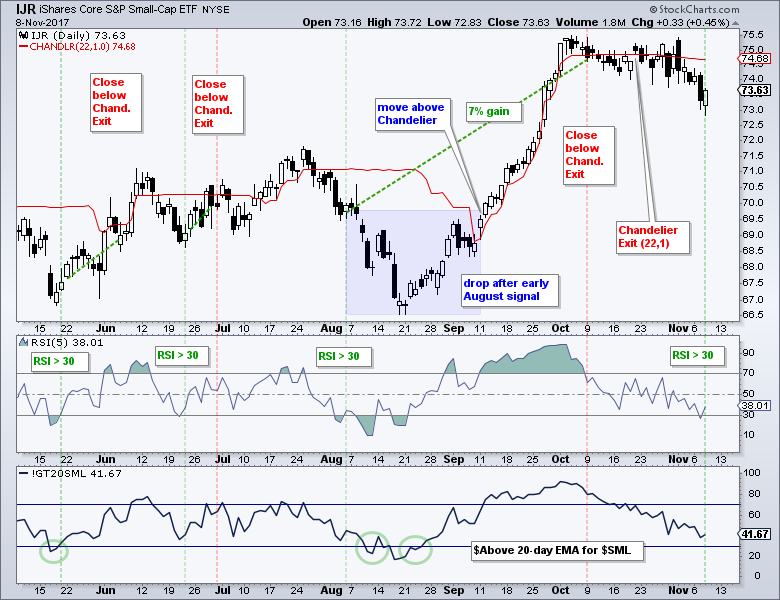
It is imperative that we fully understand an indicator and trading system before we actually trade them. Let's review the last trade for more insight. A bullish signal triggered on August 4th when RSI moved above 30 and IJR was trading around 70. IJR then fell below 67 over the next two weeks and bounced in the second half of August. The Chandelier Exit fell in early September because the 22-day high fell and IJR crossed above this exit on September 11th. Thus, a sell setup was not in place for over a month. Even though the trade got off to a rough start, it finished strong because IJR did not close below the Chandelier Exit until October 9th. The trade ended up with a 7% gain and this was the best trade of 2017. There is a full System Trader article on this mean-reversion system as well as ChartSchool articles on the Chandelier Exit and RSI.
NanoViricides Reports that the Phase I NV-387 Clinical Trial is Completed Successfully and Data Lock is Expected Soon • NNVC • May 2, 2024 10:07 AM
ILUS Files Form 10-K and Provides Shareholder Update • ILUS • May 2, 2024 8:52 AM
Avant Technologies Names New CEO Following Acquisition of Healthcare Technology and Data Integration Firm • AVAI • May 2, 2024 8:00 AM
Bantec Engaged in a Letter of Intent to Acquire a Small New Jersey Based Manufacturing Company • BANT • May 1, 2024 10:00 AM
Cannabix Technologies to Deliver Breath Logix Alcohol Screening Device to Australia • BLO • Apr 30, 2024 8:53 AM
Hydromer, Inc. Reports Preliminary Unaudited Financial Results for First Quarter 2024 • HYDI • Apr 29, 2024 9:10 AM

