 News
News  Market Data
  Discover
Support: 888-992-3836
Copyright © 2023 InvestorsHub Inc.


Register for free to join our community of investors and share your ideas. You will also get access to streaming quotes, interactive charts, trades, portfolio, live options flow and more tools.
Softs Report: Cotton, OJ, Coffee, Sugar, Cocoa
By: Jack Scoville | June 7, 2024
• COTTON
General Comments: Cotton was higher yesterday on speculative short covering and signs of improving demand. The Brazil government is asking Congress there for new taxes on Ag exports of up to 20% and this news added support to the futures market as the flow of Cotton to export channels could be reduced as producers hold back product from the market. USDA said that 60% of the US crop was rated good to excellent on Tuesday afternoon. Big storms were reported in Texas recently that could damage crops. There are also some big problems with too much rain in the Delta and Southeast in recent weeks. Demand has been weaker so far this year but there are hopes for improved demand with the lower prices. The US economic data has been positive, but the Chinese economic data has not been real positive and demand concerns are still around. However, Chinese consumer demand has held together well, and demand for Cotton in world markets has started to increase.
Overnight News:
Chart Trends: Trends in Cotton are mixed. Support is at 72.30, 70.80, and 69.60 July, with resistance of 80.30, 83.20 and 86.20 July.
• FCOJ
General Comments: FCOJ closed sharply lower yesterday, and trends are down on the daily charts. The Brazil government is asking Congress there for new taxes on Ag exports of up to 20% and this news added support to the futures market as the flow of FCOJ to export channels could be reduced as producers hold back product from the market. The market remains well supported in the longer term based on forecasts for tight supplies and very hot weather in Florida. The weekly charts show a key reversal down. Retail prices in May hit a new record high of $9.69 a gallon, 9% higher than last year. The reduced production appears to be at the expense of the greening disease. There are no weather concerns to speak of for Florida or for Brazil right now. The weather has improved in Brazil with some moderation in temperatures and increased rainfall amid reports of short supplies in Florida and Brazil are around but will start to disappear as the weather improves and the new crop gets harvested.
Overnight News:
Chart Trends: Trends in FCOJ are mixed to down with no objectives. Support is at 418.00, 406.00, and 389.00 July, with resistance at 452.00, 473.00, and 477.00 July.
• COFFEE
General Comments: New York closed a little higher o news that the Brazil government might impose a 20$ tax on agricultural exports and London closed a little lower yesterday in correction trading after the big rally the day before on ideas of reduced offers of Robusta and on forecasts for another couple of weeks of dry weather in Vietnam. There were also reports of poor Robusta yields in Brazil during the harvest. Ideas of less production in Vietnam are driving the rally. There were indications that Brazil and Vietnam producers were now offering Coffee, buts in small amounts, Vietnamese producers are reported to have about a quarter of the crop left to sell or less and reports indicate that Brazil producers are reluctant sellers for now after selling a lot earlier in the year. Exports from Brazil have remained strong.
Overnight News: The ICO daily average price is now 2312.95 ct/lb. Brazil will get mostly scattered showers with near normal temperatures. Central America will get mostly dry conditions. Vietnam will see scattered showers.
Chart Trends: Trends in New York are mixed. Support is at 221.00, 212.00, and 208.00 July, and resistance is at 239.00, 241.00 and 245.00 July. Trends in London are up with no objectives. Support is at 4300, 4060, and 3990 July, with resistance at 4540, 4660, and 4780 July.
• SUGAR
General Comments: New York closed higher despite harvest progress in Brazil and the charts show that trends are turning up. London closed a little higher. End users need Sugar but are not finding too much available in the cash market. There are still ideas that the Brazil harvest can be strong for the next few weeks amid dry harvest weather. Harvest weather is called good in center-south Brazil. There are worries about the Thai and Indian production, but data shows better than expected production from both countries. Offers from Brazil are still active.
Overnight News: Brazil will get rains in the south and scattered showers in the north. Temperatures should average above normal. India will get mostly dry conditions and below normal temperatures.
Chart Trends: Trends in New York are mixed to up with objectives of 1990 and 2090 July. Support is at 1880, 1840, and 1800 July and resistance is at 1950, 3000, and 2050 July. Trends in London are mixed to up with objectives of 581.00 and 608.00 August. Support is at 555.00, 548.00, and 536.00 August, with resistance at 570.00, 578.00, and 586.00 August.
• COCOA
General Comments: Both markets were higher yesterday and have developed into a trading range for now. Production concerns in West Africa as well as demand from nontraditional sources along with traditional buyers keep supporting futures. Production in West Africa could be reduced this year due to the extreme weather which included Harmattan conditions. The availability of Cocoa from West Africa remains very restricted and projections for another production deficit against demand for the coming year are increasing. Ideas of tight supplies remain based on more reports of reduced arrivals in Ivory Coast and Ghana continue. Mid crop harvest is now underway and here are hopes for additional supplies for the market from the second harvest. Demand continues to be strong, especially from traditional buyers of Cocoa.
Overnight News:
Chart Trends: Trends in New York are mixed Support is at 8930, 7870, and 7370 July, with resistance at 10210, 10520, and 11120 May. Trends in London are mixed. Support is at 7260, 6610, and 6160 July, with resistance at 7930, 8190, and 8250 July.
Read Full Story »»»
 DiscoverGold
The Corn & Ethanol Report
By: Daniel Flynn | June 7, 2024
We kickoff the day with Nin Farm Payrolls, Unemployment Rate, Average Hourly Earnings MoM & YoY, Participation Rate, Average Weekly Hours, Government Payrolls, Manufacturing Payrolls, Nonfarm Payrolls, and U-6 Employment Rate at 7:30 A.M., Wholesale Inventories MoM and Wholesale Trade at 9:00 A.M., Fed Cook Speech at 11:00 A.M., Baker Hughes Oil & Total Rig Count at 12:00 P.M., Consumer Credit Change, Used Car Prices MoM & YoY at 2:00 P.M.
The June International Trade Report showed that the US trade deficit worsened in April to a $74.6 Bil deficit. This was $6 Bil more than March and $1.84 Tril more than a year ago. This also is the widest deficit since October 2022. Imports rose 2.4% to $338.2 Bil on increased imports of cars, computer accessories, telecommunications equipment, and CRUDE OIL. (All can be produce in the US) Exports increased by just 0.8% to $263.7 Bil, with goods sales increasing $2.2 Bil to 172.7 Bil, while exports of industrial supplies/materials decreased by $1.1 Bil. The largest deficit was to the EU, which increased by 11% to $22.5 Bil, while the trade deficit to China narrowed by 11% to $22 Bil. With atrocious Manufacturing data under this, among many other sec administration pushed on us with their anemic economy. ADP data showed us exactly where the economy is going, with actual pay stubs, The international Trade report was another confirmation not to expect or believe there will be any silver lining in today’s Unemployment data. The (IT) report also showed that the US shipped out 65 Mil Bu of soybeans during April. This was 29 Mil (61%) less than a year ago, a 2023/24 marketing year low. This was inline with the monthly FGIS inspections data. US soybean exports to China fell 22 Mil Bu, 24 Mil Bu less than a year ago, while exports to the rest of the world were 4.6 Mil Bu less than 2023. Official US corn exports in April totaled 253 Mil Bu, vs, 199 a year ago, the largest for any month since May 2022, and 10 Mil above prior expectations. Ag Resources (ARC) reports, Central US Weather Forecast Becomes Chaotic, Tropical Activity Key, Models Agree on Heat during mid-June. The Central US forecast has become changeable as models struggle with potential Gulf tropical activity. Confidence in details beyond 7-days is low. NOAA updated 7-day precipitation forecast is scary looking with several threats, and most important in the short run will be the path of a Gulf stream projected to impact the Caribbean/Florida June 12-14. This will determine the upper air setup thereafter into late month. Yet, there’s a general consensus that a lengthy period of dryness and warming temps ahead. This initially favorable, but rain will be needed beyond the next 10-days as temps rise. The PM run of the EU model features temps in the low/mid 90’s across the Southern Plains, MO, and E Midwest at mid-month. Markets will struggle with dramatic run-to-run changes. Ag Resources (ARC) advises to focus on the 5-day forecast at the moment.
Read Full Story »»»
DiscoverGold
Soft Cuts. The Energy Report
By: Phil Flynn | June 7, 2024
Petroleum prices rallied yesterday but are dropping today ahead of the all-important monthly jobs report that is expected to show that the US added 190.000 jobs which may settle the question as to whether the Federal Reserve will actually cut interest rates and when they might do it.
Oil prices, which have suffered 3 weeks of losses on concerns about a softening global economy will get a boost from the fact that the Fed is about to embark upon a rate cutting campaign.
Oil prices and commodities surged as the European Central Bank (ECB) cut rates as expected rates now the pressure is on the Fed to do follow the rate cut leader.
The ECB Cut the deposit rate to 3.75% from a record 4.0%, but failed to signal whther that was on cut and done or just the beginning. This morning’s eurozone GDP came out as expected so that’s not going to give us a hint one way or the other. The Eurozone GDP Revised QoQ Actual 0.3% (Forecast 0.3%, Previous 0.3%) Eurozone GDP Revised YoY Actual 0.4% (Forecast 0.4%, Previous 0.4%)
Part of the rebound in the price of oil and petroleum was the fact that the market started to realize that they misinterpreted the OPEC plus plan to tapper back on production cuts. Both Russia and Saudi Arabia wanted to point out that the market had overreacted to their announcement.
The reason why they thought they could cut back maybe as much as 180,000 barrels a day is because they expect the demand for oil to increase by anywhere from 1.5 million barrels a day to 2,000,000 barrels a day.
They also wanted to make clear that if that demand growth didn’t happen then the taper would not happen.
The cuts that they are going to consider tapering what’s that 2.2 million barrel a day voluntary cuts from 8 different OPEC members.
OPEC Plus signaled that perhaps in October of 2024 to September of 2025 ahead of the winter demand period when they expect to see a supply deficit that some of these countries that we’re volunteering these cuts might start to incrementally add a few barrels back to the market.
The amount they’re talking about maxes out at 180,000 barrels a day. demand growth increases within their range later in the year the market is going to really feel these extra barrels at all .
In 2025 at the end of the year they were talking about bringing back about 200,000 barrels a day each month from January to September of 2025
Energy Intelligence reported that Saudi Prince Abdulaziz that “ Given the uncertainty around demand growth, the producers said the scheduled return of these volumes could be paused depending on market conditions. “We’re waiting for interest rates to come down. [We want to see] better trajectory when it comes to economic growth, global growth, not pockets of growth here and there. [We want to see] more certainty on the overall economic trajectory. That will probably cause demand to increase with a clear path,” said Prince Abdulaziz.
Zerohedge reported that Russia also is on board with trying to reassure the markets that they will not see a flood of oil.
““Our reduction against April continued in accordance with our OPEC+ agreements,” Novak told reporters on the sidelines of the St. Petersburg International Economic Forum, as quoted by Russian news agency TASS.
Asked about exact numbers for the May oil production, Novak said that the scale of the output cut would become clear in about a week.
When the OPEC+ members announced in early March their intentions to extend the cuts into the second quarter, Russia changed its production/export cut plan and said that it would reduce supply by 471,000 bpd in the second quarter in the form of cuts to oil production and exports. In April, Russia pledged to reduce production by 350,000 bpd and exports by 121,000 bpd. In May, the 471,000-bpd reduction would be in the form of a 400,000-bpd cut to production and 71,000 bpd cut to exports, and in June the Russian supply cut would be 471,000 bpd entirely from production reductions.
Output cuts were to account for most of the extra Russian supply cut this quarter, and they could be the result of reduced refining capacity with maintenance in Q2 and refinery rates estimated to have slumped due to Ukrainian drone attacks on Russian refineries.
I do not want to get corny but it’s notable that US Ethanol exports surged in April. Karen Braun at K KANNBWK pointed out that U.S. ethanol exports in April at 811M liters (214M gallons) were the second highest for any month on record and up 51% from the 3yr April avg. Canada accounted for 29%, United Kingdom 16% and India 9%. Huge monthly record for US ethanol exports to the UK.
You had better get ready for the heat wave that’s going to impact large parts of America not only could it affect crops but it’s going to add to demand for electricity as people try to keep cool.
Fox Weather reported that Triple-digit heat wave continues to scorch West as Las Vegas forecast to climb over 110 degrees. The dangerous heat has prompted the issuance of Excessive Heat Warnings from California to Arizona. Numerous record-high temperatures could fall throughout the region as temperatures rise as high as 25 degrees above average.
Natural gas prices are getting support from the heat even after the Energy Information Administration reported a higher-than-expected injection. EIA said that working gas in storage was 2,893 Bcf as of Friday, May 31, 2024, according to EIA estimates. This represents a net increase of 98 Bcf from the previous week. Stocks were 373 Bcf higher than last year at this time and 581 Bcf above the five-year average of 2,312 Bcf. At 2,893 Bcf, total working gas is above the five-year historical range.
Read Full Story »»»
DiscoverGold
Commodities Daily Market Movers (% Price Change)
By: Marty Armstrong | June 7, 2024
• Top Movers
Cocoa (NYCSCE) Futures 4.93 %
Rough Rice Futures (CBOT) 4.85 %
NY Silver COMEX Futures 4.3 %
Corn (CBOT) Futures 2.91 %
Canola Futures 2.91 %
• Bottom Movers
Gold / Silver Ratio 3.51 %
Wheat CBT Futures 1.11 %
Cheese 1.08 %
Wheat #2 0.93 %
ICE Newcastle Coal Continuous 0.8 %
*Close from the last completed Daily
DiscoverGold
The Corn & Ethanol Report
By: Daniel Flynn | June 6, 2024
80th Reunion D-Day- God Bless Our VETS!
Good Morning!
We kickoff the day with Challenger Job Cuts at 6:30 A.M., Export Sales, Balance of Trade, Imports, Exports, Initial Jobless Claims, Continuing Jobless Claims, Jobless Claims 4-Week Average, Nonfarm Productivity QoQ Final, and Unit Labour Coat QoQ Final at 7:30 A.M., EIA Natural Gas Storage at 9:30 A.M., 4-Week & 8-Week Bill Auction at 10:30 A.M., 15-Year & 30-Year Mortgage Rate at 11:00 A.M.
The Labor Department will release the monthly employment stats tomorrow, and ADP released its monthly payroll data yesterday. ADP reported that private businesses added 152,000 jobs in May, the lowest in 4 months and well below expectations of 175,000 jobs. The service sector added 149,000 jobs during the month, with education/health services providing the largest increase of 46,000 jobs. Financial activities added 28,000 jobs, and trade/transportation/utilities added 26,000 jobs. The goods sector added just 3,000 jobs, with 32,000 construction jobs added, while Manufacturing jobs FELL by 20,000 jobs, and natural resources jobs fell by 9,000. These numbers should not have you shocked or stunned with current administrations handling of the economy along with many other failures.
The Central US forecast is consistent with prior runs. Scattered showers impact the E Midwest for another few hours before a period of lasting dryness and near normal temps blanket all but the Delta/Southeast. The models are in broad agreement on soaking rain impacting Florida June 12-14, but overall Central US forecast details will be changeable as the Gulf/Atlantic becomes more active and solutions struggle with the exact placement of high Ridging aloft the Plains/ W Midwest in late June. Coming Midwest dryness is welcomed following regionally excessive rainfall in MN, IA, WI, and large parts of TN/KY. Heat expands northward from Mexico into S Plains, but extreme heat into June 15th will be confines to TX, OH, and KS. Temps elsewhere are projected in the 70’s and 80’s. Dire drought in Mexico & expanding dryness in China are concerns today, but much closer attention will be paid to US/Ukrainian forecasts. Midwest dryness won’t be an issue until late June, but long range guidance is warm & dry. Abnormal heat is projected to continue in corn areas of Ukraine & Russia for another 30 days. Strength is mostly based on supply loss, but clients should be prepared for a lack of lasting price trend moving forward. Upside targets remain unchanged. The next USDA/WASDE report is next Wednesday, the same day the FED decision on interest rates, the street expects the FED will keep it’s powder dry until September rate cuts ahead of an election. While, the WASDE could be very supportive with global drought pattern fears. Also an update on South American yields should also come into play. Funds remain at record and or near record net shorts. They may still sell into any rallies heading into next weeks WASDE.
Read Full Story »»»
DiscoverGold
OPEC and Other Oils. The Energy Report
By: Phil Flynn | June 6, 2024
Oil prices are trying to bottom, again, as OPEC Plus tries to calm the markets surrounding its oil production cut tapering plans and after the Energy Information Administration (EIA) report that suggests that while gasoline demand and diesel demand fell, the demand for those mysterious “other oils” surged.
Oh yes! The EIA has heads spinning again with data and adjustment numbers that, to say the very least, are raising some skeptical eyebrows.
Not only did the EIA have to use a massive 17.1-million-barrel adjustment number to make the data fit in all the right places, but the petroleum product demand data also raised more questions than answers.
The EIA seemed to feed into the weak gasoline and diesel demand mantra that has been permeating the marketplace, but other data seems to raise questions as to whether that data was really telling the whole story.
The EIA said that gasoline demand fell last week on the week that ended May 31st by 20300 barrels a day to week to 8.916 million barrels a day.
They also said that distillate demand fell 429,000 barrels a day to 3.367 million barrels a day.
Yet overall oil product demand rose because of the other oils category that a massive demand spike of 1.481 million barrels a day to 5.93 million barrels a day that shattered the seasonal record.
That surge in demand for other oils that include the gasoline additive naphtha as miscellaneous other products includes all finished petroleum products not classified elsewhere, including petrolatum, lube refining byproducts (aromatic extracts and tars), absorption oils, ram-jet fuel, petroleum rocket fuels, synthetic natural gas feedstocks, and specialty oils.
And we all know that we see a lot of demand for these other oils on Memorial Day weekend. Maybe some use them to cookout and BBQ! That is perhaps why the demand for those other oils is at an all-time high for this time of year.
And so, while the market has been bemoaning what they perceive as weak gasoline and diesel demand it’s amazing that we saw overall demand for all petroleum products hit 20.510 million barrels a day.
The data suggests that the demand numbers that have been perceived as weak are not as weak has a market has thought.
And as my good friend Tim Dallinger who is a mechanical engineer and a hydraulic specialist and energy analyst points out, the weak demand mantra the trade has been concerned about doesn’t really fit the reality. He points out that if you look at crude inputs from the EIA they are at a seasonal record.
Considering a 4-week moving average, the EIA product demand proxy matches 2019 high’s. Dallinger did say that the moving average for implied distillate demand is down but is only just 0.356 MMBD from the all-time peak.
EIA said that crude oil refinery inputs averaged 17.1 million barrels per day, which was 61 thousand barrels per day more than the previous week’s average. Refineries operated at 95.4% of their operable capacity last week. Gasoline production decreased last week, averaging 9.5 million barrels per day. Distillate fuel production increased last week, averaging 5.1 million barrels per day.
And if you look at the supply according to the Energy Information Administration, we are below average in every major quarter category, even more so if you consider that the Biden administration has drawn down the strategic petroleum reserve to historically low levels.
The EIA said that U.S. commercial crude oil inventories (excluding those in the Strategic Petroleum Reserve) increased by 1.2 million barrels from the previous week. At 455.9 million barrels, U.S. crude oil inventories are about 4% below the five-year average for this time of year. Total motor gasoline inventories increased by 2.1 million barrels from last week and are about 1% below the five-year average for this time of year. Distillate fuel inventories increased by 3.2 million barrels last week and are about 7% below the five-year average for this time of year.
So, it’s very possible that the market has way overplayed itself to the downside based on this perception that the demand for oil products was falling apart. Perhaps the market got it wrong.
OPEC is suggesting that the market got it wrong and tried to ease concerns about the oil production cut taper tantrum that they created at the last OPEC meeting.
Yesterday Saudi Arabia raised demand concerns when they lowered their Arab like crude official selling price to northwest Europe and Asia. Some people theorized it was because they were worried about weakening demand. Yet OPEC suggests that the move was not inspired by weak demand nor was it an attempt to increase their market share but more than anything the move was to maintain their current market share.
This morning OPEC Secretary General Haitham Al Ghais of Kuwait addressed the OPEC oil taper tantrum. Not only did he say that he expects to see OPEC first quarter oil demand growth to grow by an impressive 2.3 million barrels per day he also wanted to remind people that OPEC had the option to pause or even reverse the will output increase.
He also said that even as they cut prices to Europe and Asia, he wanted to point out that he is not trying to increase open market share. I guess that means he’s just trying to defend what share they have.
Russian Deputy Prime Minister Alexander Novak also seemed to suggest the oil reaction to the oil taper was overdone by saying, “OPEC could react very quickly to changes in the oil market.”
So, if the unemployment report doesn’t scare the market into believing that the Fed is going to be unable to raise interest rates, more than likely the oil and petroleum products have more upside than downside from this point.
This comes against a backdrop of rising geopolitical risk. Joe Biden authorized Ukraine to use U.S. weapons to strike targets inside Russia, a major shift in American policy that has raised the risk of further escalation in the war the war that started on Biden’s watch.
Now Russian president Vladimir Putin has threatened Germany and the United States as a response he could provide long-range weaponry to NATO adversaries to strike targets in the West in response to the move by the two countries to authorize Ukraine to use arms it provided on sites within Russian territory.
True perhaps and to accentuate that threat, Putin is sending warships to the Caribbean for war games,
The AP reports that, “The U.S. has been tracking Russian warships and aircraft that are expected to arrive in the Caribbean for a military exercise in the coming weeks, in a Russian show of force as tensions rise over Western military support for Ukraine, U.S. officials said Wednesday. The ships also are expected possibly to make port calls in Venezuela and Cuba, as Russia establishes a Western Hemisphere military presence that the senior Biden administration officials said was notable but not concerning. And you know if the Biden administration tells us not to be concerned there’s nothing to worry about. Other than the possibility of nuclear annihilation.
Massive Venezuelan oil and product exports impacted US supplies last month as they dumped supplies as quick as they could ahead of U.S. sanctions. But even as U.S. sanctions go into place, it isn’t stopping Venezuela from negotiating with the US. We’re at least getting their high paid lobbyist to do so.
Bloomberg News reports that, “Venezuela’s opposition is ramping up lobbying efforts in Washington, trying to persuade the Biden administration to intervene in the court-ordered sale of Citgo Petroleum Corp.’s parent company in the US. The company is the South American nation’s most important foreign asset, and its shares are due to be auctioned by July 15. The opposition fears Nicolas Maduro could blame them for Citgo’s loss ahead of crucial presidential elections set for the end of next month.
Natural gas is getting hot as the weather heats up, driving electricity and cooling demand. Fox Weather is reporting that, “Dangerous heat continues to build across much of the West this week as an early-season heat wave grips the region.” Many areas will see temperatures in the 90s and triple digits later this week according to FOX Weather meteorologists.
On the positive side Fox Weather points out that despite the concerns about a record hurricane season, so far, while the season has just begun, we are lucky. Fox Weather said, “We’re just five days into the start of the Atlantic Hurricane season, and yet amazingly with no named storms so far, it’s the latest we have gone in the year without one in a decade.
Natural gas today will get its weekly inventory report Reuters reports that U.S. utilities likely added a smaller-than-usual 90 billion cubic feet (bcf) of natural gas into storage last week, a Reuters poll showed on Wednesday. That compares with an injection of 105 bcf during the same week a year ago and a five-year (2019-2023) average increase of 103 bcf for this time of year. The forecast for the week ended May 31 would increase stockpiles to 2.885 trillion cubic feet (tcf), about 14.5% above the same week a year ago and about 24.8% above the five-year average for the week.
Read Full Story »»»
DiscoverGold
Natural Gas Bull Pennant Signals Potential Rally
By: Bruce Powers | June 5, 2024
• Natural gas traces a bull pennant pattern, indicating a potential breakout by June 17, with targets at 3.39, 3.64, and 3.78.
Natural gas further traces out a bull pennant trend continuation pattern on Wednesday, as it traded inside Tuesday’s trading range. This pattern is forming on support of both the 20-Day MA and 200-Day MAs. The range of the pennant is tightening as natural gas gets closer to the apex of the pattern on June 17. This means that a bullish breakout or bearish pattern failure from the pennant will happen by then.

Upside Breakout Triggers Above 2.83
An upside breakout of the pennant is indicated on a decisive rally above yesterday’s high of 2.83. Once the recent trend high of 2.92 is broken to the upside, a bullish breakout of the declining trend channel will also occur. If that happens, the prior swing high of 3.39 becomes the next higher target, followed by the 2023 peak at 3.64. Higher up is the target derived from the measuring objective of the pennant pattern. Its target is 3.78.
Strong Bullish Position
The pennant pattern is in an interesting position, holding support of the 20-Day and 200-Day MAs, while further testing resistance at the top trendline. It has the potential to lead to an explosive rally in natural gas. The pullback from the recent trend high has been minor, not even reaching the 38.2% Fibonacci retracement.
This is a sign of strength as buyers could have been waiting for lower prices to get more aggressive. As the price of natural gas consolidates within the pennant pattern it is building up energy for the next swing. The 0.95-point rally prior to the consolidation left a clue as to what may come next. Typically, a bull flag has the potential to match or exceed the rally prior to the consolidation pattern occurring.
Lower Support Levels
On the downside, maintaining support above the 20-Day MA, currently at 2.545, is key to the current environment. The 20-Day MA showed strength recently as it rose above the 200-Day line recently after being below it since February 2. Notice that the 20-Day line is close to converging with the bottom boundary line of the pennant pattern. Following lower interim support levels being tested, natural would likely be headed towards an eventual test of support around 2.25 to 2.23. That first level is the 50% retracement.

Read Full Story »»»
DiscoverGold
The End For Selling Grains? The Corn & Ethanol Report
By: Daniel Flynn | June 5, 2024
We kickoff the day with MBA 30-Year Mortgage Rate, MBA Mortgage Applications, MBA Mortgage Market Index, MBA Mortgage Refinance Index, and MBA Purchase Index at 6:00 A.M., ADP Employment Change at 7:15 A.M., S&P Global Composite PMI Final and S&P Global Services PMI Final at 8:45 A.M., ISM Services PMI, ISM Services Business Activity, ISM Services Employment, ISM Services New Orders, and ISM Services Prices at 9:00 A.M.,EIA Energy Stocks at 9:30 A.M., 17-Week Bill Auction at 10:30 A.M., Dairy Products and Dairy Products Sales at 2:00 P.M.
Purdue University’s monthly Ag Economy Barometer rose 9 points in May to 108. This follows a 15-point decline in April, which was the lowest since June 2022. The Index for current conditions rose 6 points to 89 but remains at one of the lowest levels since the pandemic low in 2020. The index for future expectations remained optimistic and rose 11 points from April to 117. The Farm Financial Performance Index rose 6 points to 82 but was 15 points less than at the end of 2023. Plans for capital investment improved slightly, with that index gaining 4 points to 35, but was still just above the record low set in April. Corn ended steady to lower, US origin competitive in the world market, and energy market recovery is anticipated with the energy complex holding support on a extremely bearish American Petroleum Institute (API) data.
Corn futures worldwide ended lower on Tuesday, while cash market were mixed. FOB basis in Ukraine shed premium while Argentina’s cash market added premium. On a landed basis, US origin is cheapest into Asia for summer delivery, and Ag Resources (ARC) cautions against turning bearish below 440 spot and 460 Dec. A year ago, South American basis was deeply negative. Central US moisture is abundant, but it’s a long growing season and ARC struggles to correlate the absence of drought and high initial crop ratings with any guarantee of trend/above trend yield. Volatility will be the theme. Longer term, an increasingly bright US export outlook keeps analysts upside targets unchanged. Some 30% of Ukraine’s Corn Belt will endure a deepening drought. Unwavering heat harms potential in Mexico. The overhang of large old crop inventories caps new long positioning nearby, but this is no place to sell. It is not all a threat today but long climate models are beginning to propose lasting dryness across the Plains and West Midwest. And lets not forget funds are at record shorts in the grain complex and a squeeze play is very possible given global weather and geopolitical events.
Read Full Story »»»
DiscoverGold
Energy Rice Bowl. The Energy Report
By: Phil Flynn | June 5, 2024
While the petroleum markets try to shake off an almost ridiculously bearish weekly American Petroleum Institute (API) that showed a larger than expected 4.05-million-barrel increase in crude supplies and an equally bearish 4.026 million barrels increase in gasoline supply and a 1.975 million barrel increase in distillates, the longer term issues of global energy security remain.
The short-term focus of the market weakness is on conerns that that OPEC’s production cut taper might mean a flood of oil that would be released, Also concerns that weak gasoline demand is because inflation is hammering the poor in middle class in this country.
As politicians continue to pursue inflationary policies and an anti-fossil fuel policies and attack US oil and gas that will not do anything to ease their burden.
In the US we pay lip-service to energy security with grandiose plans and a false vision of trying to drive our economy by interruptible sources of energy with wind and solar and the pipedream of electrifying of car fleet to get rid of the pipe, the reality is that we have and aspirational energy policy that is based on politics and ideology and not cold hard realities.
While the day-to-day fundamentals shift with the season and sometimes the algo traders, the reality of under investment in reliable energy sources and wasted money on many alternative sources of energy raises the risk of our country being woefully under supplied. The question you must ask is whther or not the US will choose to hold their energy rice bowl in its hand, because if we do not, we know that our competitors like China will. How do I know that! Well because they said so.
Ok I am not sure exactly what holding your energy rice bowl in your hand actually means but it sounds more coherent than recent energy polices coming out of Washington.
What I do know is that China has a much more realistic energy approach that includes not only alternative energy but fossil fuels as well.
China has a plan to “accelerate the construction of a new energy system and improve the ability to guarantee the security of energy resources.”
The Chinese National Energy Association (NEA) wrote that “Energy is an important material foundation and power source for economic and social development, and is related to the national economy, people’s livelihood and national security.”
They went on to say that “Based on the national conditions of energy, China has comprehensively promoted supply-side structural reforms, vigorously enhanced domestic resource production guarantee capacity, and continued to increase high-quality and effective supply. We have implemented a series of strategic measures such as releasing advanced coal production capacity, vigorously improving oil and gas exploration and development, and building a new power system, and completed and put into operation a number of world-leading century projects such as Baihetan Hydropower Station and “Hualong No. 1” Nuclear Power Plant, which have historically solved the problem of electricity consumption for the population without electricity.
They say that They “led the world in the development of non-fossil energy, achieved remarkable results in the clean and efficient utilization of fossil energy, further consolidated and improved the diversified supply system of coal, oil, gas, new energy and renewable energy, and continuously improved the level of safe production.”’
The Biden administration always seems to tout and seem to be envious of Chinas advancements in solar panels and other alternative energies and electric cars yet maybe they should understand that Chinas success is based on the fact of them everything in the above energy policy. They include all forms of energy such as coal oil and natural gas mixed in with renewable energy.
I do know that suddenly, the Biden administration is making big steps towards making nuclear right again the reality is that they are political ideology and their anti-fossil fuel agenda is hurting our economy and will do so in the future unless they change course.
Yet instead, the Biden Administration contuse to attack US oil and gas.
May 3Oth the AP reported that “Senate Majority Leader Chuck Schumer and 22 other Democratic senators are calling on the Department of Justice to “use every tool” at its disposal to prevent and prosecute alleged collusion and price-fixing in the oil industry. In a letter Thursday to Attorney General Merrick Garland and other officials, the Democrats said a recent Federal Trade Commission investigation into a high-profile merger uncovered evidence of price-fixing by oil executives that led to higher energy costs for American families and businesses.
The FTC said earlier this month that Scott Sheffield, the former CEO of Pioneer Natural Resources, colluded with OPEC and OPEC+ to potentially raise crude oil prices. Sheffield retired from the company in 2016 but returned as CEO in 2019. After retiring again in 2023, he continued to serve on its board.
The case against Scott Sheffield does not measure up to the realities of the global energy market nor does it add to US energy security. In Fact, it weakens it.
I have just been reminded of a speech given by Darren Woods of Exxon Mobil gave in November of 2023 where he said that “ Climate change is real, Human activity plays a major role, And, it is one of the major problems facing the world today – the need to address the very real threat of climate change. But it is not the only one. Here’s another global problem, equally important – the need to continue producing affordable energy to maintain and raise living standards around the world.
Mr Wood Said that “Three billion people fall short of modern living standards, and far too many remain trapped in extreme poverty with no access to electricity or clean cooking fuels. The global North-South divide will only be bridged when we commit to solving the world’s energy and emissions challenges simultaneously.” Oil and gas are at the center of both. Combusting them is a leading source of man-made greenhouse gas emissions. That is the societal cost, and it’s real. At the same time, the societal benefits of oil and gas are unmatched in human history. They have done more to grow economies, eradicate poverty and improve quality of life than anything else.”
Oil and gas companies reliably provide affordable products essential to modern life. Making them into villains is easy. But it does nothing – absolutely nothing – to accomplish the goal of reducing emissions.
In fact, it puts the reliable supply of energy at risk…destabilizing global economies, degrading people’s standards of living, and, as we saw in Europe, raising emissions. The better approach – the constructive approach – is to harness the industry’s capabilities for change.
Mr wood begs “Put us to work. We have got the tools – the skills, the size, and the intellectual and financial resources – to bend the curve on emissions.”
Yesterday U.S. Treasury secretary Janet Yellen said that “a Russian oil price cap is still somewhat effective.” So, we got that going for us.
US gasoline demand has been horrible. Prices in many markets are coming down but prices in Chicago is almost 70 ahead of the national average. The market’s reaction to the OPEC production taper is overdone especially because the compensation production should more than offset most of the so-called tapering of the supplies.
This problem the OPEC cartel right now seems to be Iraq which continually overproduces. That’s going to raise tensions in the cartel unless they start to cut back production very shortly. The reimposition of sanctions on Venezuelan oil could also tighten up supplies as we will see a reduction in Venezuelan exports which surged over 30% in the month of May.’
The markets are trying to hold these levels even after the bearish API report keep an eye for the Energy Information Administration status report to see if it shows better demand than the API is suggesting.
If they do, then we probably have a good case at the bottoms end if not get prepared for a test of $70 on crude.
Natural gas is getting support because we’re going to get our first significant heat wave.
Fox Weather reported that “ Just a handful of days into meteorological summer, and heat is already becoming life-threatening in the western U.S. Heat alerts have been issued for parts of California, Nevada, Utah, Arizona, New Mexico, and Texas. It’s possible that Las Vegas could set a record for its earliest 110-degree day during this heat wave.
Fox Weather also reports that “Rare June atmospheric river storms are dumping rain on the Northwest this week. The first ended earlier Monday before the second one arrived Monday evening. Flood alerts are up for parts of Washington.
A region of Kilauea volcano in Hawaii that hasn’t erupted since 1974 became active Monday. Officials said the eruption is happening in a remote area and is low in volume, but “vog” (the visible haze s of gas and aerosol of tiny particles and an acidic droplets created when sulfur dioxide and other gases emitted from a volcano chemically interact with sunlight atmospheric oxygen and moisture and dust could become a problem for areas downwind of the volcano. “
Read Full Story »»»
DiscoverGold
Agriculture Master Report
By: Bill Moore | June 4, 2024
JULY WHT
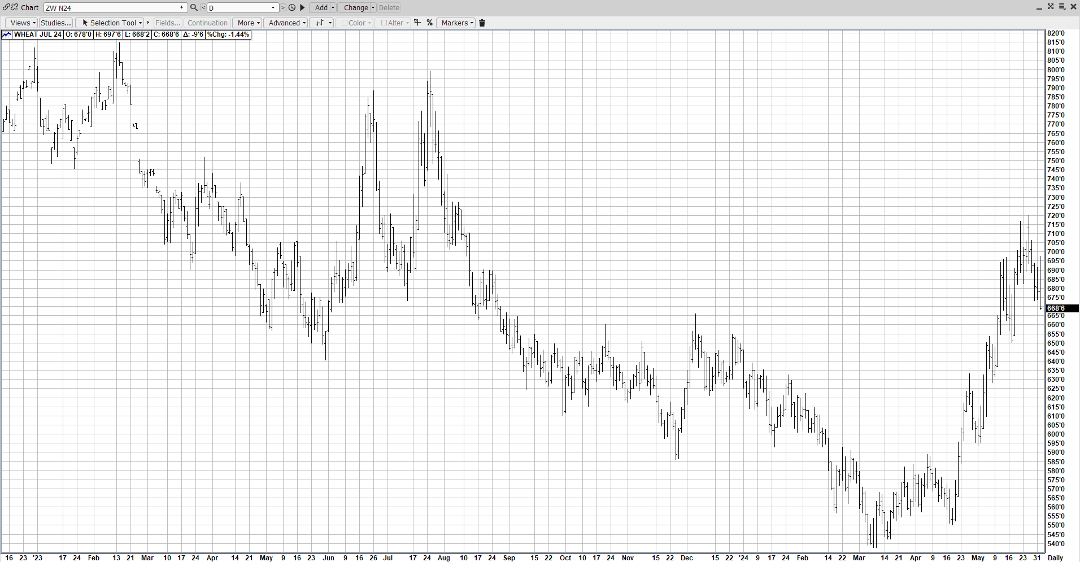
After a $1.70 rally in just 6 weeks off “hot & dry” in Southern Russia, the mkt is still grappling with the fall-out! The latest crop estimate is under 80 mmt! And the mkt has corrected $.50 off the top due to an overbought condition! July Wht is fighting headwinds from corn & beans as early benign growing conditions have pressured those two mkts! Improved exports & continued dry in the Black Sea could well result in a resumption of the uptrend with prices going back over $7.00!
JULY CORN
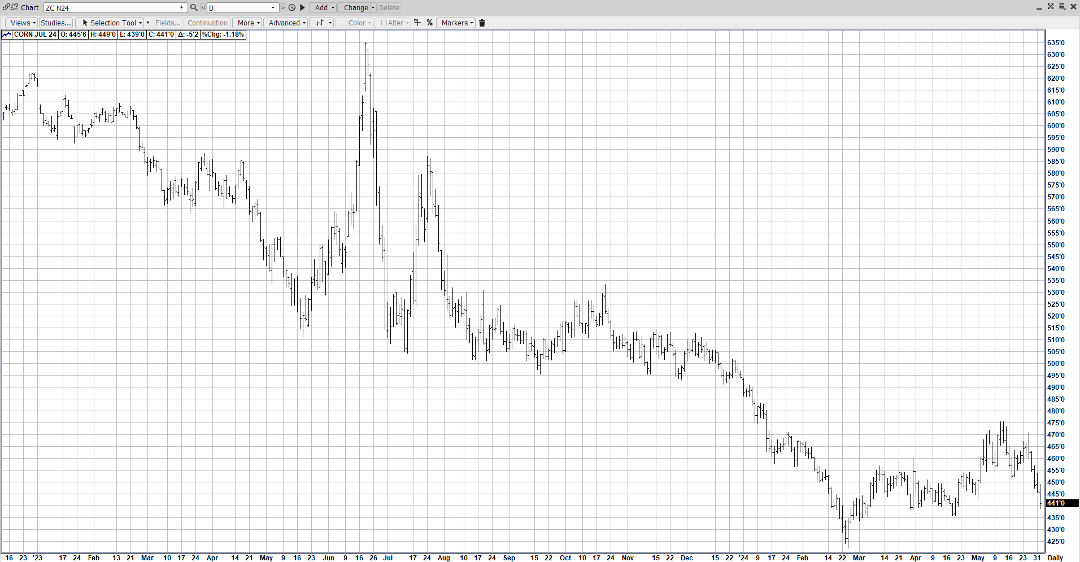
Today at 3pm will be corn’s 1st condition report – expected to be 70-72% good-excellent! As well, planting progress is expected to be 87-89% – right on the 5-yr average! Export inspections this morning were excellent at 1.374mmt (lw-1.130) & also Spain bought 110,000mt of US Corn – first announced this morning at 8am! The US growing conditions are quite favorable early-on but it’s a long growing season & La Nina is forecast! And serious weather issues exist in the Black Sea, Mexico & China which could raise corn exports further in 2024! They’re already running 30-35% over last year!
JULY BEANS
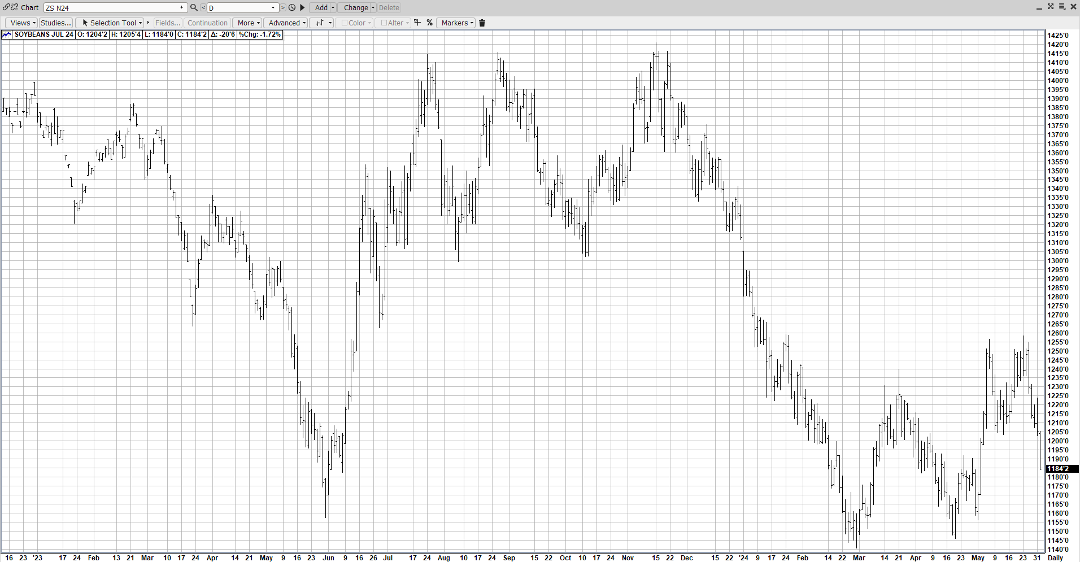
A general lack of “threatening weather” has pushed the mkt lower this morning with current losses at 20 cents! The 3pm Crop Progress Report is expected to reflect 75-77% planted – right on the 5-yr average! The path of least resistance is certainly lower now with the crop almost fully in – amidst favorable climes & moisture! However, the mkt is plenty cheap – currently 2.40 under last summer’s high with a protracted growing season ahead! And myriad weather issues exist with our global trading partners! Exports could easily increase!
AUG CAT
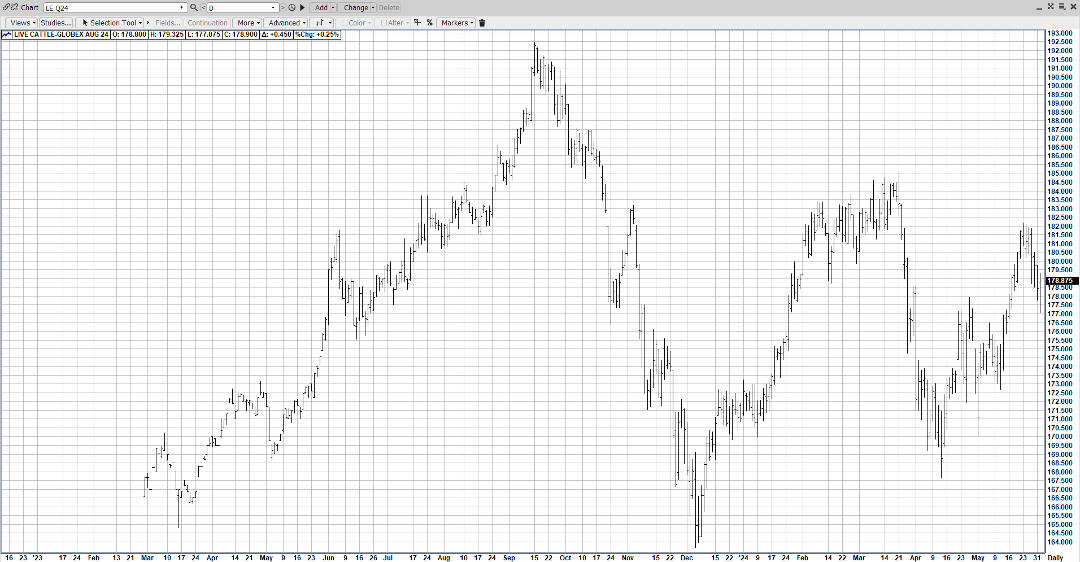
Aug Cat was the obvious beneficiary of solid Memorial Day W/E beef demand as it completed a $15 (167-182) just before the holiday W/E & has corrected ever since! However, demand fell off after that W/E, exports for this time of the year have been the lowest since 2020 & bird flu rumors continue to resurface – being a general drag on demand! Still, grilling season continues with Fathers Day & the 4th of July dead ahead so demand could push the mkt back up to its MD highs!
JULY HOGS
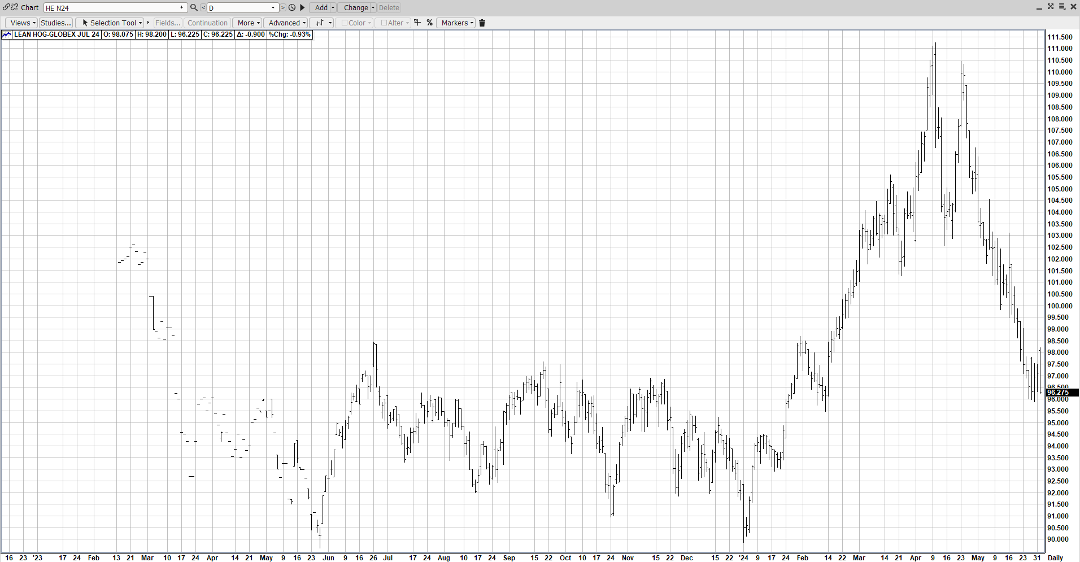
Recent downtrend momentum from the month-long $14 plummet (110-96) seems to be waning and the recent sideways action could be an indication prices are ready to bounce! Exports were up over last year & the highest since April 4! The ever-widening gap between pork & beef prices of course favors pork & could well energize a demand upsurge for pork in the supermarkets! Plus, the pork cut-out came out higher than the previous week!
Read Full Story »»»
DiscoverGold
he Corn & Ethanol Report. Active Hurricane Season Forecasted Is Upon Us
By: Daniel Flynn | June 4, 2024
GFS proposes Tropical Activity in an 11-15 day cycle. The Central US forecast stays wet across the E Plains/W Midwest through Wednesday, with precipitation confines to S Plains/ Delta next week. Coming dryness bodes favorable for areas of !a & Upper Midwest plagued by excess water. Needed rain is offered to Kansas June 8-13. The Tropics will be watched closely beginning in mid-June. The GFS and AI-based models project a tropical system work through the Western Caribbean and into Florida June 16th . Confidence in details is low but this year’s record warm Atlantic/Gulf provides the ingredients for a string of intense showers/hurricanes in summer/early autumn. North American upper air patterns will be more changeable as the tropics activate in late June. This is scary because the Strategic Petroleum Reserves (SPR’s) are low and are for a reason, like an active hurricane season and other Act of God disasters. The SPR’s were not put there to score Brownie points for a FAILED energy policy in attempt to bring down gas prices. A novel approach would be to drill for more US oil in US soil. Another downer on the administration’s war on energy you will pay roughly 25% higher to air-condition your home in the dog days of summer. The CBOT grain futures are coming in weaker on the ongoing fall in energy prices and the initially highly rated US corn crop. 75% of the US corn crop was rated good-to-excellent, the best in years. 91% of the US corn crop planted with soybean seeding advancing to 78% with 55% of the crop emerged. NASS will release its initial soybean crop condition next Monday, and hear again, high ratings are expected. The US winter wheat harvest has started in earnest with 33% of Texas and 22% of Oklahoma already cut. The harvest is expected to reach Southern Kansas during mid-June. Monday’s preliminary CBOT open interest data showed corn surging 24,353 contracts, soybeans 6,652 contracts and Chicago wheat 607 contracts. This highlights new net speculative short grain positions. The breakdown falling below key moving averages has funds adding to net short CBOT positions.
Read Full Story »»»
DiscoverGold
Wheat's Wild Ride: Unraveling Global Supply Changes And What They May Mean For Corn
By: Barchart | June 3, 2024
Even after the strength wheat has shown over the last few weeks, there are still a few non-believers out there when it comes to how the market has traded. I, of course, use the phrase ‘non-believer’ a little tongue in cheek, because while wheat is not a religion, trading it may make you have to find religion…but I digress...
While they may not be wrong, when it comes to the long-term price dynamics in wheat, the potential changes in the world supply outlook remain something to watch, with numerous implications across a whole host of markets.
When looking at the situation in wheat, it feels as though we may have found a value or a range where the markets should trade while we work to assess the global supply and demand outlook. Ample supplies in the short term and a covered end-user have allowed the recent run in price to slow to a certain extent. Add to it harvest getting underway across parts of the Northern Hemisphere and it is easy to see where another leg higher may be difficult with the extent of natural selling we will likely start to see.
As mentioned though, it is going to take months to truly assess the situation when it comes to world supply. The range in estimates of Russian production seems to run from 77 mmt from a grain transportation group to the most recent government estimate of 85 mmt. This is around 10 mmt (365 mbu) less than production estimates released earlier this calendar year.
While the cuts will not be as great, reductions in the Ukrainian production outlook and questions over Black Sea exports have opened the door to strength in the cash markets recently, with Russian prices spiking at the end of May.
Problems are not only isolated to the Black Sea region, with French wheat conditions sitting at a multi-year low and reports of too much rain falling in Germany and surrounding growing areas. The abundance of left over supplies has created an interesting dynamic in the market though, with reports of cash carry in the nearby period being offered, to convince folks to hold bushels through harvest, before an inverse in the deferred period threatens to roll back gains.
Here in the US, hard red wheat harvest looks like it will be able to get rolling, with average to above average yields expected in the areas that didn’t battle a spring drought. Soft red wheat quality could become an issue, with heavy rains throughout spring and even now as harvest gets started opening the door to higher incidences of disease and other problems. Marketwise we are still the most expensive wheat in the world, but not as outlandishly expensive as we once were—this is helping the US build a relatively stout new crop export book, with the largest volume sold as we start the new marketing year in four years.
What happens as we work through June and into July will rely heavily on what the world consumer does—which will likely be driven by harvest yield reports and moves in both spreads and basis.
How corn has reacted to the strength in wheat is what has surprised me the most over the last several weeks. Corn and wheat tend to trade in a certain way with one another because while wheat is used mostly for human consumption, it also plays a very important role in feed rations around the world. Wheat has more protein than corn, giving it 5-10% higher feed value according to Kansas State University researchers. This higher feed value allows for wheat to trade a bit higher than corn and still see active use.
For the most part, wheat and corn tend to trade with wheat around $1.30 or so higher. As wheat gets more expensive, if there aren’t any discounts for quality, it starts to work its way out of rations, giving corn an opportunity to gain inclusion. This is something that has my attention, as wheat is currently sitting $2.36 higher than corn on the board—historically wide for that spread.
While it is understandable why we would see corn trade in a more depressed fashion as weather worries start to fade, corn also got a double dose of bearish headlines last week that helped managed money sell with confidence. The first being news that Argentina had managed to jump through enough phytosanitary hoops they have been added as an approved corn supplier to China. With the second saying that corn based ethanol will not qualify for tax credits associated with sustainable airline fuel production.
On the topic of Argentina, I am old enough to remember at least three other times where a shift in Argentine policy was going to reshape world trade and have also been around long enough to see none of those pan out. I am not saying Argentina won’t be able to step in and take some business the US, Brazil or Ukraine may have otherwise fought for, but I am saying, they must compete because the US, Brazil and Ukraine all have exportable supplies and a need to see China business.
When it comes to the sustainable airline fuel headline, I must tell you, it only just confirmed everything folks in that part of the industry have been talking about for the last year. Corn-based ethanol just doesn’t work when it comes to sustainable airline fuel production without massive tax credits, with many other feedstocks presenting a lower carbon intensity score and working better within the science behind the production. It also probably doesn’t hurt to point out that the announcement covered last year, and this year’s tax periods, when SAF production was nearly non-existent.
While corn may not be used heavily in jet fuel, its use in ethanol remains incredibly strong, with rising exports seen as a positive sign.
In the end, I am not one to say the market is wrong, even when its moves feel a little counter intuitive. I will say I still feel as though we have a long year ahead of us though, with limited certainty, keeping sharp rises in price possible until we get a better feel for the situation overall. While US production weather remains unthreatening for now, issues in Mexico, reports of lower than expected early yields as harvest starts in Brazil, Spain coming back into the market as an importer after relying heavily on Ukrainian supplies and remaining uncertainty over Argentina’s outlook could all be surprising catalysts for a move in the weeks ahead.
Read Full Story »»»
DiscoverGold
Commodities Daily Market Movers (% Price Change)
By: Marty Armstrong | June 4, 2024
• Top Movers
AU - Queensland Base-Load Electricity Futures 11.86 %
NY Natural Gas Futures 6.53 %
Cocoa (NYCSCE) Futures 4.76 %
Orange Juice (NYCE) Futures 4.57 %
• Bottom Movers
AU - Victoria Base-Load Electricity Futures 7.73 %
Iron Ore 62% Fe CFR China (TSI) 6.75 %
Cotton 4.17 %
Canola Futures 4.02 %
Cotton #2 (NYCE) Futures 3.94 %
*Close from the last completed Daily
DiscoverGold
Spinning Barrels. The Energy Report
By: Phil Flynn | June 3, 2024
OPEC Spins Barrels like plate spinners trying to dazzle the market without breaking anything. While the market seems confused as to what this meeting accomplished, and the tiers of many production cuts and production baselines, the reality is that OPEC exceeded expectations by extending most of its existing production cuts into the new year even as they then start to wind some cuts down.
So, it’s best to take the cuts one at a time. In the beginning OPEC plus had originally agreed in October of 2022 to cut oil production by two million barrels a day. During the meeting, that original production cut will stay in place not only through the end of this year, but into 2025 year as well. Think of this as the granddaddy of all the production cuts. Later Saudi Arabia tried to get members to agree to an additional cut and produced a voluntary cut to the tune of 1.66 million barrels a day. The reason why that production cut had to be voluntary was because of a disagreement between the original baseline from which many of the producers had to start counting from.
The United Arab Emirates for example wanted to produce more oil because they have that capability, and they wanted the bigger chunk to the pie. The UEA did get an upgrade to its official production quota yesterday as they get to increase it by 300,000 barrels a day. That came after a previous adjustment of 200,000 barrels a day from 2024. This new quota is supposed to be phased in January and their ability to produce oil will be a 3.519 million barrels by September of 2025.
So, the voluntary cuts were meant to send a message to the market that while they did not actually change their quota, members would voluntarily do their part to try to support prices and make those speculators “Ouch like hell”, to steal a phrase from Saudi energy minister Prince Abdulaziz bin Salman. At the meeting they agreed to extend that cut into 2025.
A at the same time they are setting the stage for unwinding some cuts next year and are telling the market that the reduction is going to be gradual and it’s going to be predicated on the demand for actual barrels of oil. So in other words, if the demand for oil falters these cuts more than likely will stay in place. On the other hand, if demand starts to exceed supply this is the amount of oil that they can bring on without even changing their original quota.
The third round of cuts of the voluntary 2.2 million barrels a day that was announced between June and November of last year and were supposed to run out at the end of this month. They will be prolonged for another three months until the end of September and after that they’re going to start phasing the production caps out over the next year. This phase out and production cut is being done based upon what OPEC perceives as a demand for their product. Saudi energy minister Prince Abdulaziz bin Salman said following the announcement of the deal that, “We maintain the choice that we could pause or could reverse. This is not new; we’ve been doing it over the last three years, and I think it has proven to be effective.”
So, if you do the math, if OPEC unwinds the cut as scheduled oil production by OPEC could increase by about 500,000 barrels a day to about 34.35 million barrels by the end of the year. Other producers that have been overproducing should reduce that a little bit because they are supposed to compensate for their overproduction. By the end of September 2025, it would imply that oil production could rise by an additional 1.92 million barrels a day to 36.27 million barrels a day which would basically have the market keep up with demand growth.
We think that the extension of cuts and the modest increases that are going to be dated, should be supportive to the market. While oil prices are not rising from this level, we seem to be building a base at the lower end of the trading range.
It’s going to come down to demand a summer driving season kicks into high gear. Demand in recent weeks has been surprisingly weak and concerns about geopolitical risk factors have taken a back seat to concerns about rising interest rates.
Reuters reported that, “An aide to Prime Minister Benjamin Netanyahu confirmed on Sunday that Israel had accepted a framework deal for winding down the Gaza war now being advanced by U.S. President Joe Biden, though he described it as flawed and in need of much more work.” There are reports that Netanyahu is ready to go ahead with the first phase of this plan.
Demand ultimately, we still predict, will be a very tight market into the second half of the year. We still recommend that this is a good time to be locking in some long-term options as we believe they is going to go up.
Like Black Rock CEO Larry think had a wakeup call in a speech over the weekend he is warning that the world is going to be short on power and that the power-to-power data centers are not going to be able to be maintained with uninterruptible power sources. “The world is going to be short power, short power. And to power these data companies you cannot have just this intermittent power like wind and solar. You need dispatchable power because you can’t turn off and on these data centers.” Is the same guy who was telling us to divest from fossil fuels. I think finally reality is starting to set in.
Fox Business reported in August of 2022 that, “A conservative consumer advocacy group issued an alert Wednesday urging Americans to be wary about investments managed by BlackRock, the world’s largest investment firm. Consumer Research warned that BlackRock uses its massive clout to push a “radical agenda” on consumers. BlackRock, which manages an $8.5 trillion global portfolio, has pushed so-called environmental, social and governance (ESG) standards prioritizing green energy infrastructure like wind and solar development over traditional fossil fuel investments, the group said in the warning.
“BlackRock is using money that doesn’t belong to them to push an extreme agenda with no regard for American families who are paying the price not only now, but through their pension funds which are being weaponized to the detriment of their potential profits,” Will Hild, the executive director of Consumers’ Research, told FOX Business in a statement. “Consumers deserve to know where their investments are going, especially when it’s leading to higher costs everywhere from gas pumps and groceries to rent prices and housing costs,” he continued. Maybe they got through to Fink.
Natural gas is back on the rise! EBW Analytics reports that returning heat into early this week, strong LNG feedgas, and falling storage surpluses remain supportive for natural gas over the next 30-45 days.
Technical suggest deeper consolidation after the steep May run higher, however—and near-term volatility may persist.
Read Full Story »»»
DiscoverGold
We're about 4 years into the commodities lifetime bullrun.
Natural Gas Intraday Bounce in Natural Gas Sparks Short-Term Optimism
By: Bruce Powers | May 31, 2024
• Despite bearish risks, natural gas shows strength with today's intraday bounce and key moving averages crossing.
Natural gas fell below Thursday’s low today to reach 2.52. Buyers stepped up from there leading to an intraday bounce. At the time of this writing natural gas is in the green and has reached a high of 2.62. But trading continues near the highs of the day. If it can remain near the upper quarter of the day’s range the day may end with a bullish hammer candlestick pattern.

Strength Indicated by 20-Day MA Rise Above 200-Day MA
Today’s low is a higher low than the recent swing low at 2.475, a very minor sign of strength as it is not known whether it will remain a low. Also, the short-term 20-Day MA has started to cross above the long-term 200-Day MA today. This is another sign of strength. Potential support around the moving averages therefore is critical for the sustainability of the rally. The 200-Day line is now at 2.455 and the 20-Day line is at 2.47.
Key Support at 2.46
A decisive decline below the recent swing low and moving averages will signal a deeper retracement. Depending on when it happens, a double top may also be triggered. This week’s high would create the second top. However, the double top is just a possibility until a breakdown triggers. At that point an eventual test of support around the 50-Day MA, now at 2.06, is a possible target. Higher price areas to watch for support include the area around the 50% retracement at 2.25 and further down is the 61.8% Fibonacci retracement around 2.10. Notice that the 20-Day MA has not been tested as support since the gap up on April 26.
Further Consolidation is a Possibility
An alternative scenario may see the price of natural gas further consolidate above the 200-Day MA. Initial resistance would be around the blue dashed downtrend line. Since it is a declining line the price level represented will be falling over time. Subsequently, if the 200-Day line remains an area of support the price range would be narrowing.
Keep an Eye on the Weekly Chart
The weekly chart should also be watched. Both last week and this week have large topping tails and the candlestick patterns are bearish shooting stars. Last week’s low of 2.49 was broken to the downside earlier this week but natural gas quickly recovered and is set to close above that low this week. Nevertheless, these are bearish indications but only if there is a decisive drop below the weekly lows.
Read Full Story »»»
DiscoverGold
Grains Report: Wheat, Rice, Corn and Oats, Soybeans, Canola and Palm Oil
By: Jack Scoville | May 31, 2024
• WHEAT
General Comments: Wheat was lower in all three markets as adverse world growing conditions appear to be part of the price now and could be moderating in the next week or so, anyway. Russian analytical services cut production estimates over the weekend to between 80 and 82 million tons, from over 85 million previously. There were no more reports of frosts and freezing temperatures in Russian growing areas, but rain ia also now in the forecasts. It has also been very dry there. In addition, Ukraine sent drones to several Russian ports, including grains ports, to disrupt the export pace and cost Russia money. The weather is still a key, with extreme dryness reported in Russia and parts of the US and too wet conditions reported in Europe. Big world supplies and low world prices are still around. Export sales remain weak on competition from Russia, Ukraine, and the EU as those countries look to export a lot of Wheat in the coming period. Black Sea offers are still plentiful.
Overnight News: The southern Great Plains should get mostly dry conditions. Temperatures should be above normal. Northern areas should see mostly dry conditions. Temperatures will average above normal. The Canadian Prairies should see mostly dry conditions. Temperatures should average above normal.
Chart Analysis: Trends in Chicago are up with no objectives. Support is at 670, 664, and 658 July, with resistance at 706, 715, and 722 July. Trends in Kansas City are up with no objectives. Support is at 685, 660, and 640 July, with resistance at 734, 740, and 746 July. Trends in Minneapolis are mixed. Support is at 721, 713, and 706 July, and resistance is at 768, 770, and 789 July.
• RICE
General Comments: Rice closed mostly higher yesterday, but July was lower on speculative selling tied to weaker demand ideas. Most of the weakness was in the front month due to many buyers holding off making purchases until the cheaper new crop Rice becomes available in a few months. Support comes from adverse weather in South American growing areas while new selling is noted from the potential for a big crop in the US. The big US crops are now in doubt from reports of extreme rains in southern growing areas and especially near Houston. Supply tightness is expected to give way to increased production this year and greatly increased supplies this Fall. These ideas are reflected in the prices seen in the old crop and the new crop. Big storms continue to bring significant and potentially damaging rains to crops in Texas.
Overnight News:
Chart Analysis: Trends are down with no objectives. Support is at 1750, 1725, and 1674 July and resistance is at 1825, 1843, and 1859 July.
• CORN AND OATS
General Comments: Corn closed lower yesterday on forecasts for improved planting weather for the Midwest and on reports of increased competition for export sales from South America as basis levels are reported tzo be lower in Brazil. Oats were higher. The weather in the Midwest has been very wet and more rain is coming to cause planting delays but to allow for rapid development of planted crops. The Argentine crop has been hit by stunting disease that robs yields and the Brazil Winter crop is suffering from hot and dry weather, but sellers in both countries are offering. Demand has been the driving force behind the rally. Increased demand was noted in most domestic categories along with rising basis levels, and export demand has been strong. Ethanol demand has turned less due to weaker petroleum prices seen lately.
Overnight News:
Chart Analysis: Trends in Corn are mixed. Support is at 444, 438, and 432 July, and resistance is at 467, 475, and 483 July. Trends in Oats are down with no objectives. Support is at 362, 357, and 350 July, and resistance is at 390, 403, and 409 July.
• SOYBEANS
General Comments: Soybeans and Soybean Meal closed lower yesterday on reports of increased offers from South America. Soybean Oil closed a little higher. The weekly export sales report showed less than expected demand for US Soybeans. There were wire reports that China had bought two to four cargos of US Soybeans in recent days. Brazil basis levels are very strong and US products now compare favorably in price to those from South America. Support for Soybeans came from reports of excessive rains falling in US growing areas, especially the eastern sections of the Midwest. Domestic demand has been strong in the US but has suffered as crushers were crushing for oil. Oil demand has suffered as cheaper alternatives for feedstocks hit the bio fuels market.
Overnight News:
Chart Analysis: Trends in Soybeans are mixed. Support is at 1204, 1197, and 1185 July, and resistance is at 1256, 1260, and 1266 July. Trends in Soybean Meal are mixed. Support is at 361.00, 359.00, and 350.00 July, and resistance is at 391.00, 394.00, and 396.00 July. Trends in Soybean Oil are mixed. Support is at 4470, 4470, and 4420 July, with resistance at 4690, 4780, and 4880 July.
• CANOLA AND PALM OIL
General Comments: Palm Oil was higher on Chicago Soybean Oil price action and despite ideas of increasing production. Export demand has been very strong. There is talk of increased supplies available to the market, but the trends are turning mixed on the daily and weekly charts. Canola was also lower yesterday on reports of generally good conditions in Canada.
Overnight News:
Chart Analysis: Trends in Canola are mixed. Support is at 655.00, 646.00, and 639.00 July, with resistance at 675.00, 678.00, and 684.00 July. Trends in Palm Oil are mixed. Support is at 3870, 3820, and 3760 August, with resistance at 3990, 4040, and 4210 July.
Midwest Weather Forecast Scattered showers and storms. Temperatures should average below normal.
Read Full Story »»»
DiscoverGold
Softs Report: Cotton, OJ, Coffee, Sugar, Cocoa
By: Jack Scoville | May 31, 2024
• COTTON
General Comments: Cotton was sharply lower yesterday on follow through selling. USDA said that 60% of the US crop was rated good to excellent on Tuesday afternoon. The weekly export sales report showed much improved sales last week. Wire reports indicate that speculators were covering short positions. Big storms are reported in Texas that could damage crops. There are also some big problems with too much rain in the Delta and Southeast in recent days. Demand has been weaker so far this year but there are hopes for improved demand with the lower prices. The US economic data has been positive, but the Chinese economic data has not been real positive and demand concerns are still around. However, Chinese consumer demand has held together well, and demand for Cotton in world markets has started to increase.
Overnight News:
Chart Trends: Trends in Cotton are up with no objectives. Support is at 75.90, 73.70, and 72.00 July, with resistance of 83.80, 84.40 and 86.20 July.
DJ U.S. Export Sales: Weekly Sales Totals-May 31
For the week ended May 23, in thousand running bales. Net changes in commitments are gross sales, less cancellations, buy-backs and other downward adjustments. Total
commitments are total export shipments plus total sales.
The marketing year for wheat cotton began Aug 1. Source: USDA
wk’s net chg total
in commitments commitments undlvd sales
this yr next yr this yr last yr this yr next yr
upland cotton 222.6 78.1 12227.3 13030.6 3288.4 1727.0
pima cotton 5.4 0.2 323.7 311.1 53.6 5.1
• FCOJ
General Comments: FCOJ closed sharply lower to limit down yesterday on what appeared to be speculative selling tied to profit taking, but the market remains well supported longer term based on forecasts for tight supplies and very hot weather in Florida. The reduced production appears to be at the expense of the greening disease. There are no weather concerns to speak of for Florida or for Brazil right now. The weather has improved in Brazil with some moderation in temperatures and increased rainfall amid reports of short supplies in Florida and Brazil are around but will start to disappear as the weather improves and the new crop gets harvested.
Overnight News:
Chart Trends: Trends in FCOJ are up with no objectives. Support is at 456.00, 441.00, and 438.00 July, with resistance at 477.00, 495.00, and 504.00 July.
DJ Retail Prices for OJ Find New High — Market Talk
0933 ET – Retail prices for orange juice found a new record-high in May, according to the latest Nielsen data. The firm says that OJ prices have risen to $9.69 a gallon. That’s up 9% from this time last year. Earlier this week, the FCOJ contract on the ICE found a new record high of $4.87 a pound, reflecting concerns about an active hurricane season and the USDA cutting its outlook for Florida orange production as greening disease continues to impact those crops. FCOJ has since fallen back down, with the most-active contract down to $4.37 a pound. (kirk.maltais@wsj.com; @kirkmaltais)
• COFFEE
General Comments: New York was a little higher and London closed higher yesterday on new commercial and speculative trading on ideas of reduced offers of Robusta and on forecasts for another couple of weeks of dry weather in Vietnam. There were also reports of poor Robusta yields in Brazil during the harvest. Chart tends turned up with the price action. Ideas of less production in Vietnam are driving the rally. There were indications that Brazil and Vietnam producers were now offering Coffee, buts in small amounts, Vietnamese producers are reported to have about a quarter of the crop left to sell or less and reports indicate that Brazil producers are reluctant sellers for now after selling a lot earlier in the year. Exports from Brazil have remained strong.
Overnight News: The ICO daily average price is now 240.61 ct/lb. Brazil will get mostly scattered showers with near normal temperatures. Central America will get mostly dry conditions. Vietnam will see scattered showers.
Chart Trends: Trends in New York are up with objectives of 240.00 July. Support is at 222.00, 212.00, and 208.00 July, and resistance is at 236.00, 238.00 and 241.00 July. Trends in London are up with objectives of 4300. Support is at 3990, 3890, and 3740 July, with resistance at 4390, 4480, and 4540 July.
• SUGAR
General Comments: Both markets closed lower again yesterday and the charts show that both markets have fallen back into a trading range. There are still ideas that the Brazil harvest can be strong for the next few weeks amid dry harvest weather. Harvest weather is called good in center-south Brazil. There are worries about the Thai and Indian production, but data shows better than expected production from both countries. Offers from Brazil are still active.
Overnight News: Brazil will get rains in the south and scattered showers in the north. Temperatures should average above normal. India will get mostly dry conditions and below normal temperatures.
Chart Trends: Trends in New York are mixed. Support is at 1800, 1770, and 1740 July and resistance is at 1890, 1920, and 1950 July. Trends in London are mixed. Support is at 536.00, 538.00, and 522.00 August, with resistance at 555.00, 566.00, and 571.00 August.
• COCOA
General Comments: Both markets were mixed yesterday, with New York a little higher and London lower, and trends are up for the short term on what appeared to be some speculative short covering. Production concerns in West Africa as well as demand from nontraditional sources along with traditional buyers keep supporting futures. Production in West Africa could be reduced this year due to the extreme weather which included Harmattan conditions. The availability of Cocoa from West Africa remains very restricted and projections for another production deficit against demand for the coming year are increasing. Ideas of tight supplies remain based on more reports of reduced arrivals in Ivory Coast and Ghana continue. Mid crop harvest is now underway and here are hopes for additional supplies for the market from the second harvest. Demand continues to be strong, especially from traditional buyers of Cocoa.
Overnight News: Isolated showers are forecast for West Africa. Temperatures will be near normal. Malaysia and Indonesia should see scattered showers. Temperatures should average near normal. Brazil will get isolated showers and above normal temperatures.
Chart Trends: Trends in New York are mixed Support is at 7870, 7370, and 6770 July, with resistance at 9550, 9600, and 10210 May. Trends in London are mixed. Support is at 6610, 6160, and 5660 July, with resistance at 7930, 8190, and 8250 July.
Read Full Story »»»
DiscoverGold
Lady Columbia Is Angry. The Corn & Ethanol Report
By: Daniel Flynn | May 31, 2024
We kickoff the day with Export Sales, Core PCE Price Index MoM & YoY, PCE Price Index MoM & YoY, Personal Income MoM, and Personal Spending MoM at 7:30 A.M., Chicago PMI at 8:45 A.M., Baker Hughes Oil & Total Rig Count at 12:00 P.M., and Fed Bostic Speech at 5:15 P.M.
The US economy grew by an annual rate of 1.3% in Q1 of 2024. This was down from the advanced estimate of 1.6%. That figure is the real or inflation-adjusted growth rate. The nominal GDP rate was even lower at 1.1%, reflecting economic growth of $298 Bil for the quarter. This compares to Federal Debt growth of $585 Bil, which lifted the total Federal Debt to $34.6 TRILLION versus a GDP of $28.3 Tril. On a per capita basis, economic output was $84,106 against a Federal Debt of $102,950. The Debt/GDP ratio rose to an 11-quarter high of 122.4%. Rising tax rates and higher inflation lock in to be the consequences that will be REALIZED in the coming years.
CBOT grain futures are higher heading into the weekend as we wait for the Export Sales report. The central US weather forecast is nonthreatening which has traders wondering whether the overnight bounce can be sustained? US crops are off to a favorable start with the seasons 1st US crop condition ratings to be released on Monday. I’m looking for a bottom formation. Ag Resources (ARC) looks for corn good-to-excellent ratings to be over 70% with soil moisture levels at their best level in years. Let’s see if the grains can sustain this rally (with all the volatility) into next week. Do I dare say I smell a bottom?
Read Full Story »»»
DiscoverGold
Commodities Daily Market Movers (% Price Change)
By: Marty Armstrong | May 31, 2024
• Top Movers
Gold / Silver Ratio 2.77 %
Tokyo Rubber Futures 1.73 %
Coffee (NYCSCE) Futures 1.55 %
AU - Queensland Base-Load Electricity Futures 0.78 %
Lean Hogs (CME) Futures 0.65 %
• Bottom Movers
Orange Juice (NYCE) Futures 4.19 %
Cotton #2 (NYCE) Futures 4.12 %
Cotton 3.9 %
NY Natural Gas Futures 3.53 %
LME Tin (99.85%) 2.98 %
*Close from the last completed Daily
DiscoverGold
Natural Gas Faces Possible Double Top Amid Bullish Signs
By: Bruce Powers | May 30, 2024
• Natural gas may form a double top at 2.85, with the 20-Day MA nearing a bullish crossover above the 200-Day MA, indicating potential demand strength.
Natural gas continued to pull back on Thursday, filling yesterday’s gap before hitting a low of 2.57 for the day. That led to an intraday bounce, which continues. Yesterday’s high of 2.85 looks like it may be a second top thereby setting up a possible double top pattern.
Meanwhile, the 20-Day MA continues to strengthen and is close to crossing above the 200-Day MA. Those two moving averages together provide a more solid potential support zone than either on their own, at 2.46 and 2.44, respectively. A bullish crossover of the 20-Day line above the 200-Day line will provide another sign that underlying demand for natural gas is strengthening.

Possible Double Top
The potential double top pattern is triggered by a drop below the recent swing low of 2.48. Of course, the two moving averages are close by as well. Therefore, all three levels must be busted to the downside to indicate a decisive bearish trigger for the double top that may be sustainable. Given the significance of the support zone that would be busted an accelerated decline may follow. Potential support levels below 2.48 include a price zone from 2.25 to 2.23, defined by the 50% retracement and prior swing low from December, respectively. Further down is the all important 50-Day MA at 2.05.
Weekly Bearish Candlestick Pattern
In addition, last week ended with a bearish shooting star weekly candlestick pattern. It triggered this week briefly but quickly recovered. A second decline below last week’s low of 2.49 may not be so forgiving. Of course, that level should be used along with the other price support levels noted above.
Upside Breakout Starts Above
Notice that the second top from yesterday 2.85 was lower than the first at 292 and tracked resistance around the top declining trendline with a lower high. A decisive rally above Wednesday’s high will provide a sign of strengthening and increases the chance for a retest of resistance around the trendline. Of course, that would also open the door to a possible breakout above the line. Once that occurs last week’s top is at risk of being broken to the upside. That would trigger a continuation of the developing rising trend as well.
Read Full Story »»»
DiscoverGold
Punching Bowl. The Energy Report
By: Phil Flynn | May 30, 2024
Take away the punch bowl just as the party is getting started! Fed Officials did not like the Memorial Day price explosion in the commodity complex and did their best to cool off expectations by threatening an interest rate hike to spoil the party. Minneapolis Fed President Neel Kashkari put it best when he said yesterday that, ”Interest-rate hikes aren’t out of the question” and added “If we get surprised by the data, then we would do what we need to do” like whatever it takes, I guess. We know that Neel and his colleagues continually get surprised by data quite often, so the markets retreated.
Even oil, after what most would say was somewhat bullish data from the American Petroleum Institute, seems to have lost the demand driven momentum that started this new week. The API seemed to make up for lost time with a whopping 6.490-million-barrel crude oil draw that was led by a long-awaited 1.706 million barrel drop from the Cushing OK delivery point. That came on the backs of reports of record demand for air travel as TSA reported an all-time high number of passengers at US checkpoints and automobile travel and farmer demand from planting over the weekend. Corn planting that was way behind caught up with 83% planted as of May 26, 2024, just ahead of the 5yr average of 82%.
Surprisingly, we saw a 2.45-million-barrel increase in distillate inventories even with all that demand. That raised some eyebrows about the overall data.
Gasoline inventories came in pretty much in line with expectations, dropping about 452,000 barrels last week.
Now today, because of the holiday, we will see the inventory numbers at 10:00a central time from the Energy Information Administration (EIA). I expect that if the EIA shows similar data. At the end of the day, the markets should shake off their concerns about what the Federal Reserve may or may not do when it comes to interest rates. The reason why I believe that is more than likely is that a large crude drawdown in supply could be the first of many in the coming weeks.
The market will also look at gasoline demand very closely to see if the momentum that we saw in last week’s report continues. Crack spreads have been relatively weak for gasoline.
Oil may also garner some support from OPEC Plus their favorite co-conspirator Russia. The word on the street is at the cartel is debating about prolonging the oil supply cuts amid rising global oil inventories. It seems like the cartel is concerned that we saw some crude builds here in the United States which was a bit of a surprise. Also, there is more talk about commitment by OPEC cheaters to offer compensation cuts for their overproduction. Saudi Arabia is leading the cartel and is continuing to curtail their oil production. JODI said that Saudi Arabia’s crude production fell by 38 kb/d in March to 8.97 mb/d while its crude exports rose by 96 kb/d to 6.41 mb/d.
Geopolitical risk factors for oil continue to simmer in the background. Another disturbing story about the possibility of escalation in the Russia Ukraine conflict is making many people cringe, raising the possibility that the US could be drawn into a more active role in the conflict. Not only did the Biden administration consider sending U.S. military advisers to train Ukrainian troops in Ukraine, not dissimilar to how we sent advisers to Viet Nam. Now there’s reports that US Secretary of State Anthony Blinken suggested that the US might allow Ukraine to use American made weapons for strikes inside of Russia. That would be a dangerous policy shift and would raise the stakes and the possibility of the war growing beyond the current battlegrounds. It also increases that the odds that the college students protesting against Israel might have to change to protesting stopping the draft because that could be next if things keep going the way they’re going with this administration.
Now don’t tell Joe Biden the fossil fuels may be with us a lot longer than people think. It might make him start screaming again. Yet in the energy space guys like Warren Buffett are really betting on long term oil which place like Occidental, and we continue to see mega deals in the energy space. The Wall Street Journal reports that, “ConocoPhillips COP -3.12%decrease; red down pointing triangle has agreed to acquire Marathon Oil MRO 8.43%increase; green up pointing triangle in an all-stock deal valued at $17.1 billion in a bid to catch up with rivals as drillers race to secure new oil and gas wells. Under the terms of the agreement, Marathon Oil stockholders will exchange each share for 0.255 shares of ConocoPhillips, representing a nearly 15% premium based on Marathon Oil’s closing share price on Tuesday. The deal allows ConocoPhillips to expand its presence in several key U.S. shale basins including in Texas and North Dakota.
For the entire oil complex, we are looking to see demand numbers start to turn up. The reason why the market is conflicted and caught in a trading range is because they are not sure that they should focus on current fundamentals or what may happen with demand if the Fed decides to increase interest rates. From my perspective I think it’s unlikely that the Federal Reserve will be able to raise interest rates especially with an election ahead. The flipping back and forth on rate expectations is keeping the oil market subdued.
If demand starts to perk up in the US, China and India, which it looks like it’s going to do, then I think that we are very close to the bottom. Reuters is reporting that, “Asia’s imports of crude oil rose to the highest in 12 months in May, with the strength being driven by India as the region’s second-biggest buyer is on track to see record arrivals. The world’s top crude importing region is expected to have arrivals of 27.81 million barrels per day (bpd), up from 26.89 million bpd in April, according to data compiled by LSEG Oil Research. That’s an increase of 920,000 bpd month-on-month, with the bulk of the gain being accounted for by India, where imports are expected to rise to an all-time high of 5.26 million bpd, up 710,000 bpd from April’s 4.55 million bpd.
The other deal with traders is keeping an eye on is Saudi Arabia’s further listing of shares to own a part of Saudi Aramco. Rumors have the listing at the value of the listing is estimated to be around $10-$11 billion.
Amena Bakr is reporting that the announcement for the Aramco listing is likely to happen today after the market closes- sources familiar with the matter are telling her.
Once again hedgers probably should use this dip to put on some longer-term positions, we really expect to see a big surge in prices at some point later in the year.
Natural gas prices pulled back after the incredible comeback. The key today will be the report that will be released on time at 9:30 central Standard Time. Reuters is reporting that US utilities added a smaller than usual 78 billion cubic feet of natural gas and this storage last week as low prices earlier this year controllers to cut output. The 78 billion cubic feet injection compares with an injection of 106 BCF during the same week a year ago and average of 104 BCF in recent weeks the market has been surprised by this number and has been a catalyst for the market to move higher if once again this number comes out on the bullish side of the equation, we would expect natural gas to make new highs for the move.
Long term the demand outlook for natural gas looks strong from the liquified natural gas front as well as power generation. In the United States we still must keep in mind that we’re heading into hurricane season and that could impact natural gas demand either positively or negatively, depending on when and if these storms hit and where they hit.
Gas output in the Lower 48 U.S. states fell to an average of 97.7 billion cubic feet per day (bcfd) so far in May, down from 98.2 bcfd in April, according to financial firm LSEG. That compares with a monthly record of 105.5 bcfd in December 2023. There were 63 total degree days (TDDs) last week compared with a 30-year normal of 63 for the period, according to data from financial firm LSEG. TDDs measure the number of degrees a day’s average temperature is above or below 65 degrees Fahrenheit (18 degrees Celsius) to estimate demand to cool or heat homes and businesses.
Food inflation has been a big issue and cattle prices are probably going to continue to break record highs. Yet cattle fell on a report that China was blocking US beef shipments from the JPS meat plant in Greeley Co. The reason why is China blocked the beef shipments because they identified traces of a feed additive called Ractopamine which has been approved for use in the United States but not in China or in the European Union for that matter.
Read Full Story »»»
DiscoverGold
Aluminum hits highest price in almost 2 years
By: Barchart | May 29, 2024
• Aluminum hits highest price in almost 2 years.

Read Full Story »»»
DiscoverGold
Agriculture Master Report
By: Bill Moore | May 29, 2024
JULY WHT

Black Sea weather woes continue to plague the July Wheat – so far driving it up $1.70 (5.50-7.20)! Last night, the mkt opened 20 higher but couldn’t hold the gains – finishing only 3 cents higher! Maybe, an indication the weather mkt is losing some steam! When the mkt can no longer advance off dry, frosty forecasts from South Russia, a temporary top will be confirmed! But still supplies have been diminished & the US Southwest Plains continue to have issues! And Russia’s export dominance may be coming to an end!
JULY BEANS

Since May 1, July Beans have rallied an impressive $1.00 (1155-1255)! But with no export business yet from China this season, the upside is limited for now! Domestic demand however has been strong! Beans are 68% in (avg -63)! Higher energies & a lower US Dollar have supported! Now, that the crop is nearly planted, weekly crop condition reports will be paramount! And the mkt is $2.00 cheaper than last summer – which could pave the way for improved exports for June-Sept!
JULY CORN

July Corn is caught in the middle being pushed up by a surging July Wht & pulled down by a slumping July Beans! However, on its own, it has a very positive fundamental picture with exports running 35% over 2023! And it’s $1.70 cheaper than a year ago! Both Brazilian & Ukranian corn estimates have been lowered! Corn is 83% planted (avg – 82) with demand surging, there is “no margin for error” for the 2024 US Crop!
JUNE CAT

June Cat was the major beneficiary of Memorial Day Weekend beef demand last week driving it nearly to its contract highs! But now that’s over & bird flu demand fears still linger! The mkt may well consolidate for a while! The Cattle-on-Feed Report last Friday was neutral with placements at 95% – as expected! And the net long of managed money traders is about half of what it was last Fall! The mkt will need new upside fuel to challenge the March contract highs!
JUNE HOGS

The monthly Cold Storage Report issued last Friday at 2pm laid some more negative news on the Hog Mkt that doesn’t need any more indeed! Frozen pork in cold storage increased to 501 million pounds from 463 mp last month! The mkt also broke thru two levels that could have supported – the 200 day moving average & the 61% retracement on the plus side, the net fund longs have decreased to half of what they were! Finally, the disparity between pork & beef prices has widened appreciably in the past month – which should favor an increase in pork demand in the supermarket!
Read Full Story »»»
DiscoverGold
The Corn & Ethanol Report
By: Daniel Flynn | May 29, 2024
We kickoff the day with MBA 30-Year Mortgage Rate, MBA Mortgage Applications, MBA Mortgage Market Index, MBA Mortgage Refinance Index, and MBA Purchase Index at 6:00 A.M., Redbook YoY at 7:55 A.M. Richmond Fed Manufacturing Index, Richmond Fed Manufacturing Shipments Index, and Richmond Fed Services Index at 9:00 A.M., Dallas Fed Services Index and Dallas Fed Services Revenues Index at 9:30A.M., 17-Week Bill Auction and 2-Yesr FRN Auction at 10:30 A.M., 7-Year Note Auction at 12:00 P.M., Fed Williams Speech at 12:45 P.M., Fed Beige Book at 1:00 P.M., API Energy Stocks at 3:30 P.M., and Fed Bostic Speech at 6:00 P.m.
Global corn markets ended weak as Argentine fob offers become more aggressive and the threat of late seeding dates in the US has come and gone. The US crop on Sunday was 83% planted vs. 82% on average and Ag Resources (ARC) expects the crop to be fully seeded within the next week. The absence of drought and coming rainfall in key areas of Kansas bode favorably for early-season crop health/ratings- which will be published next Monday at 3:00 P.M. 70% + Of the crop will be rated as good-to-excellent – a favorable start. US demand expansion lingers in the backround as drought in Mexico worsens and as a new threat emerges in Ukraine if warmth & dryness extends into summer. But wide-swinging price trend is forecast nearby. Us corn stocks contraction/enlarged export demand is a crop year phenomenon. N Hemisphere weather dominates daily action nearby. A trading bottom should form in corn early next week with the release of the season’s 1st Crop Condition rating.
On the economic front, a better than expected Consumer Confidence data released yesterday was better than expected , and hard to believe, also Fed Kashkari hinted another rate hike is possible, but could the banks sustain it? He initially said he wants to see significant improvement in the economy before the Fed will even think of cutting rates. Well Stop Printing Money! The Federal Housing Finance Agency reported that the average price for a single-family home with a mortgage guaranteed by Fannie Mae or Freddie Mac rose by 0.1% in March and was 6.7% higher than a year ago. The FHFA Housing Price Index rose to a record high of 423.42, marking the 145th consecutive month of year-over-year gains. Last weeks Mortgage Bankers Association report showed that the average mortgage rate remains above 7%, which has kept mortgage demand suppressed and near 27-year lows. Consumers are unwilling to give up their low-rate mortgages to chase rising house prices.
Read Full Story »»»
DiscoverGold
Can’t Keep Them Down. The Energy Report
By: Phil Flynn | May 29, 2024
Despite some of the most challenging inflationary conditions in many Americans lifetime, it seems you cannot keep that American Spirit of adventure down. Oil markets are coming back from a big uptick in US consumer confidence that surged to 102% according to the Conference Board. That was accentuated by a record amount of air travelers and a surge in gasoline demand from the USA, the world’s leader in travel. A report the from the UN World Tourism Organization that said that the US regained that title from China. OPEC Plus will at the very least reaffirm voluntary cuts with the outside of and extension and perhaps announcement of compensation cuts.
Oh, sure we saw a report from the International Monetary Fund that raised their forecast for China economic growth to 5% from 4.6% which today if offsetting concerns about Chinese oil demand. The market has been disappointed with reduced refinery runs in China for plastics production and their manufacturing, but domestic demand remains strong. The IMF suggested that that China’s economy has exceeded their expectations and now with China’s biggest cities rolling out major easing of conditions for homebuyers, that could support the economy even more not to mention more oil demand as well.
Now if we look to India there are more reports and suggestions that India’s demand for oil and natural gas are going to absolutely surge in the coming months and years. S&P global raised its outlook for India’s economy to positive from stable and this of course means that their growing appetite for oil and natural gas is going to grow. That will create a very tight global market later in the year and price might not matter.
Petroleum Economist says that even with oil surges to over $100 a barrel, it’s possible that India’s oil demand will continue to grow. The Petroleum Economist is saying that India is expected to register steady growth in crude oil consumption during 2024 given its ability to shrug off relatively high prices.
Analysts and officials believe prices would need to rise significantly and for a sustained period of time to start really hurting demand. The data so far this year backs up this assertation: there has already been solid growth in demand for crude oil and finished products during the first four months of the year despite prices being well above $80/bl.
There seems little to fear in terms of demand destruction. From January to April, India’s appetite for oil has barely been quelled. Consumption increased by 4.8% during that time compared with the same period. And it is not just oil. It is India’s demand for natural gas. Reuters is reporting India’s natural gas demand will surge 7% on stronger demand industrial demand fertilizer.
Side issues that seem to be supporting are reports that the Buzzard oil field in the North Sea is experiencing a temporary production outage that will reduce oil production maybe by as much as 60,000 barrels of oil a day.
Political risk factors are also rising and inexplicably there are reports that the Biden administration is standing up for Iran and their nuclear program. It’s almost as if like the Biden administration wants Iran to get nuclear weapons. The New York Post reports that, “The White House is begging Britain and France not to formally rebuke Iran over the theocracy’s growing nuclear program. Administration officials have been pressuring the US allies and other European nations to vote against censuring Iran at a meeting of the International Atomic Energy Agency’s (IAEA) board of governors next month, diplomats close to the discussions told the Wall Street Journal.” The US is also preparing to abstain from the IAEA vote, the diplomats added, with some suggesting censure could further destabilize Iran following the death of its president, Ebrahim Raisi, in a May 19 helicopter crash.” If I were the Biden administration, I wouldn’t worry about that. I think Iran could use a little destabilizing myself. Then they maybe they couldn’t use their increasing oil revenue that has exploded under the Biden administration to fund terror groups like Hamas, Hezbollah and the Houthi rebels who attacked more ships in international waters.
The other concern of course for oil and natural gas is going to be the weather. Hurricane season is starting and already the National Hurricane Center has its eye on the potential of the developments of storms as we start the hurricane season June 1st. Yesterday the National Hurricane Center was monitoring three tropical waves, yet they do not seem to be developing into anything yet. Weather in the Atlantic is very conducive for the possibility of an early start to the hurricane season. We’ve already seen the weather conditions cause havoc with the slew of tornadoes.
Fox Weather is reporting that powerful thunderstorms rocked the Dallas-Fort Worth Metroplex on Tuesday, leaving more than 800,000 utility customers in the dark as severe weather barreled across the region and produced baseball-sized hail, hurricane-force wind gusts and significant damage in several communities.
If your power is out, can you change your electric car? Anas Alhajji give us an electric car update by pointing out that Toyota EV sales increased in Q1 by a whopping 86% year over year!!! That 86% = 1,617 cars! Whoopee! At that rate maybe the Biden administration’s billion-dollar car charger can actually meet that type of demand.
Read Full Story »»»
DiscoverGold
Natural Gas Likely Test of Resistance Before Return to Key Support Levels
By: Bruce Powers | May 28, 2024
• Natural gas is expected to retrace and consolidate after a 92% advance, with key support at the 200-Day MA around 2.46.
Key support for natural gas remains around the 200-Day MA at 2.46. It has been bouncing from that price area following a pullback low of 2.475. Given the sharp 92% advance that culminated with last week’s high of 2.92, natural gas is due for a period of retracement and consolidation. It looks like it has started.
If correct, the advance off the area around 200-Day MA will eventually be met with resistance that turns the price of natural gas back down to retest support around the 200-Day line, and possibly fall below it. Certainly, given recent volatility a drop through the 200-Day MA, even if it is brief, would not be a surprise.

Bounce Into Resistance
Areas to watch for resistance during a bounce includes a price zone from 2.61 to 2.63. That zone encompasses support seen on two different days out of the previous three. Friday’s low provides the 2.63 price level. If natural gas can close above Friday’s 2.71 high, it may have a chance to test recent highs. Otherwise, the expectation is for resistance to be seen on the bounce, followed by a deeper pullback or at least a retest of the 200-Day line.
Potential Bearish Weekly Candle Remains
As noted yesterday, last week natural gas completed a bearish shooting star candlestick pattern and ended near the lows of the week’s trading range. It is matched by the 50-Week MA, currently at 2.50. Therefore, the 200-Day line on the daily chart also represents the 50-Week MA. Since they are together, this week’s low of 2.475 takes on greater significance as the breakdown below it indicates a failure of two long-term moving averages to hold as support. A daily close below 2.475 will confirm the breakdown and increase the chance for an eventual test of lower price levels.
Lower Price Levels
The first lower price area to watch is around the 20-Day MA at 2.73. That moving average is a key trend indicator for the current sharp trend. It has not yet been tested as support since a gap above it on April 26. Therefore, it is due to happen. Keep in mind that the line is rising, and the price represented by the line when approached may change. Below the 200-Day line is a prior interim swing low 2.31. But the 50% retracement at 2.25, along with a more significant swing low of 2.235 from December 2023, have identified a similar price zone.
Read Full Story »»»
DiscoverGold
Weather Takes Main Stage. The Corn & Ethanol Report
By: Daniel Flynn | May 28, 2024
We kickoff the day with S&P/Case-Shiller Home Price Index MoM & YoY, House Price Index, and House Price Index MoM & YoY at 8:00 A.M., Fed Kashkari Speech at 8:55 A.M., CB Consumer Confidence at 9:00 A.M., Dallas Fed Manufacturing Index at 9:30 A.M., Export Inspections at 10:00 A.M., 2-Year Note Auction, 3-Month Bill Auction, 42-Day Bill Auction, and 6-Month Bill Auction at 10:30 A.M., 5-Year Note Auction and Money Supply at 12:00 P.M., Fed Cook & Fed Daly Speech at 12:05, and Crop Progress at 3:00 P.M.
We start off the short week with US weather a key and forecasts call for mostly dry in the Midwest with showers targeting the Plains in a much-needed mode from recent dryness for crops. The rain starts across Texas today along with more tornadoes with showers spreading northward into Nebraska by Wednesday. The entire Plains look to receive 1-2.50” of rain with localized areas picking up as much as 3-4.00”. The Central Plains rain will be the best in months and help summer row crop yield potential. Unlike recent years, the Plain’s rain provides a boost in soil moisture that favors crop yield. After today the West Midwest will not see rain until late Thursday which spreads eastward into the weekend. Spring seeding will advance near completion with soil moisture in its best levels since 2019. The overall pattern features shower chances every 4-5 days with near normal temperatures. The 2-Week Central US weather forecast leans favorable into mid-June.
The grains came in mixed with wheat futures pushed to new rally highs following Monday’s strong EU wheat rally in Paris. Russian wheat crop estimates are in decline and shower chances in the coming 10-days are not particularly good. A few lite showers are possible late this week, but the budding heat/dryness will tag Russian wheat and Ukraine corn crop estimates downwards. CBOT wheat values are adding weather premium to price accordingly. This is only showing little support in the corn following this weather news. Soybean and meal are lower on potential US soybean seeding expansion and a good start to the Central US growing season. And the political divide between the US/China is widening as both push for global economic supremacy. Soybean rallies will be labored on tepid Chinese demand.
Read Full Story »»»
DiscoverGold
Off With a Bang. The Energy Report
By: Phil Flynn | May 28, 2024
The summer travel season started off with a bang. Energy markets, at least for the moment, decided to quit worrying about what the Fed may or may not do with interest rates and decided to focus on supply and demand. Oil and products are rising with increased oil and product demand expectation, rising geopolitical risk, as well as another drop the US rig count. Gasoline demand surged back of 9 million barrels a day according to EIA last week and evidence suggests that for at least the start of summer, demand might live up to lofty expectations even as bad weather put a damper on many beach plans along the Northeast over Memorial Day. AAA did predict demand for petroleum might have hit a 20 year high for this past weekend as Americans took planes, trains and automobiles.
The U.S. Transportation Security Administration (TSA) got the holiday oil buying party started after they said they screened 2.95 million airline passengers on Friday, the highest number ever on a single day. The record travel coincides with the Memorial Day weekend that marks the beginning of the U.S. summer travel season. Last week, a group representing major U.S. airlines forecast record summer travel with airlines expected to transport 271 million passengers, up 6.3% from last year. That means, more than likely, strong jet fuel demand will continue. Last week the EIA put jet fuel demand up 3.6% compared with the same four-week period last year according to Reuters.
We also have a report about oil demand in China rising by 1.3 million barrels a day in March according to JODI. While that was down year over year that is still very strong, but this may be one reason why Saudi Arabia is lowering the cost of oil to Asia for the first time in five months. The July official selling price (OSP) for flagship Arab Light crude is expected to fall by 30 to 50 cents a barrel, a Reuters survey of five refiners showed, after hitting a five-month high in June. Normally the market would take this as a negative but so far, not. It’s very possible that Saudi Arabia’s move is to regain market share, but they have given up after raising prices in the last couple of months to places like Russia.
Which leads us to the upcoming all-important June 2nd OPEC Plus meeting. As you might remember, after it was announced that the meeting went from an in-person meeting in the beautiful hotels of Vienna to an online meeting, oil traders went short on the assumption that the status quo was going to stay in place until the end of the year and there would be no surprises. So, the market expectations are that OPEC plus would do something dramatic were dampened. Now there’s growing optimism that we may get commitments from OPEC cheaters to extend their production cuts past 2025 to make up for previous cheating. Amena Bakr says that the expectation is that the 8 states that offered voluntary cuts will extend them, with a possibility of further action to support the market.
Some people were concerned about the boasts by Iraq that they planned to increase their oil production capacity to over 4 million barrels a day. That’s a negative but that is a problem for another day and not at this OPEC meeting.
The Biden administration has been a big boost for Iran’s oil production. Energy Tidbits pointed out that, “Today Iran, interim president, Mohammad Mokhber, that took over after the death of Ebrahim Raisi said that one of the greatest achievements of his predecessor was increasing Iranian oil production to 3.6 million barrels a day. He is also now bragging that Iran will hit a production level of four million barrels a day shortly.
Geopolitical risk factors for oil remain high yet the market isn’t adjusting for it because so far there’s been no major disruptions to supply. Even more attacks by the Houthi Rebels on shipping over the weekend failed to move the needle.
Over the weekend, exchange of fire between Israel and Egypt made the headlines. The Wall Street Journal reported that, “Biden is facing fresh political tension at home following an Israeli airstrike on Rafah that Palestinian authorities said killed dozens of civilians. Israel said the strike killed two top Hamas officials, but Palestinian authorities said it also led to the deaths of at least 45 Palestinian civilians and wounded others, including women and children. Israeli Prime Minister Benjamin Netanyahu called the civilian deaths a “tragic mistake” and promised to investigate.
China is calling out the United States and our support for Taiwan independence. After completing war games near Taiwan with live ammunition, China is signaling that they’re getting closer to a possible confrontation. Fox Business reported that Taiwan’s opposition-controlled legislature passed changes that favor China and reduce the power of the island’s president. The changes, pushed by the opposition Nationalist Party, give the legislature greater power to control budgets, including defense spending. The Nationalist Party, which supports unification with China, took control of the legislature with a single-seat majority after the January elections.
Bloomberg reported that, “Iran increased its stockpile of near bomb-grade uranium, a move that could flame tensions across the wider Middle East as Tehran prepares to hold presidential elections next month.
It’s the first nuclear-safeguards assessment since Iran’s president and foreign minister died in a helicopter crash just days after top officials from the United Nations’ atomic watchdog traveled to the country to secure greater cooperation in their monitoring efforts. International Atomic Energy Agency inspectors verified on Monday that Iran’s stockpile of highly enriched uranium rose 17% over the last three months, according to a nine-page, restricted report circulated among diplomats and seen by Bloomberg. That’s enough uranium to fuel several warheads should Iran make a political decision to pursue weapons.”
Bloomberg also touted over the weekend that wind and solar is going to boost US power plant capacity by 80% by the year 2035. Yet Art Berman, noted oil analyst, reacted and pointed out that we have to put that in perspective and pointed out renewables will then account for 2.2% of US energy consumption delivered. So, the death of fossil fuels consumption has been greatly exaggerated. Investment dollars that were turning away from oil and gas are starting to creep back in because reality sometimes is better than the alternative.
Natural gas is back on the rise as crazy weather over the Memorial Day weekend and the beginning of what could be a very interesting summer. Not only is the market looking ahead to near term forecasts that are calling for above normal temperatures in many parts of the country, we are also getting warnings from many private forecasters of a very active hurricane season. Suddenly, the natural gas market is starting to look a little bit better even though we still have some oversupply. Rig Zone reported that North America added two rigs week on week, according to Baker Hughes’ latest rotary rig count, which was published on May 24. Although the U.S. lost four rigs week on week, Canada added six during the same period, leading to a total North America rig count of 720, comprising 600 rigs from the U.S. and 120 rigs from Canada, the count outlined.
Of the total U.S. rig count of 600, 579 are classified as land rigs and 21 are classified as offshore rigs. The total U.S. rig count comprises 497 oil rigs, 99 gas rigs, and four miscellaneous rigs, the count showed. Horizontal rigs made up 537 of the total U.S. rig count, directional rigs made up 43, and vertical rigs made up 20, Baker Hughes revealed. Week on week, the U.S. added one offshore rig and dropped five land rigs, Baker Hughes’ count outlined. The country cut four gas rigs and eight horizontal rigs, and added two directional and two vertical rigs, week on week, the count showed.
Read Full Story »»»
DiscoverGold
Natural Gas Tests 200-Day MA Support After Strong Rally
By: Bruce Powers | May 27, 2024
• After a 92.1% rally, natural gas approaches the 200-Day MA at 2.46, indicating a potential correction phase and testing critical support levels.
Natural gas further flirts with potential support around the 200-Day MA, currently at 2.46, as the low for the day was 2.475. The 200-Day MA is an obvious area to test for support as this is the first time that it has been approached since the bullish breakout of the line on May 16. It is common for the first test of a moving average as support frequently sees signs of support. However, natural gas is correcting from a strong advance that completed a 1.40 point or 92.1% rally in 13 weeks.
That is an aggressive advance that exceeds all prior rallies since the 10.03 peak in 2022. It has been overdue for a correction and has more than likely only just begun a retracement or consolidation phase. So, the behavior of natural gas around the 200-Day line is important for the short-term as the reaction should provide clues as to what might come next.

Weekly Chart Looks Bearish
Moreover, the weekly chart needs to be considered. Last week ended with a bearish wide ranged red shooting star candlestick pattern with the closing price essentially the low of the week. That low stopped at support seen at the 50-Week MA. Currently, the 50-Week MA is at 2.50. It was broken to the downside briefly today to reach a low of 2.475 before there was a minor intraday bounce.
Since both the 200-Day MA and 50-Day MA identify a similar potential support zone from 2.50 to 2.46, it may have added significance. Nevertheless, a decisive drop through 2.46 has natural gas heading first towards the 20-Day MA at 2.37 followed by a prior interim swing low at 2.31. A more likely lower price target though looks to be around 2.25 to 2.23. That zone is derived from the 50% retracement and a previous swing low from December 13.

Correction May Just Be Getting Started
Natural gas has been tracing out a declining trend channel that is shown on the chart with dashed declining blue trendlines. Since it hit the top of the channel last week and rejecting price to the downside, the lower area of the channel becomes a potential target. Also, if the 20-Day MA fails to retain support and natural gas drops below it and stays below it, the 50-Day MA at 2.01 becomes a target. It is a match with the prior top of the symmetrical triangle bottom pattern.
Read Full Story »»»
DiscoverGold
The Unstoppable Orange Juice hit a new all-time high and has now traded green in 13 of the last 14 days
By: Barchart | May 25, 2024
• The Unstoppable Orange Juice hit a new all-time high and has now traded green in 13 of the last 14 days.

Read Full Story »»»
DiscoverGold
Butter hits highest price since November
By: Barchart | May 25, 2024
• Butter hits highest price since November.

Read Full Story »»»
DiscoverGold
Commodities Daily Market Movers (% Price Change)
By: Marty Armstrong | May 25, 2024
• Top Movers
Soybean Meal CBT Futures 2.6 %
Cocoa (NYCSCE) Futures 2.28 %
Orange Juice (NYCE) Futures 2.14 %
London Aluminum Spot 1.75 %
Oats (CBOT) Futures 1.68 %
• Bottom Movers
NY Natural Gas Futures 5.13 %
Palm Kernel Oil 2.92 %
AU - Victoria Base-Load Electricity Futures 2.61 %
Cotton #2 (NYCE) Futures 1.47 %
Lumber (CME) Futures 1.21 %
*Close from the last completed Daily
DiscoverGold
Today's Futures Heat Map • Strongest: Bitcoin Futures, Soybean Meal, Cocoa
By: Barchart | May 24, 2024
• Today's Futures Heat Map
Strongest: Bitcoin Futures, Soybean Meal, Cocoa
Weakest: Natural Gas, Lumber, Cotton

Read Full Story »»»
DiscoverGold
Natural Gas Faces 200-Day MA Test at 2.46
By: Bruce Powers | May 24, 2024
• Following a significant rally, natural gas starts a retracement, with key support levels at the 200-Day and 20-Day MAs in focus.
Natural gas fell to a five-day low of 2.51 today and it continues to trade near the lows of the day at the time of this writing. It looks to be heading next towards the first test of support around the 200-Day MA since a bullish breakout of the line last Thursday. Today’s bearish continuation follows yesterday’s new trend high of 2.92 and subsequent weak close. That high completed a 92.1 % advance from the February swing low at 1.52. The RSI momentum oscillator is also showing weakness as it turned down from the most overbought reading since the peak of a long-term uptrend in 2022.

Declining Trend Channel Identifies a Price Range
Since April 26 natural gas has been trading within a declining parallel trend channel defined on the chart with two blue dashed line. Clearly price was rejected to the downside near the top line yesterday. That was the third touch for the top trendline. Given the recent sharp rally it would be normal for natural gas to spend some time in retracement or consolidation. When considering the declining channel, once the top is hit there is the potential for the bottom channel line to be tested as support. This doesn’t mean it will happen, but it does increase the possibility that a correction could take some time.
Correction to Strong Advance Could See Lower Support Levels
If the 200-Day MA is broken to the downside, the 20-Day MA becomes the next target. It is currently at 2.35 and should be considered along with the 2.31 interim swing low from January 22. A little lower is the 50% retracement at 2.25, along with the 2.23 swing low from December. That swing low is potentially more significant than the January low as it was a sustained bottom.
The 61.8% Fibonacci retracement is at 2.095, followed by the orange 50-Day MA at 1.99 currently. It is approximately 32% below yesterday’s high. Since the rally was fast, the price of natural gas reached an extreme level relative to the 50-Day line. Strong swings in one direction can frequently lead to a strong reaction in the opposite direction.
Read Full Story »»»
DiscoverGold
US Economics Continue To Flounder. The Corn & Ethanol Report
By: Daniel Flynn | May 24, 2024
We kickoff the day with Durable Goods Orders MoM, Durable Goods Orders Ex Transportation MoM, Durable Goods Orders Ex Transportation MoM, Durable Goods Orders ex Defense MoM, and Non Defense Goods Orders Ex Air at 7:30 A.M., Fed Waller Speech at 8:35 A.M. Michigan Consumer Sentiment Final, Michigan 5-Year Inflation Expectations Final, Michigan Consumer Expectations Final, Michigan Current Conditions Final, and Michigan Inflation Expectations Final at 9:00 A.M., Baker Hughes Oil & Total Rig Count at 12:00 P.M., Cattle On Feed, and Cold Storage at 2:00 P.M.
The Census Bureau reported that US sales of single-family homes in April fell 4.7% from March and were down 6.6% year-over-year. This was the first year-over-year decline in sales since March 2023. Rising new home sales had been partially offsetting the decline in existing home sales, which fell 2% from last year in April and have been negative for 33 consecutive months. Total home sales bottomed out in November and were unchanged or higher through February but were negative in March and April. Note that the February seasonal high was still 3% less than a year ago. Increasingly, the odds of Fed interest rate cuts are diminishing, and home sales volumes are expected to fall without sub-5% mortgage rates.
Soybeans gave back a portion of Wednesday’s gain, closing 7 cents lower in the old crop and 2 cents lower in the new crop. Soybean oil led the fall after testing the 50-day moving average. Traders were unsettled by China’s complete surrounding of Taiwan by military drills as Taiwan installed it’s new pro-independence president. US weekly soybean oil exports set a marketing year high of 45.5 Mil Lbs., while sales marked net cancellations of 2.3 Mil Lbs., following 4 weeks of sales that totaled just over 97 Mil Lbs. The US picked up export business in the last month as US prices converge with the world market. US soybean oil is within 1-2 cents of South America offers and 2-4 cents of palm oil quotes. This compares to premiums that were as wide as 30-35 cents last August. Traders will closely follow Chinese military drills around Taiwan heading into the 3-day holiday weekend. At the moment were looking to sell strong rallies in this holiday market. CBOT corn ended higher following wheat values an as the market has one eye on the duration of heat and dryness in the Ukraine. This is also Black Sea primary corn producing region. Low volume in corn, wheat, and soybean futures are hovering on either side of unchanged as traders prepare for the holiday weekend. Geopolitical events and world weather forecasts will direct CBOT prices as traders return next Tuesday. Traders will cut their market exposure accordingly.
Read Full Story »»»
DiscoverGold
Ceasefired Up. The Energy Report
By: Phil Flynn | May 24, 2024
Oil prices retreated yesterday along with a big sell off in the stock market as concerns about inflation and rising interest rates put it damper on most of the markets. Today, believe it or not, the market is getting some pressure from a Reuters report that Vladimir Putin is looking for a ceasefire in Ukraine. According to a Reuters report Russian President Vladimir Putin is ready to halt the war in Ukraine with a negotiated ceasefire that recognizes the current battlefield lines.
At the same time, he is saying he is prepared to fight if Kiev in the West does not respond.
The interesting thing here is that when you look at the war in Ukraine the Biden administration has a lot invested in this War. Early in the war the Biden Administration advised Ukraine not to agree to a ceasefire deal with Russia.
President Biden seemed to welcome the “minor incursion” into Ukraine by Russia and then later backed off that statement, yet it seemed almost to welcome the conflict between Russia and Ukraine.
Now he has the military industrial complex humming with massive amounts of American Taxpayer money flowing to Ukraine. Because of that ignominious start to the war, it would be interesting to see if the Biden administration would be open to the olive branch that the Russian President is offering.
Many members of the Biden administration of course have demonized Russian President Vladimir Putin even before the Russian Ukraine war, rightly or wrongly. Many members of Biden administration helped perpetuate the myth that the Trump administration had in some way colluded with Putin and Russia to discredit the sitting president of the United States.
We know that the Russian investigation into the Trump campaign was started by the Hillary Clinton campaign with a fake dossier.
We know now that the FBI that broke the law in securing FISA warrants against American citizens.
This was a very dark time in American history where the rule of law became a joke as corrupt players in the FBI and the CIA decided to take it upon themselves to try to unseat sitting U.S. President. They spat on the constitution and bright shame on themselves and the institutions that they were supposed to serve.
I’s clear that the Biden administration has a lot invested in the war in Ukraine. Not only did his son Hunter have business dealings in Ukraine, working for the natural gas company Burisma Holdings. Then Vice President leveraged $1 billion in aid to persuade Ukraine to fire its top prosecutor, Viktor Shokin, in March 2016.” In 2012, the Ukrainian prosecutor general Viktor Pshonka began investigating Ukrainian oligarch Mykola Zlochevsky, owner of the natural gas company Burisma Holdings, over allegations of money laundering, tax evasion, and corruption during 2010–2012. In 2015, Shokin became the prosecutor general, inheriting the investigation. Then will Hunter Biden was getting paid the Vice President got Ukraine to fire Ponoka.
Biden administration is also used the war in Ukraine as an excuse for increasing inflation and rising oil and gas prices. This has been a convenient excuse, almost as convenient as being able to use US taxpayers’ dollars to influence a country to fire a prosecutor investigating the company that you’re Son is getting paid by.
From a technical point the market just doesn’t seem to have a lot downside but the negativity about demand expectations and the course of interest rates is keeping the market in a range.
AAA says that “The national average for a gallon of gasoline wobbled slightly since last Thursday before settling one cent higher at $3.61
“The lack of pump price movement is typical in the days leading up to Memorial Day. However, with AAA forecasting a record 38.4 million drivers hitting the road for the long weekend, the price needle could point a bit higher, at least temporarily. “
Yet Trilby Lundburg on the Lundberg Survey the granddaddy of all gasoline price reporting and the inventor of that industry questioning that prediction. Berg better preceded AAA’s price reporting on gasoline and even did it before the US government started to cover it.
Lundgurg writes that “AAA’s holiday car travel projections have been high versus actual gasoline demand by a factor of ten on average according to our study. The AAA forecasts are widely reported by media as gospel without anyone asking about the historic track record. This report examines 14 years of AAA forecasts versus gasoline demand and finds some shocking results. Lundberg writes that “the AAA press release states quote we haven’t seen Memorial Day weekend travel numbers like these in almost 20 years” said Paula Twidale, senior vice president of a travel. “We are projecting an additional 1,000,000 travelers this holiday weekend compared to 2019 which not only means were exceeding pre pandemic levels but also signals a very busy summer travel season ahead.”
What’s more AAA says Rd. travel will hit a new record high: “road trips are expected to set a record AAAA projects 38.4 million people will travel by car over the Memorial Day weekend the highest number for that holiday since AAA began tracking this in the year 2000.
Lundberg did an extensive study of a AAA holiday predictions over the years concluded that they have really been overestimating these travel numbers for a while.
She did a comparison to the Energy Information Administration (EIA) data and saw some differences.
She says because of that a forecast of four-point a 4.1% increase in driving this Memorial Day season is somewhat questionable. She questions why AAA would expect a big surge in gasoline demand when we have seen evidence that so far drivers have been cutting back on consumption in 2024.
Why suddenly when they jump into their cars and start spending money when they’re being impacted by high inflation.
And while the Energy Information Administration did report a big surge in gasoline demand from the week before we have seen some very erratic data as far as gasoline from week to week as far as demand numbers are concerned.
Yet regardless of who’s right and who’s wrong the main thing to do is stop and take some time this holiday weekend to remember those that gave all for America and our freedoms. so many good men and women sacrificed so much so that we could have a country and they deserve our gratitude and prayers. God Bless them and God Bless their Families and God please bless America.
Scott DiSavino at Reuters wrote that Financial firm LSEG said gas output in the Lower 48 U.S. states fell to an average of 97.5 billion cubic feet per day (bcfd) so far in May, down from 98.2 bcfd in April. That compares with a monthly record of 105.5 bcfd in December 2023.
On a daily basis, however, output was up about 1.5 bcfd since hitting a 15-week low of 96.2 bcfd on May 1. Energy traders said that increase was a sign that the 63% gain in futures prices over the past three weeks prompted some drillers to start producing more gas.
Read Full Story »»»
DiscoverGold
Wheat hits highest closing price since July
By: Barchart | May 23, 2024
• Wheat hits highest closing price since July.

Read Full Story »»»
DiscoverGold
Natural Gas Rally Stalls at 2.92, Reversal Signals Loom
By: Bruce Powers | May 23, 2024
• After hitting 2.92, natural gas faced resistance and reversed, suggesting a potential top and increasing chances of a market correction.
Natural gas advances to a high of 2.92 on Thursday before encountering resistance and turning over. At the time of this writing natural gas has reversed intraday to below the halfway point of the day’s trading range. This indicates a possible weak close following a new trend high and a possible top for now. Today’s high was a little shy of testing the top declining trendline (blue dashed).

Large Measured Move Completed
However, an 87.2% measured move that matches the percentage advance from the rally starting from the April 23 swing low completed at 2.85. That advance covered the full rising trend channel that ended at 3.64 in October 2023. The current advance started from the 1.52 February swing low. It reflects a degree of price symmetry between the two swings. Once there is a match the chance of encountering resistance that could lead to a reversal increases.
Either way, a key pivot level is identified. Judging by today’s initial continuation into new trend highs, followed by a clear intraday reversal and a likely weak closing price, it seems like the market may have taken notice. Further, the relative strength index (RSI) has turned down from being overbought, the most overbought since the 2022 peak.
Watching for Further Weakness
Nonetheless, there is no daily reversal signal yet and natural gas could still advance. But the next higher target is not much higher at 2.98/2.99. Certainly, the uptrend is extended and due for a retracement. Even if slightly higher prices are seen before a further dip, the chance for a correction has increased.
A drop below Wednesday’s low of 2.61 on the daily chart will be bearish. Key price areas to watch for possible support start with the 200-Day MA at 2.64. That level is followed by the 20-Day MA and prior interim swing low at 2.21. A little lower is the 50% retracement of the current advance at 2.25 and prior swing low at 2.23. Further down is the 50-Day MA at 1.98.
Weekly Chart May End Bearish
Also, be aware of the weekly chart and how natural gas ends the week. As of today, the weekly chart is shaping up as a bearish shooting star. If the week completes in a similar fashion, it will set up a potential sell signal below this week’s low of 2.61.
Read Full Story »»»
DiscoverGold
Willing But Able? The Energy Report
By: Phil Flynn | May 23, 2024
The Fed Minutes were a buzz kill for smoking hot commodities after it said that some Fed officials might be willing to raise interest, if need be, but the question is whether or not they are able. Raising rates in an election year is fraught with political fallout so even if inflation stays red hot, I can’t imagine that a rate increase would be possible this year, unless of course Donald Trump becomes President.
Regardless, the Fed minutes broke oil, but as bad as it looked, the support was not broken. The Energy Information Administration (EIA) Petroleum Status report showed a decent snap back in gasoline to 9.315 million barrels a day(mbpd) and diesel demand up to 3.883 mbd. That improved the lagging four-week average on demand to 8.9 mbd, now just 1.8% below year ago levels. Distillate improved to 3.7 mbd, down 6.1%.
Global oil demand expectations rose after the India flash PMI climbed to 61.7 in May from 61.5 in April. That was the third fastest pace upturn in oil hungry India output since Jul-2010 and was partially fueled by Russian oil imports. How is that price cap thing working? The report said that services drove the growth amid acceleration in business activity. Now Jodi is reporting that India’s total product demand was nearly at the same level month over month at 5.6 mb/d but was 3.4% above the previous year’s level.
The oil market is preparing for the June OPEC online meeting. The oil market should comment that OPEC decided to hold the meeting online, but they may have a surprise already baked into the online meeting.
The key issue that currently moves oil prices is whether or not OPEC will extend production cuts into 2025. While that is unlikely, in an online meeting there’s no doubt about the commitment by OPEC plus to continue along the path that they are on.
Amena Bakr points out that, “commitment among the OPEC+ alliance to the cuts is strong, and countries that have been overproducing their quotas are compensating for the increased volumes.” So, OPEC plus may do whatever it takes to keep the oil market tight and if demand surges, the supply deficit will occur.
US oil inventories are still higher than most thought they would be at this point as supply at the Cushing, Oklahoma delivery point hit 36.3 million barrels, the highest level since July. Yet stagnant US oil output, at least according to EIA data, suggests that as the refining season kicks in that could change very quickly. The EIA says that US production has been stuck at 13.1-million-barrel day. Is that a sign that we are seeing a peak in production? Or is it a sign that the EIA just gave up on updating weekly production numbers?
Regardless, the EIA’s snapshot of supply puts U.S. commercial crude oil inventories (excluding those in the Strategic Petroleum Reserve) with an increase by 1.8 million barrels from the previous week. At 458.8 million barrels, U.S. crude oil inventories are about 3% below the five-year average for this time of year. Total motor gasoline inventories decreased by 0.9 million barrels from last week and are about 2% below the five-year average for this time of year. So, both demand and supply are below year ago levels. Distillate fuel inventories increased by 0.4 million barrels last week and are about 7% below the five-year average for this time of year.
The EIA is also putting out an alert about the upcoming hurricane season. The EIA said, “Meteorologists are forecasting a particularly intense Atlantic hurricane season this year; they expect 20–25 named storms with a possibility of 30 or more, according to reports from AccuWeather in April. Colorado State University similarly forecasts an estimated 23 named storms this year. The potential for a stronger hurricane season suggests heightened risk for weather-related production outages in the U.S. oil and natural gas industry. With this type of a forecast coming from the Energy Information Administration, it’s probably critical that you get your Fox Weather app downloaded on your phone.
Oil prices look like they are still in the process of bottoming here even with the weakness thrown at it. It’s probably a perfect time to start getting back in and building a position slowly.
Gold prices did take a hit after the Federal Reserve minutes but also there are concerns that high prices might cure high prices in India’s red hot economy. Reuters reported that, “India’s gold imports in 2024 could fall by nearly a fifth from the previous year, as record high prices spur retail consumers to exchange old jewelry for new items, the head of an industry body told Reuters. Lower imports by India, the world’s second biggest consumer of the precious metal, could cap a rally that carried global prices to a record this week.
Natural gas prices sizzled after early weakness yesterday. Increase in the demand for LNG potential for weather related demand is causing the resurgence in natural gas prices with the best run in 2 years. EBW Analytics warns that, “While the immediate term outlook may feature a retreat into Memorial Day weekend as CDDs peak and June final settlement awaits, the medium-to-long term outlook may find support amid robust power burns across Texas and the Southeast and glimmers of upside potential for LNG feedgas demand.” If you believe the global natural gas crisis is over, you better think again. Energy Intelligence reported that European natural gas prices jumped to their highest levels in over four months on Wednesday after Austria’s OMV warned that its supply may be cut off by Russia’s Gazprom.
Read Full Story »»»
DiscoverGold
Commodities Daily Market Movers (% Price Change)
By: Marty Armstrong | May 23, 2024
• Top Movers
NY Natural Gas Futures 6.4 %
Cotton 4.17 %
Cotton #2 (NYCE) Futures 3.93 %
Tokyo Palladium Futures 2 %
Cocoa (NYCSCE) Futures 1.92 %
• Bottom Movers
NY Copper Futures 5.04 %
New York Spot Copper 5.04 %
London Nickel Spot 4.39 %
NSW Baseload Electricity Continuous 3.74 %
London Aluminum Spot 3.47 %
*Close from the last completed Daily
DiscoverGold
Natural Gas Rallies to New Highs After Early Session Dip
By: Bruce Powers | May 22, 2024
• Following an early dip, natural gas rallied to 2.85, suggesting continued strength with key resistance ahead.
Natural gas stays strong to reach a new trend high of 2.85 on Wednesday. Earlier in the session the price of natural gas broke below the lows of the past couple days before buyers took control to rally into new trend highs. An outside day is the result.
Trading remains active near the highs of the day and will likely end today’s session with a new daily closing high for the current rally. A daily close above the prior trend high of 2.80 will be a slightly stronger indication of strength than a close below it.

False Breakdown Followed by Sharp Intraday Advance
Given the failure of the breakdown earlier in today’s session and the following strong recovery, it looks like natural gas wants to go higher. The next higher identified target zone is close by from around 2.86 to 2.88. Also, keep an eye on the top declining blue dashed trend channel line as resistance can be seen around that line. Further, if a daily close occurs above the line, it will be a sign of strength. Highter up is the 78.6% Fibonacci retracement at 2.99.
Price is Extended Yet Continues to Rise
Certainly, natural gas is getting extended as well. The relative strength index (RSI) is the most overbought since the 2022 peak. Considering the size of the current advance, this rally has exceeded all prior sharp advances since the first trend bottom in 2023 on a percentage basis. That is when starting the measurement from the most recent swing low (C). In this case, from (C) the current rally was up by as much as 80.1% at today’s high.
However, the full advance from the second trend bottom in April 2023 to the October 2023 peak was 87.2%. That performance will be matched in the current rally at 2.96 thereby providing another measured move target (purple arrows). It is interesting that this target is very close to the 2.99 Fibonacci retracement level. It is also close to several measured moves that occurred in natural gas during the uptrend that began from the 2020 bottoms.
Read Full Story »»»
DiscoverGold
Agriculture Master Report
By: Bill Moore | May 22, 2024
JULY WHT
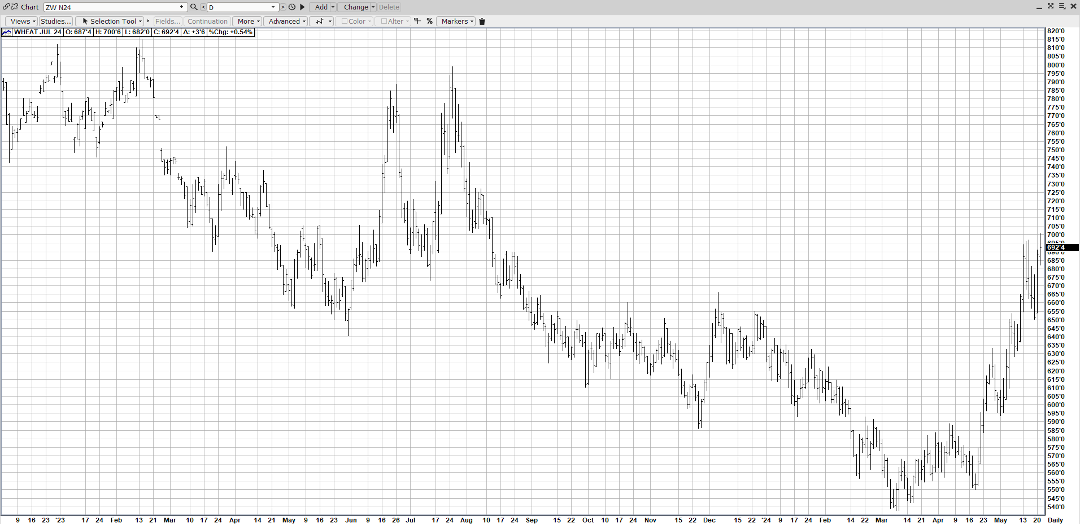
When it takes a mkt only 2 days rally to recapture what it lost in 5, that speaks volumes about its underlying strength – and that indeed encapsulates July Wht! Weather woes in the Black Sea area including drought & frost have energized the former lackluster mkt to a sparkling $1.50 rally in just the past month! Helping the rally was historical cheapness & a huge Short Open Interest – both establishing wht as the Upside Leader at the CBOT! Russia’s wheat crop was downgraded today to 83.5mmt (prev-86)! And they are the biggest wht exporter in the world! A record DJI & a slumping US Dollar have helped to fortify the rally!
JULY CORN
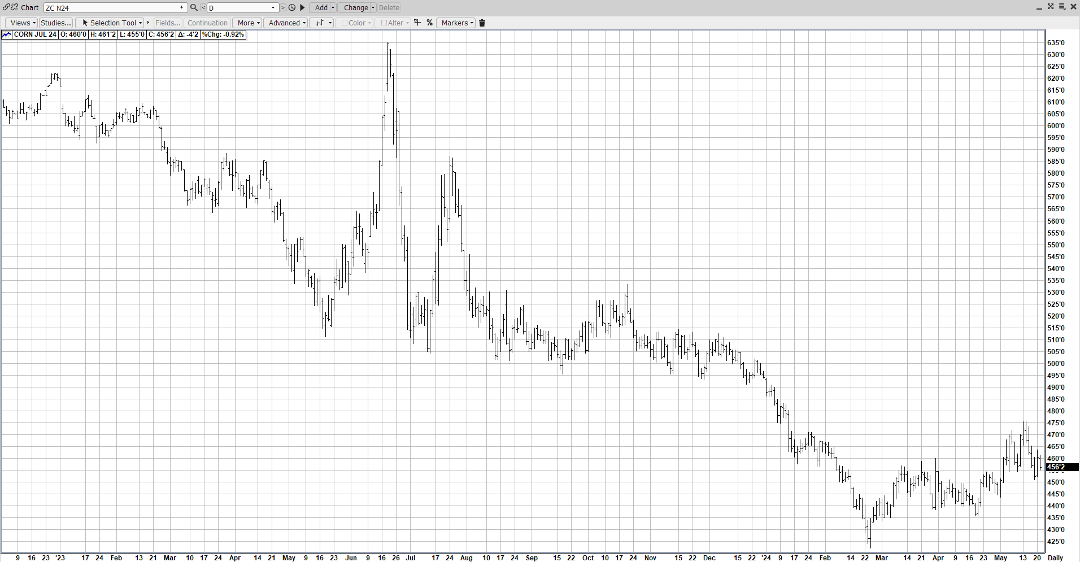
Exports have been stellar so far in 2024 – already 35% over 2023! And this week’s reports have been very encouraging – Monday Inspections were 1.210 MMT & today we had 2 flash sales – 110,000mt – Spain & 113,000mt – Mexico! That coupled with a price level $2.00 under 2024! The adequate supplies have been dialed in by the price break! Planting delays in the central Midwest have some pundits talking corn acres down to 89 acres (prev – 90)! Planting progress jumped 21% to 70% (avg – 71)! Illinois is at 67%, Indiana at 54% & Iowa at 78%! Wht has aided the corn rallies – running up $1.50 in the past 4 weeks! As well, the Macros have supported with DJI at a record 4000 & the US Dollar has broken 200 points in the past 2 weeks – inviting even more exports!
JULY BEANS
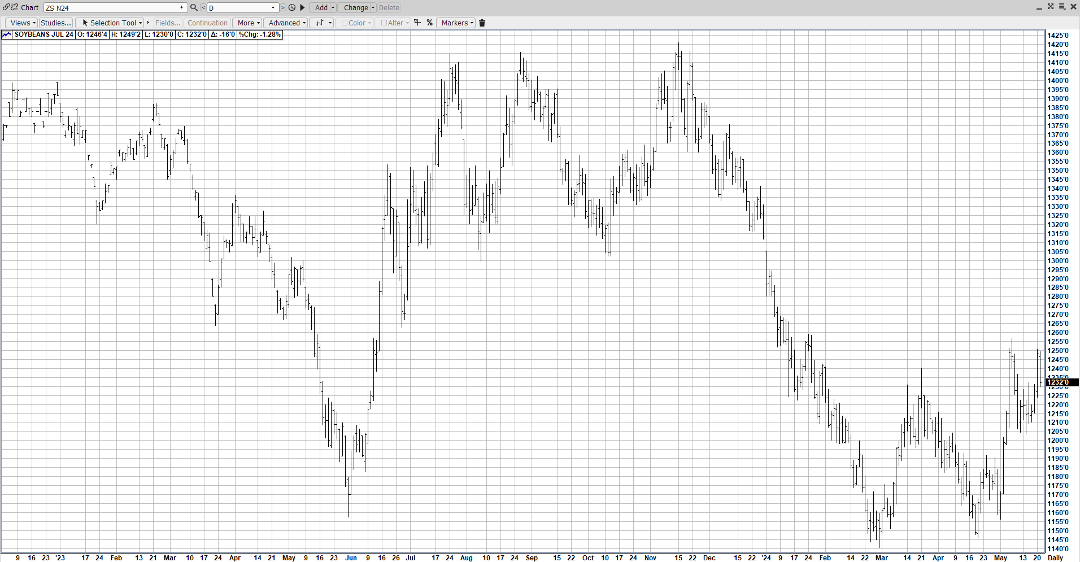
Easily the weakest of the CBOT grains, July Beans nevertheless had a stellar technical day yesterday – rallying to 4 month highs! Despite very lackluster exports, Beans have drawn strength from rising Brazilian Export Premiums, planting delays, catastrophic flooding in S Brazil & spillover support from the Wht Complex! We feel with a declining US Dollar, the US bean exports will come around! Pltg progress is on par with 52% in (avg – 49) – Ill is 58%, Ind is 49% & Iowa is 61%! Even though Beans are the “weak link”, a rising tide floats all boats! So global weather issues favorably impacting Wht & Corn will also lift July Beans!
JUNE CAT
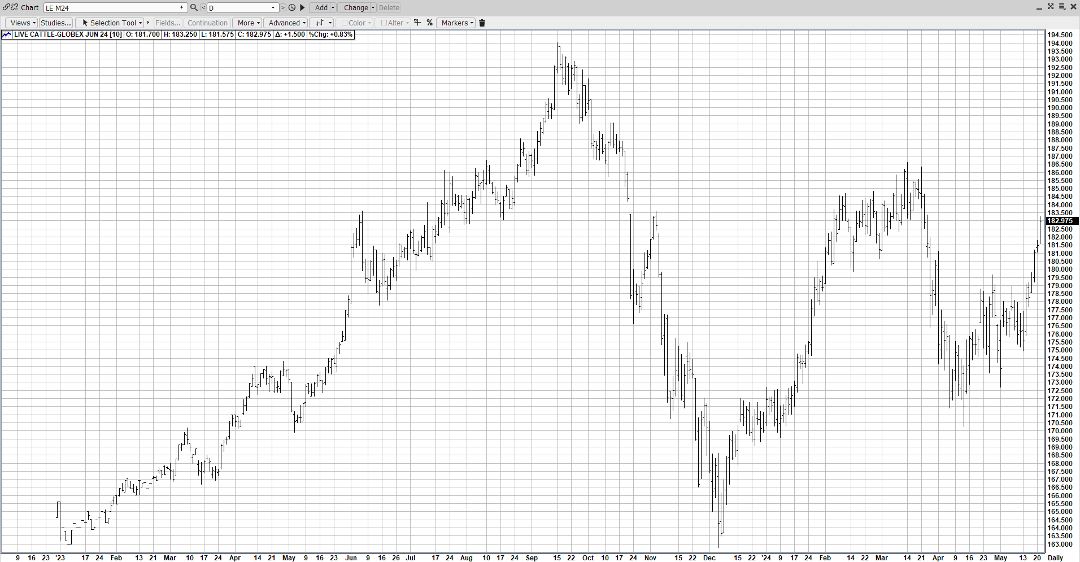
Even though, heavier weights have been offset by solid seasonal demand – keeping June Cat in a tight $6.00 range (173-179) of late, in the past 3 mkt days, in advance of Memorial Day W/E, demand has been revved up & daily slaughters low – both leading to a $3.00 upside explosion out of that snug congestion area! That leaves the 2024 highs just $3.00 away & easily within reach! The impressive above chart validates the June Cat strength!
JUNE HOGS
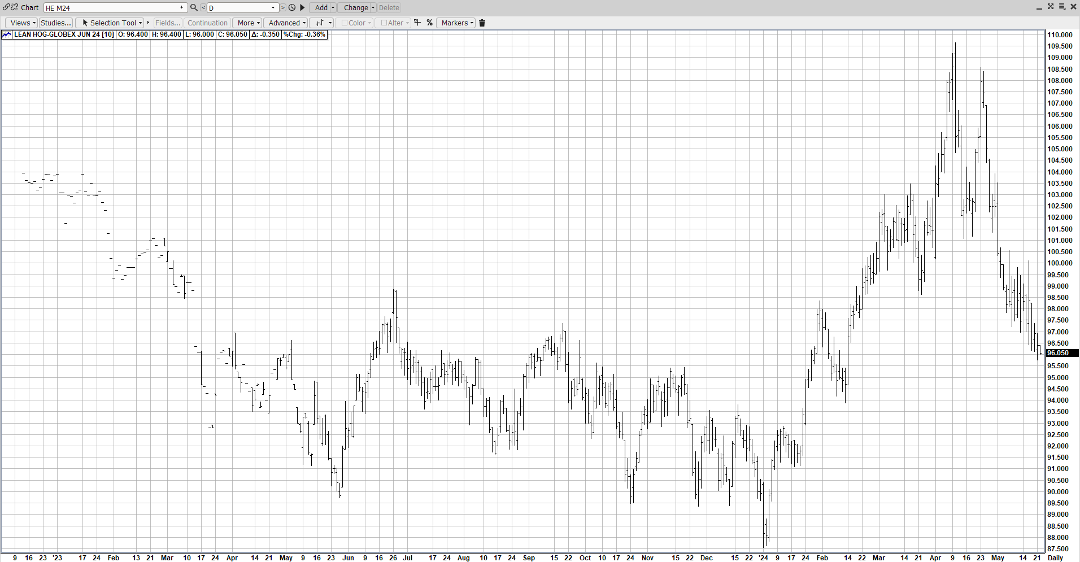
Despite breakout action in its Sister Mkt June Cat, June Hogs continue to struggle registering the lowest level yesterday since 2-21-24! Hog slaughter is up over last week & last year & the pork cut-out was down $1.36 on Tues. Long open interest has dropped to 56,128 from a record 92,731! Its very surprising that coming into Memorial Day W/E – a great demand period, that hogs haven’t gained any traction! However, one over-riding bearish fundamental is the sharp export loss to China over the last 12 months! They have an adequate hog supply now & in fact have been liquidating heavily in the past 6 months!
Read Full Story »»»
DiscoverGold
Orange Juice won't stop as it hits another all-time high
By: Barchart | May 22, 2024
• Orange Juice won't stop as it hits another all-time high.

Read Full Story »»»
DiscoverGold
Empty The Tank. The Energy Report
By: Phil Flynn | May 22, 2024
Empty Ideas just empty the tank. The Biden Administration wants to try to convince Americans that despite being the most anti-fossil fuel administration in history they still want to see low gas prices even as their policies say otherwise. The latest move by the Biden Administrations to sell that point to voters is a move to empty the gas tank by releasing 1 million barrels of gasoline from the Northeast gasoline reserve.
The press release on the previously authorized sale of this unused reserve that was created after Hurricane Sandy joyfully exclaimed that “The Biden-Harris Administration is laser focused on lowering prices at the pump for American families, especially as drivers hit the road for summer driving season,” said U.S. Secretary of Energy Jennifer M. Granholm. “By strategically releasing this reserve in between Memorial Day and July 4th, we are ensuring sufficient supply flows to the tri-state and northeast at a time hardworking Americans need it the most.”
Yes! Let them eat cake and burn hydrocarbons. Of course, the amount of gasoline that is to be sold is only about 11 percent of daily demand and the sales will be allocated in quantities of 100,000 barrels more than likely it will be consumed before most of us have breakfast.
And while very gallon might help lower prices, I think it’s rather desperate of the Biden Administration feeling the need to take a victory lap on this gasoline release. Gas prices average about $3.60 per gallon nationwide as of Tuesday, up 6 cents from a year ago, according to AAA.
The administration that has accused be U.S. oil and gas industry of price gouging and war profiteering has shown unusual vitriol against this industry. This is an administration that abused the mission of the strategic petroleum reserve by releasing supplies to try to lower gasoline prices ahead of an election. The continuing intervention by the Biden administration into the global oil markets has not been helpful to the type of investment that this country is going to need to meet our needs and global demand in the future. The timing of the announcement ahead of the Memorial Day holiday weekend with an effort to try to lower prices ahead of the summer driving season or at least trying to give the appearance of doing so.
We know that US consumers are angry about inflation and the Biden administration is concerned because they know that many Americans hold them responsible.
If you look at gasoline demand, there are signs that consumers must cut back because of inflation pressures. And you know that when Americans cut back on driving that is a cut back on their feeling of freedom and their prosperity.
The Biden Administration consistent metaling in the market along with regulations that create uncertainty has hampered the ingenuity and creativity of the US oil and gas industry. Biden significantly drained the Strategic Petroleum Reserve in 2022 following Russia’s invasion of Ukraine, dropping the stockpile to its lowest level since the 1980s.
Instead of working with one of the most dynamic industries in this country they chose to have an adversarial relationship with this industry. The Biden administration’s policies have been very inflationary. Their foreign policies failures like not avoiding war between Russia and Ukraine as well as the weakening of sanctions on Iran that helped fund Hamas Hezbollah and the Houthi rebels which have conspired to increase the cost of energy and just about every other commodity the planet.
Yet they continue to disparage the US oil and gas industry.
White House Press Secretary Jean-Pierre said, “While congressional Republicans fight to preserve tax breaks for Big Oil at the expense of hardworking families, President Biden is advancing a more secure, affordable, and clean energy future to lower utility bills while record American energy production helps meet our immediate needs.”
The White House press secretary obviously has no experience understanding about the US oil and gas industry.
The so-called tax breaks that the press secretary is talking about is away for U.S. oil and gas industry to produce more product and keep prices cheaper for the American people. When the Biden administration puts more burden on the US oil and gas industry that’s going to show up directly at the pump.
So while they keep telling us that they are trying to do wonderful things for hard working Americans the reality is the opposite and if you don’t believe it just go fill up at the pump.
And at the same time policies of this administration has allowed revenue in places like Iran to hit a five-year high. The Administration nd has failed to enforce sanctions on Russian oil. We should also point out that the oil on our SPR went to other countries that included our adversary, China. And while there’s no doubt that commodities have been at the beginning of a major super cycle and may have a long way to go, it’s clear that if the government continues to try to intervene in the free markets and try to pick winners and losers in this energy transition it’s only going to lead to even more inflation and higher prices in the future.
Today the petroleum markets are under pressure after the American Petroleum Institute (API) reported increases in crude and gasoline supply and hawkish Fed talk. Raising the inventories is raising concerns about a slowdown in demand and the possibility of stagflation as other commodities like grains and metals rise.
The API reported that crude stocks increased 2.48 million barrels while gasoline inventories increased by 2.1 million barrels. Distillates fell by 320,000 barrels as Farmers made a lot of progress in the fields. Farm Progress reported that USDA’s latest crop progress report, on Monday showed corn plantings still a bit behind the prior five-year average but has mostly caught up as more farmers have been able to jump back into spring fieldwork over the past several days. Soybean plantings passed the halfway mark, meantime, and are still modestly ahead of the prior five-year average. Winter wheat quality ratings unexpectedly shifted a point lower. Increasing inventories are raising concerns about slowing global demand. And that could be a sign of stagflation. Fed Speakers had to be hawkish as inflation continues to be a problem.
Barrons reported that Fed Governor Waller said he needs to see “several more” months of good inflation figures to begin interest rate cuts. Atlanta Fed President Bostic reiterated his view that inflation will continue to decline slowly and that the Fed can likely begin cutting interest rates in the fourth quarter.
Today could be a turning point for oil after all the negativities. If the market can get a more bullish report from the Energy Information Administration (EIA) today, we could be close to the bottom technically.
Keep an eye on demand to band for gasoline and products. It’s been subpar we do expect a bounce and we do expect to see a low coming into the prices very shortly. We don’t think the upside risk has gone away and we think there’s more upside than downside at these price levels.
Natural gas is incredible moves seems to be taking a pause after the market has had one of the best upward moves in 2 years. The recovery has been led by increased demand for one of the cheapest hydrocarbons on the planet. LNG exports resumed and the science of production was leveling out storage levels are still at historically high level. We are going to pull back here at a little bit to see if the air conditioning demand starts to increase demand. Power outages and demand destructions and part of the country due to storms has also hurt demand.
Naureen S. Malik at Bloomberg wrote that “Windows are still falling from skyscrapers in downtown Houston after a historic windstorm whipped through the city last week. And days after the disaster, more than 140,000 customers in the area remained without power. Most of those homes and businesses are served by CenterPoint Energy Inc. The utility operates the most stressed local power grid in the country. Malik says that “What happened in Houston is emblematic of widespread issues across the country. As the US grid is tested by extreme weather and increasing demand, aging infrastructure is giving way to higher counts of grid faults.
The problem is one of poor power- quality, or when the flow of electricity powering lights and appliances is being delivered at an uneven or unpredictable pace, which can lead to dangerous surges, sags, brownouts and outages.” Maybe they could put that is an electric car ad.
Read Full Story »»»
DiscoverGold
Wheat hits highest price since July! They're coming for our sandwiches now
By: Barchart | May 21, 2024
• Wheat hits highest price since July! They're coming for our sandwiches now.

Read Full Story »»»
DiscoverGold
Natural Gas Rallies to 2.80, Will It Hold?
By: Bruce Powers | May 21, 2024
• Natural gas hit a high of 2.80, completing a significant 76.8% rally from the April low of 1.58.
Natural gas hit a new trend high of 2.80 on Tuesday, thereby completing a 1.21 point or 76.8% rally from the April 25 low at 1.58. The new high has some significance as it is the completion of a 250% extension of a rising ABCD pattern. It shows the CD leg of the pattern up by 2.5x the price appreciation seen in the AB leg of the advance. Judging by the bearish intraday reaction once 2.80 was reached, it seems the market is aware of the relationship between the swings.

Next Moves Provide Clues
Follow through will be key. There remain higher target areas starting from 2.86 to 2.88. That zone includes an extended rising ABCD pattern at 2.86, which is calculated using 2.618x the advance seen in the AB leg instead of 2.5x. It sits with the June 2023 swing high at 2.88. Then, higher up from there is the 78.6% Fibonacci retracement at 2.99. Those higher targets may yet be reached but given an initial bearish reaction to reaching the 2.80 target, maybe not until there is some degree of a pullback and/or consolidation.
Caution Warranted by the Bulls
There are several additional reasons for caution following today’s high. The relative strength index (RSI) is the most overbought since the peak in in the price of natural gas in April 2022. Also, there is a concern about time symmetry. The current advance has been developing for 18 trading days. Two of the previous four rallies that followed the February 2023 trend high have lasted 18 days. Moreover, the current advance of 76.8% significantly improved on the 53.9% rally from the February 2023 trend low. That 53.9% rally had the strongest performance of subsequent rallies until the current.
Resistance and Support
A decisive advance above today’s high of 2.80 would provide the next bullish signal and give natural gas a chance to reach the 2.86 target zone. Also, a drop through today’s low of 2.64 provides a short-term bearish signal that may lead to a deeper pullback. Key support is around the 200-Day MA at 2.46. Below there is a 2.40 to 2.38 price zone. The 20-Day MA is down at 2.21.
Read Full Story »»»
DiscoverGold
Grains Report: Wheat, Rice, Corn and Oats, Soybeans, Canola and Palm Oil
By: Jack Scoville | May 21, 2024
• WHEAT
General Comments: Wheat was higher in all three markets after more reports of frosts and freezing temperatures in Russian growing areas. It has also been very dry there. In addition, Ukraine sent drones to several Russian ports, including grains ports, to disrupt the export pace and cost Russia money. The weather is still a key, with extreme dryness reported in Russia and parts of the US and too wet conditions reported in Europe. The weekly export sales report showed improved sales. Big world supplies and low world prices are still around. Export sales remain weak on competition from Russia, Ukraine, and the EU as those countries look to export a lot of Wheat in the coming period. Black Sea offers are still plentiful, but Russia has been bombing Ukraine again and shipments might be hurt from that origin.
Overnight News: The southern Great Plains should get mostly dry conditions. Temperatures should be above normal. Northern areas should see mostly dry conditions. Temperatures will average above normal. The Canadian Prairies should see mostly dry conditions. Temperatures should average above normal.
Chart Analysis: Trends in Chicago are mixed. Support is at 647, 632, and 610 July, with resistance at 697, 706, and 712 July. Trends in Kansas City are up with no objectives. Support is at 646, 640, and 630 July, with resistance at 710, 716, and 722 July. Trends in Minneapolis are up with objectives of 747 July. Support is at 710, 700, and 697 July, and resistance is at 758, 764, and 768 July.
• RICE
General Comments: Rice closed a little higher yesterday in consolidation trading. The futures market overall remained in a short term trading range but at the low end of the range. The USDA export sales report indicated moderate sales. Support comes from adverse weather in South American growing areas while new selling is noted from the potential for a big crop in the US. The big US crops are now in doubt from reports of extreme rains in southern growing areas and especially near Houston. Some more big storms are coming to this region in the next few days. Supply tightness is expected to give way to increased production this year and greatly increased supplies this Fall. These ideas are reflected in the prices seen in the old crop and the new crop.
Overnight News:
Chart Analysis: Trends are down with no objectives. Support is at 1854, 1827, and 1785 July and resistance is at 1918, 1948, and 1954 July.
• CORN AND OATS
General Comments: Corn and Oats closed higher yesterday in line with the rallies on Soybeans and Wheat. The USDA reports are helping to support futures as are ideas of better demand. The weather in the Midwest has been very wet and more rains are coming to cause planting delays but to allow for rapid development of planted crops. The Argentine crop has been hit by stunting disease that robs yields and the Brazil Winter crop is suffering from hot and dry weather. Demand has been the driving force behind the rally but now South American weather is the driving force. Increased demand was noted in most domestic categories along with rising basis levels, and export demand has been strong. Ethanol demand has turned less due to weaker petroleum prices seen lately. There is very dry weather for the Winter crops in central and northern Brazil
Overnight News: Mexico bough 113,050 tons of US Corn and Spain bought 110,000 tons of US Corn.
Chart Analysis: Trends in Corn are mixed. Support is at 450, 444, and 440 July, and resistance is at 467, 475, and 483 July. Trends in Oats are down with no objectives. Support is at 357, 350, and 343 July, and resistance is at 383, 390, and 403 July.
• SOYBEANS
General Comments: Soybeans and the products closed higher yesterday on ideas of improving demand for US Soybeans. Brazil basis levels are very strong and US products now compare favorably in price to those from South America. Support for Soybeans came from reports of excessive rains falling in US growing areas, especially the eastern sections of the Midwest. Domestic demand has been strong in the US but has suffered as crushers were crushing for oil. Oil demand has suffered as cheaper alternatives for feedstocks hit the bio fuels market.
Overnight News:
Chart Analysis: Trends in Soybeans are mixed. Support is at 1204, 1192, and 1187 July, and resistance is at 1250, 1256, and 1260 July. Trends in Soybean Meal are mixed. Support is at 366.00, 361.00, and 350.00 July, and resistance is at 388.00, 390.00, and 396.00 July. Trends in Soybean Oil are mixed. Support is at 4230, 4200, and 4140 July, with resistance at 4690, 4780, and 4880 July.
• CANOLA AND PALM OIL
General Comments: Palm Oil was higher yesterday on Chicago price action and despite news of weaker exports. There is also talk of increased supplies available to the market, but the trends are turning mixed on the daily and weekly charts. Canola was closed for a holiday.
Overnight News:
Chart Analysis: Trends in Canola are mixed to up with objectives of 688.00 and 723.00 July. Support is at 647.00, 639.00, and 616.00 July, with resistance at 689.00, 696.00, and 702.00 July. Trends in Palm Oil are mixed. Support is at 3900, 3870, and 3820 August, with resistance at 3990, 4040, and 4210 July.
Midwest Weather Forecast Scattered showers and storms. Temperatures should average above normal.
Read Full Story »»»
DiscoverGold
|
Followers
|
89
|
Posters
|
|
|
Posts (Today)
|
0
|
Posts (Total)
|
8957
|
|
Created
|
05/01/07
|
Type
|
Free
|
| Moderators DiscoverGold Pro-Life | |||
- The Commodity Bull is Running... Inflation is Running... Harder Living (i.e. FOOD, CLOTHING, SHELTER) is Dead Ahead... -
- Commodity Futures Trading -
http://finviz.com/futures_performance.ashx
All Commodity Futures Charts From Finbiz.com Available Below:
Daily
Weekly
Monthly
Quarterly
6 Months
12 Months
YTD
2 Years
5 Years
Max
Beneficial Educational Resources on Futures TradingThe futures market is volatile, and it cuts both ways. Leverage that makes it profitable can also ruin reckless, undisciplined traders overnight. Most brokers have paper trading available on their platforms, so those who are new to futures should take advantage and learn with these tools before going live with real money. Mitigate risk with stop loss orders at all times, and cut losses quickly instead of adding contracts and attempting to flip your way out of a losing position. Also, use mini instruments when available, with lower margin requirements, until you have sufficient capital to buy and sell more expensive contracts. Even though the potential is there, don't try to make too many profits at once. If things aren't going well, often times quitting for the day and collecting one's thoughts is the best decision. New opportunities come along daily. Markets are open nearly 24 hours, so set a schedule and stick to it. Avoid trading while tired or distracted, and please don't listen to the advice of others. Do research on fundamentals affecting markets as well as paying attention to TA. Watch key indices, and listen to accurate, real-time news during the session to stay aware of shifting trends. Trade smart, trade safely, and have fun.
Videos on Futureshttps://www.youtube.com/playlist?list=PL9A5C5A93D243CA44 Continuous Improvement in Progress |
Commodity Futures Trading
https://www.tdameritrade.com/investment-products/futures-trading.page
| Volume | |
| Day Range: | |
| Bid Price | |
| Ask Price | |
| Last Trade Time: |


