 News
News  Market Data
  Discover
Support: 888-992-3836
Copyright © 2023 InvestorsHub Inc.


Register for free to join our community of investors and share your ideas. You will also get access to streaming quotes, interactive charts, trades, portfolio, live options flow and more tools.
IEA VERSUS OPEC. The Energy Report
By: Phil Flynn | April 14, 2023
Tensions are rising between the International Energy Agency (IEA) and OPEC. While there has always has been tension between the IEA, which supposedly represent the interests of oil consuming countries and OPEC, a cartel that can restrict supplies, the tensions between the two organizations is at a fever pitch and the bad blood is boiling over the barrel.
The IEA, in their monthly report, calls out OPEC for their recent production cut saying that OPEC is, “aggravating an expected oil supply deficit in second half of 2023 and boosting oil prices at a time of heightened economic uncertainty, even as industrial activity slows in the world’s largest economies and production growth outside the alliance appears robust.” OPEC for their part disagrees that producers outside the alliance are being honest brokers as far as keeping production high especially when here in the US the Biden administration is slowing down permits and the EPA is trying to force Americans out of their internal combustion cars and trucks.
The EIA complains that OPEC’s self-described “precautionary move” was likely to be bad news for consumers at a time of heightened economic uncertainty. “Consumers confronted by inflated prices for basic necessities will now have to spread their budgets even more thinly,” the IEA said. “This augur badly for the economic recovery and growth.”
OPEC is looking at this as self-survival as consuming nations not only tried to influence their production decisions by relying on oil from strategic reserves before the war in Ukraine but also dared to try to cap the price oil in Russia which they view as a threat, not just to Russia but the cartel as a whole. Now we are going to see if that price cap will fail because as the IEA points out the weighted average Russian oil price has moved above the $60 a barrel since April 5th the first time since the G7 cap was introduced last year. Japan has already asked for a waiver to buy that oil. We will now see whether other consuming nations have the resolve not to pay over $60 a barrel for Russian crude and whether or not Russia will have the resolve to not sell to buyers under the current market price.
OPEC in their defense can cling to its concern that we are going into a recession, and they have the Fed Minutes to back them up. OPEC does not want to create another oil supply glut if the global economy crashes.
While we are seeing some signs of softening in the global economy, it seems that the impact on oil demand has so far been muted. Asian oil demand is soaring, and US demand is very strong. US Oil production seems to have plateaued and it looks like the IEA supply deficit call for later in the year is right on target and they have no one to blame but themselves.
The IEA focus in recent years has been pushing the green energy transition. They took their eyes off the ball on what should have been fossil fuel energy security. The IEA instead discouraged investment in fossil fuels that will make the looming supply gap look minuscule in coming years unless we dramatically change course in global energy policy. I think it’s rich that the IEA has the nerve to call out OPEC for not being worried about consumers confronted by high prices not having enough money for basic necessities when the green energy policies they have promoted is the number one cause for sharply rising energy prices.
As a reminder the world oil demand growth estimate for 2022 remains at 2.5 mb/d, broadly unchanged from last month’s assessment. For 2023, it is also unchanged from the last month’s assessment at 2.3 mb/d. OPEC made e minor downward adjustments reflecting the latest developments in the OECD region, primarily in OECD Americas and OECD Europe. However, the stronger-than-expected demand seen in non-OECD in January and February necessitated some upward revisions. Oil demand in the OECD is forecast to increase by 0.1 mb/d in 2023, while the non-OECD is forecast to grow by 2.2 mb/d
OPEC put world oil supply and the non-OPEC liquids supply growth estimate for 2022 remains at 1.9 mb/d, broadly unchanged from the previous month’s assessment. The main drivers of liquids supply growth for 2022 were US, Russia, Canada, Guyana, China and Brazil, while the largest declines were from Norway and Thailand. For 2023, non-OPEC liquids supply growth remains broadly unchanged from last month and is forecast to grow by 1.4 mb/d. The main drivers of liquids supply growth are expected to be the US, Brazil, Norway, Canada, Kazakhstan and Guyana, while the decline is expected primarily in Russia. Large uncertainties remain over the impact of the output prospective for US shale in 2023. OPEC NGLs and non-conventional liquids are forecast to grow by 0.1 mb/d in 2022 to average 5.4 mb/d and by 50 tb/d to average 5.4 mb/d in 2023. OPEC-13 crude oil production in March dropped by 86 tb/d m-o-m to an average of 28.80 mb/d.
The IEA said that, “While oil demand in developed nations has underwhelmed in recent months, slowed by warmer weather and sluggish industrial activity, robust gains in China and other non-OECD countries are providing a strong offset. In 1Q23, OECD oil demand fell 390 kb/d y-o-y, but a solid Chinese rebound lifted global oil demand 810 kb/d above year-earlier levels to 100.4 mb/d. A much stronger increase of 2.7 mb/d is expected through year-end, propelled by a continued recovery in China and international travel. For 2023 as a whole, world oil demand is forecast to rise by an average 2 mb/d, to 101.9 mb/d, with the non-OECD accounting for 87% of the growth and China alone making up more than half the global increase.
Meeting those gains may prove challenging as the new OPEC+ cuts could reduce output by 1.4 mb/d from March through year-end, more than offsetting a 1 mb/d increase in non-OPEC+ production. Growth from the US shale patch, traditionally the most price-responsive source of more output, is currently limited by supply chain bottlenecks and higher costs.
Our oil market balances were already set to tighten in the second half of 2023, with the potential for a substantial supply deficit to emerge. The latest cuts risk exacerbating those strains, pushing both crude and product prices higher. Consumers, currently under siege from inflation, will suffer even more from higher prices, especially in emerging and developing economies according to the IEA.
Paul Young at Quantum Commodity Intelligence wanted me to point out that the Brent/Dubai cash spread inverted for the first time in over six months Thursday, as OPEC+ cuts and a firmer demand outlook for Asia compared to Europe lifted the Middle East benchmark above its North Sea counterpart. He said that the Brent/Dubai cash spread for June cargoes was assessed by Quantum at -$0.08/b, the first negative point since late September. Brent/Dubai was already in decline since the start of the year with the spot spread at over $4/b in early January, but lingering fears over recession in the West coupled with a glut of light sweet crude has gradually eroded the premium for Brent. The front spread averaged around +$0.80/b last month, but the surprise decision at the start of the month that a number of OPEC+ members will cut production from May has been enough to flip the closely-watched spread.
Of the approximate 1.15 million bpd reductions, around 1 million bpd will come from Middle East Gulf producers with close to 100% compliance expected from Saudi Arabia, UAE, Kuwait, Iraq and Oman.
On the demand side, China remains the primary driver, underlined by Thursday’s OPEC report forecasting that China’s oil demand is now expected to average 15.61 million bpd this year, up by 760,000 bpd year-on-year. By contrast, crude demand growth has been adjusted lower for “all four quarters of 2023, to reflect the most recently received data for first quarter of 2023 and account for an anticipated decline in economic activity in OECD Americas and OECD Europe,” said OPEC.
Natural gas is still seeking a bottom. It may be time to start looking at options even as there is a limited supply of them.
Read Full Story »»»
 DiscoverGold
Today's Futures Heat Map • Strongest: Platinum, Coffee, Lumber, Silver
By: Barchart | April 13, 2023
• Today's Futures Heat Map
Strongest: Platinum, Coffee, Lumber, Silver
Weakest: Natural Gas, Hard Red Wheat, Wheat, Lean Hogs

Read Full Story »»»
DiscoverGold
Much Cooler Temperatures This Weekend. The Corn & Ethanol Report
By: Daniel Flynn | April 13, 2023
We kickoff the day with Export Sales, PPI MoM & YoY, Initial Jobless Claims, Core PPI MoM & YoY, Continuing Jobless Claims, and Jobless Claims 4-Week Average at 7:30 A.M., EIA natural Gas Storage at 9:30 A.M., 4-Week & 8-Week Bill Auction at 10:30 A.M., and 30-Year Bond Auction at 12:00 P.M.
On the Corn Front Brownfield News reports Illinois farmer says corn & soybean planting is off to a good start as planting picked up steam across the Corn Belt this week and Illinois farmer Grant Strom says field conditions have been better than average. “We started to see the first planters really roll on Monday,” he says, “We were planting some soybeans on Monday and started corn on Tuesday. We’ll probably continue through Friday and it looks like we’re supposed to get some weather this weekend, but will dry up for next week,” he tells Brownfield with relatively mild winter in Illinois and the quick warm-up this spring timely herbicide applications are a necessity. “The weed germination and growth is definitely earlier than normal,” he says. Strom says some insect pressure could be a problem this year. “I think most fear the most frost we had was 8 inches this winter,” he says. “That only lasted about a week ahead of Christmas. Usually, I like to see a couple of feet of frost down in the soil to not only break the ground up but also to kill some of these pests.” Strom raises corn and soybeans in Knox County Illinois about 40 miles west of Peoria. Weekend weather in the Midwest is expected to see a significant drop in temperatures and wet weather with snow flurries in some areas. In the overnight electronic session the May corn is currently trading at 657 ½ which is 1 and ¼ of a cent higher. The trading range has been 659 ¼ to 654 ½.
On the Ethanol Front fuel ethanol fell by more than 4% for the week ending April 7, according to data released by the US Energy Information Administration yesterday. Weekly ending of fuel ethanol were down slightly. Ethanol production averaged 959,000 barrels per day (bpd) down 44,000 bpd compared to the 1,003 million bpd of production a week ago. When compared to the same week last year, production for the week ending was down 36,00 bpd. Weekly ending stocks for fuel ethanol fell 25, 128 million barrels, down 8,000 barrels when compared to the 25,136 million barrels a week ago. When compared to last year stocks were up 325,000 barrels. Meanwhile, “Whiskey Fungus” is spreading in Mulberry, Tennessee, a small town in Lincoln County that borders the sprawling Jack Daniels whiskey operation – the food source for alcohol-loving mold dubbed “Whiskey Fungus.” Residents are fighting this fungal spread in court, as people fear for their property value, plant life and personal health and wellbeing. We will keep you posted on this story. There were no trades or open interest in ethanol futures.
Read Full Story »»»
DiscoverGold
The Wild Blue. The Energy Report
By: Phil Flynn | April 13, 2023
Oil prices are on their way to the wild blue yonder after closing at the highest price since November and above the 200-day moving average. Global oil demand is surging, led by China, India and Japan. This morning it was reported that China’s crude oil imports were 12.3 million barrels per day in March 2023, up 22.5 percent on an annual basis. It is the highest level of imports since June 2020, according to Reuters on Thursday. Even US Energy Secretary Jennifer Granholm added to the bullishness as she suggested that the US would indeed refill the Strategic Petroleum Reserve back to pre-Ukrainian war levels. That comment seemed to be a clean-up of her past comments that the US was not in any hurry to refill the reserve and it could take years. Those comments angered OPEC plus Russia and probably was one of the reasons that OPEC decided to announce another production cut.
OPEC Plus Russia is also sending a signal that they do not take too kindly to oil price caps. Now with Russian Urals soon testing those $60.00 cap levels, the world is getting ready for a global oil market showdown. Russia will make them pay the price or they will cut supply. That is the upside price risk for oil.
The CPI data yesterday came in not as hot as expected in March and fell for the ninth consecutive month. And for the first time since September 2020, grocery prices fell monthly. Yet prices still increased by 5% for the 12 months ended in March, down from 6% in February. That CPI data caused the dollar to drop and commodities to go higher. They put a suggestion in the Fed Minutes that there’s a possibility of a mild recession and is for the moment, tempering the bullishness of the data.
News that Biden’s Environmental Protection Agency is pushing new tailpipe emissions limits that could force much as 67% of all new vehicles sold in the U.S. by 2032 to be all-electric and force many Americans to buy car that they can’t afford and do not want. I had a lot of calls about how this would impact oil prices. This is dangerously bullish for global oil prices. This short-sighted policy will prove to be a disaster for the economy and cause a shortage in US refining capacity that is already too short. It will also discourage investment and add to the massive supply versus demand gap that is plaguing the world economic and environmental future.
While the International Energy Agency’s director is trying to say that he expects that global fossil fuel consumption could peak out earlier than the late 2020’s, the accuracy in their past long-term predictions should make us nervous. The IEA has admitted that they will massage their data to scare people to act on climate change and I assume they will also make predictions on peak demand if it fits their agenda.
The EIA reports didn’t seem like we are going into a recession. The EIA showed that demand based on product supplied averaged 20.0 million barrels a day, up by 0.7% from the same period last year.
Over the past four weeks, motor gasoline products supplied averaged 9.1 million barrels a day, up by 5.5% from the same period last year. Distillate fuel product supplied averaged 3.9 million barrels a day over the past four weeks, up by 1.5% from the same period last year. Jet fuel product supplied was up 1.5% compared with the same four-week period last year. So, in every major category demand is higher than it was a year ago. And supply in every major category is below the five-year average.
The EIA said that U.S. commercial crude oil inventories (excluding those in the Strategic Petroleum Reserve) increased by 0.6 million barrels from the previous week. At 470.5 million barrels, U.S. crude oil inventories are about 3% above the five-year average for this time of year. Total motor gasoline inventories decreased by 0.3 million barrels from last week and are about 7% below the five-year average for this time of year. Finished gasoline inventories increased, while blending components inventories decreased last week. Distillate fuel inventories decreased by 0.6 million barrels last week and are about 11% below the five-year average for this time of year.
There were a lot of questions about the exports from the US being down big last week. They should rebound next week leading to a big crude oil drawdown even as we expect another SPR Release.
The EIA reported that mild winter temperatures and reduced natural gas consumption in the residential and commercial sectors drove down overall U.S. natural gas consumption this past January and February, according to our Short-Term Energy Outlook (STEO). In January 2023, U.S. natural gas consumption averaged 106.8 billion cubic feet per day (Bcf/d), its lowest January volume since 2017. February 2023 natural gas consumption averaged 104.5 Bcf/d, its lowest February volume since 2018. U.S. natural gas consumption in January was 8% less than year-ago levels and 3% less than the five-year average (2018–22) for January. February natural gas consumption was 4% less than year-ago levels and 1% less than the five-year February average. Natural gas consumption in the residential and commercial sectors, which was down 16% in January and 12% in February from the same months in 2022, was low because above-average winter temperatures reduced seasonal heating demand.
Read Full Story »»»
DiscoverGold
Orange Juice Up almost 60% over the last 12 months and hit an all-time high earlier this month
By: Barchart | April 12, 2023
• Natural Gas and Sugar getting most of the attention this year but how about Orange Juice? Up almost 60% over the last 12 months and hit an all-time high earlier this month.

Read Full Story »»»
DiscoverGold
Agriculture Master Report
By: Bill Moore | April 12, 2023
MAY BEAN
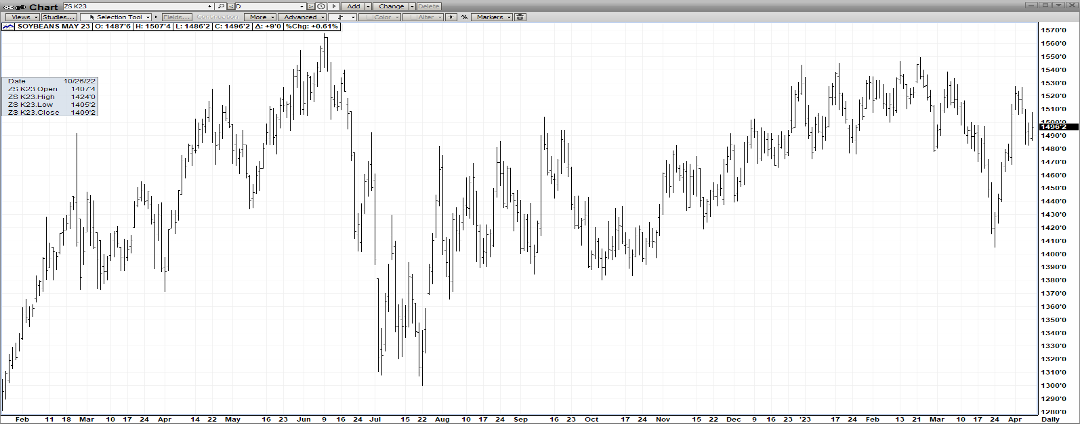
Since late March, May Beans have staged a $1.20 rally (1410-1530) – on the back of one of the worst droughts in Argentine history – today reported as 27.0 MMT bean crop (last year – 43.9)! In addition, the 3/31/23 Acreage & Qtly Stocks Report – surprisingly reflected US bean acres unchanged from last year with lower carryout than expected! The supply/demand #’s are definitely friendly – going into the US growing season – putting a lot of pressure on the US crop to be at least adequate -or the 6-year low stocks will drop even further! Outside markets have been favorable with crude oil $16 higher than a month ago – buoyed by the OPEC 1 million barrel drop in daily production & the DJI has rallied 2000 points since the banking crisis! The US $ is 10% lower than last Fall! We NEED a good US crop!
MAY CORN
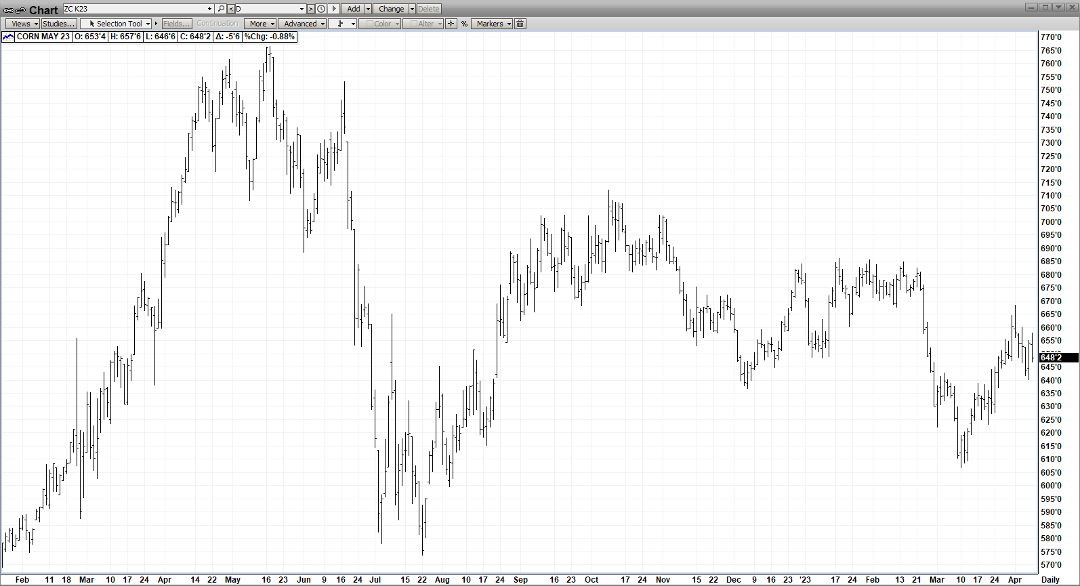
Corn has been the beneficiary of amazing export demand from China – who has bought US Corn almost every day for the last 3 weeks! And then, a week ago, OPEC announced it was cutting daily production by over 1 million barrels a day – immediately spiking up crude oil by $5.00 and greatly enhancing ethanol demand! The USDA has forecast corn acres to rise by over 3 million acres but many analysts are quite skeptical of that big of an increase! US corn – with the help of a much depleted US Dollar remains the “low bid” on the global mkts and that advantage should keep exports flowing & prices on the rise!
MAY WHT
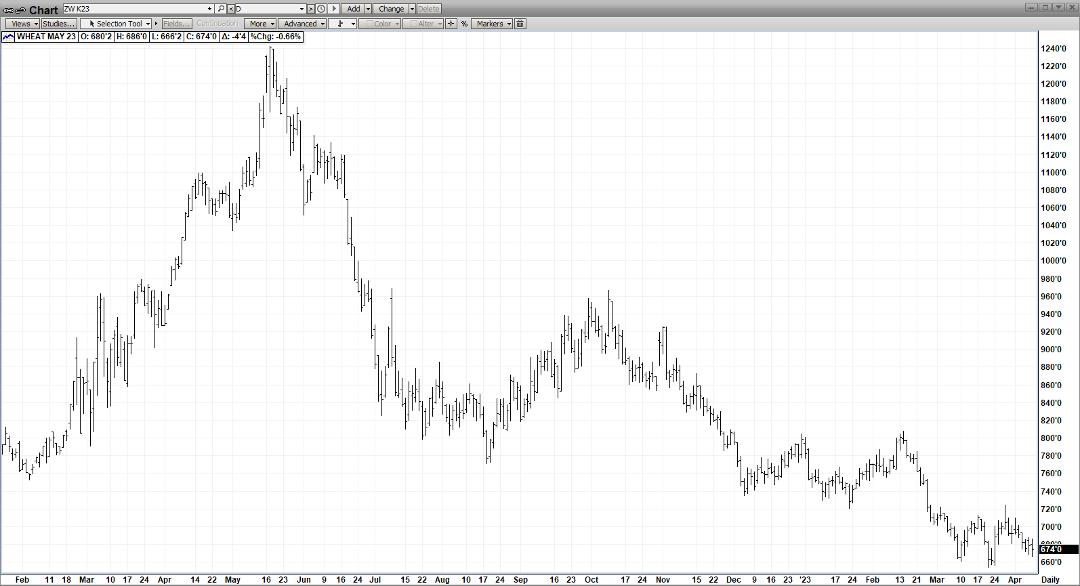
The chart action isn’t too impressive but Russia’s recent remarks about global wht prices being too cheap were! And that coupled with the severe drought in the Central Plains should be enough impetus for a turn-around! The Gd/Ex rating on Winter Wheat is currently at 27% – one of the lowest readings in recent memory! A strong rally from current price levels is highly likely – given the supply/demand fundamentals – especially if wht is able to coat-tail a similar updraft in corn & beans off tight stocks/strong exports!
JUNE CAT
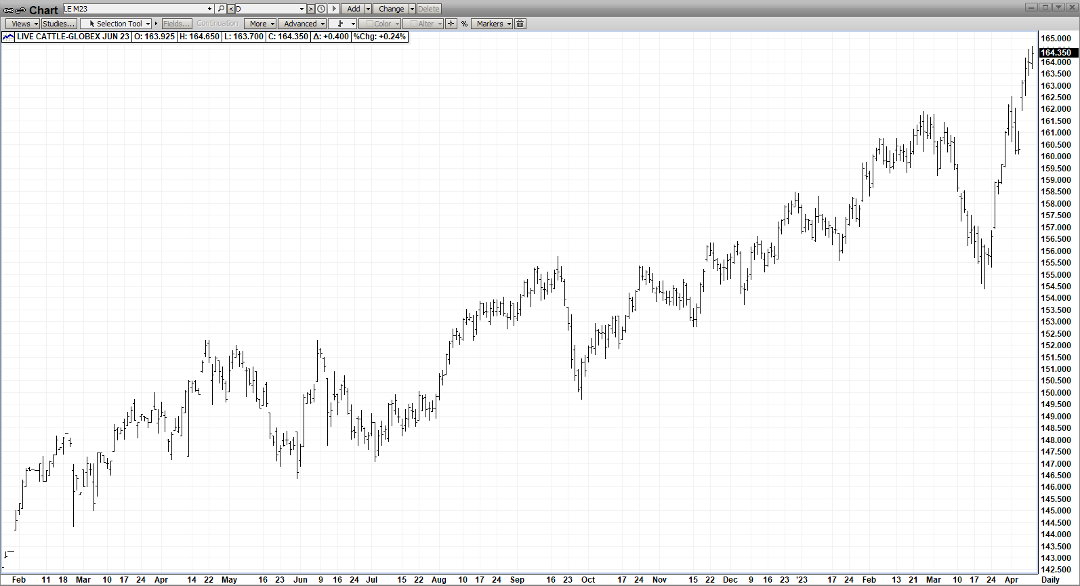
An unrelenting Bull Mkt keeps on chugging upward toward record highs -energized by soaring cash & very tight supplies – but, amazingly, still at a discount to cash! Waning 2nd Qtr production is under last year & also under the 1st Qtr & is also fueling the up! A rare, gaping unfilled gap (161-162) – acts as upward catalyst – the longer it remains unfilled! Exports were higher in last Thursday’s report! And this incredible run is taking place while the competitor – Pork – hugs its lows! You’d think the consumer – sooner or later – would make the switch between high-priced steaks & very cheap pork chops but not yet! Finally, the best demand period of the year – the outdoor barbeque season is upon us – which should further bolster the mkt!
JUNE HOGS
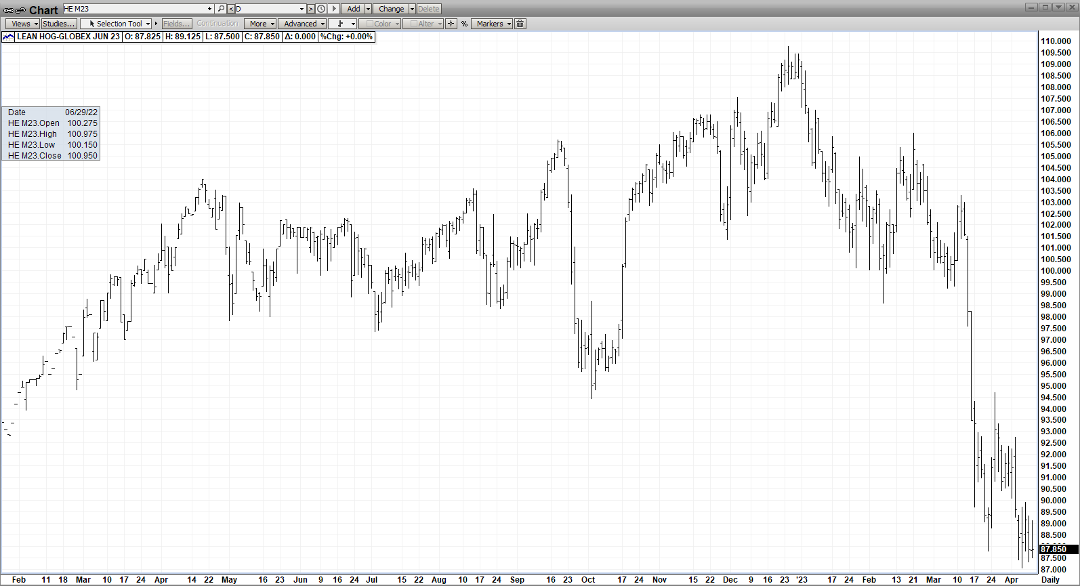
Pick a low at your own peril! The mkt seemingly has the supply fundamentals to crater out – with 2nd Qtr Production is under last year & also the 1st Qtr – & last week came in 3.7% under a year ago. Also, pork cut-out seems to have stabilized, weekly export sales came in the highest since Dec 15 & traders hold a near-record short position! But still, the mkt Stubbornly grinds out new lows every 3rd or 4th day! And the best demand period is dead ahead! The mkt will tell us when it has bottomed & it should be soon! Look for “bullish divergence” where June Hogs are unable to make new lows off of bearish news!
Read Full Story »»»
DiscoverGold
Deliveries on London Sugar/Currencies/Can$
By: The PRICE Futures Group | April 12, 2023
• Fri, April 14th is Last Trading Day for May London Sugar.
• Mon, April 17th is Last Trading Day for April Currencies.
• Tues, April 18th is Last Trading Day for April Canadian Dollar.
Read Full Story »»»
DiscoverGold
Today's Futures Heat Map • Strongest: Platinum, Crude Oil, Silver, Copper
By: Barchart | April 12, 2023
• Today's Futures Heat Map
Strongest: Platinum, Crude Oil, Silver, Copper
Weakest: Natural Gas, Orange Juice, Soybean Oil, Sugar

Read Full Story »»»
DiscoverGold
The Corn & Ethanol Report: Negative Spin For Corn On USDA Stockpiles
By: Daniel Flynn | April 12, 2023
We kickoff the day with MBA 30-Year Mortgage Rate, MBA Mortgage Market Index, MBA Mortgage Refinance Index, MBA Purchased Index, and MBA Mortgage Applications at 6:00 A.M., Core Inflation Rate MoM & YoY, Inflation Rate MoM & YoY, Real Earnings, CPI s.a. & CPI at 7:30 A.M., EIA Energy Stocks at 9:30 A.M.,17-Week Bill Auction at 10:30 A.M., 10-Year Note Auction at 12:00 P.M., FOMC Minutes & Monthly Budget Statement at 1:00 P.M.
On the Corn Front all in all the USDA corn data was not impressive with traders expectations. Argentina’s numbers came in a little better than the street expected but still was still no surprise to the actual. Brazil is pretty much done as the second harvest is moving while their production remained the same. Funds reversed their short position before the report and are taking less heat in the overnight wit corn in the green for the moment. Exports to China will continue to be a wildcard as Brazil’s 2nd harvest is expected to exceed the USDA’s forecast. A wet cold front is expected in the Midwest corn belt this weekend and slow plantings. Tomorrow’s Export Sales will be of interest to support corn prices. In the overnight electronic session the May corn is currently trading at 654 ¼ which is 3 ¼ cents higher. The trading range has been 654 ½ to 648 ¾.
On the Ethanol Front the USDA maintained it’s forecast for 2022-23 corn use for ethanol production in yesterday’s WASDE report, had their outlook for reduced imports and reduced food, seed and other (FIS) use. The forecast for stocks remained unchanged. The USDA lowered its forecast for corn imports by 10 million bushels based on observed trade to date. Feed and industrial use is unchanged at 5.275 billion bushels based on indicated disappearance during the December February quarter. FSI is lowered for corn use for glucose, dextrose and starch. The agency maintained its forecast that 5.25 million bushels of corn will go to fuel ethanol production for 2022-23 down from 3.326 billion bushels for 202o-21. While supply and use falling by the same amount, ending stocks are unchanged at 1.342 billion bushels. The season-average from price is unchanged at $6.60 oer bushel. There were no trades or open interest in ethanol futures.
Read Full Story »»»
DiscoverGold
Spring Refining Capacity Fever. The Energy Report
By: Phil Flynn | April 12, 2023
The ever-optimistic Energy Information Administration (EIA) predicted in their “Short Term Energy Outlook” [STEO] that US refining capacity will average 90% this year and again in 2024. That’s an impressive estimate and it shows that with the US petroleum products well below average, we’re going to need to squeeze every ounce of blood out of the refining turn up that we can to make sure that gasoline and diesel prices do not soar out of control. In other words, on the refining side almost everything going to have to go perfect for the (EIA) predictions on prices to come true and let’s face it, that is a very uncomfortable feeling.
That’s why it’s probably a very good thing that Kevin O’Leary is thinking about building a refinery as he announced on the “Big Money Show” on the Fox Business Network. Mr. O’Leary said, “I’m going to build a refinery in America. It’s going to cost about $14 Billion. I’m going to find a state that wants to work with me. I’m going to get a permit and we’re going to do the right thing for America.”
And while that’s very encouraging having worked on a refinery project in the past, I know it’s not going to be easy. The $14 billion will probably buy close to a refinery with about 300,00 barrels of refining capacity assuming the regulatory costs associated with building the refinery do not use up all the cash. And while Mr. O’Leary might just be doing the right thing for America, it also should be very profitable because I expect refining margins to be extremely strong over the next decade or so.
At the same time, the EIA says that they expect that OPEC’S production is going to be down by at least 500,000 barrels a day in 2023 but they do expect it to rebound by a million barrels a day in 2024 after the output agreement expires in 2023. Again, for the EIA, hope springs eternal. I have no idea why the Energy Information Administration is just assuming that OPEC is going to raise production after their agreement expires in 2024. Obviously, that’s a far-out prediction to make but I think the way things are going right now for OPEC, they may consider rolling over that production. OPEC has said before that they want to keep spare production capacity in the system and if they raise production by 1,000,000 barrels a day, that’s going to squeeze that global spare production capacity.
The EIA also says that they expect the global oil markets will be in relative balance over the coming year. I guess that comes down to how you define relative. We are predicting that we’re going to see a supply deficit later in the year. Already we are seeing global oil inventories start to draw down.
Yesterday’s American Petroleum Institute (API) report was a perfect example of that. The API reported a tiny 377,000-barrel crude oil increase that would have been a draw if it were not for this week’s SPR release. It was also very bullish that the API reported another big 1.36-million-barrel drawdown in Cushing, OK. The report also showed that refiners, despite their best efforts, are not making any progress in building supplies with diesel supplies falling by 1.98 million barrels and gasoline supplies increasing by fumes at 450,000 barrels. The EIA has also admitted in the past that their demand estimates probably underestimated demand. In the STEO, the EIA raises their forecast for world oil demand growth by 60,000 barrels a day and demand at up 1.85 million barrels year over year for 2024 but in 2023 they cut their forecast by 40,000 barrels a day. The EIA says that the Brent crude oil spot price will average $85 per barrel (b) in 2023. That’s up $2 a barrel from their last forecast. The EIA also warned that despite their higher price forecasts the recent banking issues could result in lower oil prices. So much for the optimism earlier in the report.
That’s why for oil traders, it’s very important to look at today’s consumer price index. A hot inflation number could cause the dollar to rally and cause oil to fall. If inflation is in check, look for a big rally in oil because our expectations are the EIA report for the weekly inventories will be very supportive. The Energy Information Administration also forecasts gasoline prices are going to peak at 350 a gallon to 360 a gallon in June. OK we’re back to being optimistic.
The EIA says that mild winter weather in the first quarter of 2023 (1Q23) resulted in natural gas inventories ending the withdrawal season (November–March) 19% higher than the five-year (2018–2022) average. We forecast natural gas inventories will end the injection season (April–October) at 3.8 trillion cubic feet, 6% above the five-year average. The EIA forecasts that the Henry Hub natural gas spot price will average about $2.65 per million British thermal units (MMBtu) in 2Q23 as natural gas inventories begin to rise. With inventories remaining above the five-year average in 2023, we expect natural gas prices to average less than $3.00/MMBtu for 2023, a more than 50% decrease from last year. Yet natural gas is showing little signs of a bottom. The potential for some hot weather coming in will keep it in check. And while the hot weather may only have a short-term impact in natural gas prices, the longer-term outlook for weather from some forecasters are raising some eyebrows. There is more and more talk of a super El Nino which could impact not only natural gas but the grain markets, oil markets and the coal markets.
Read Full Story »»»
DiscoverGold
Commodity price changes over the last year...
By: Charlie Bilello | April 11, 2023
• Commodity price changes over the last year...
Sugar: +16%
US CPI: +6.0%
Gold: +3%
Silver: -1%
Gasoline: -6%
Soybeans: -10%
Corn: -14%
Copper: -14%
Brent Crude: -15%
WTI Crude: -15%
Heating Oil: -18%
Coffee: -23%
Wheat: -33%
Zinc: -35%
Cotton: -38%
Lumber: -52%
Natural Gas: -67%
Read Full Story »»»
DiscoverGold
Today's Futures Heat Map • Weakest: Pork Cutout, Lean Hogs, Wheat, Hard Red Wheat
By: Barchart | April 11, 2023
• Today's Futures Heat Map
Strongest: Coffee, Sugar, Orange Juice, Palladium
Weakest: Pork Cutout, Lean Hogs, Wheat, Hard Red Wheat

Read Full Story »»»
DiscoverGold
Grains Report: Wheat, Rice, Corn and Oats, Soybeans, Canola and Palm Oil
By: Jack Scoville | April 11, 2023
• WHEAT
General Comments: Wheat markets were higher yesterday on uncertainty about exports from the Black Sea and on bad growing conditions in the western Great Plains, where it remains very hot and dry with little or no relief in sight. Turkey and Russia are talking together about their own plan for exports from the Black Sea and are no including the UN in the talks. Trends are turning down on the daily charts. Ideas that big Russian offers and cheaper Russian prices would be a feature for a while in the world market was the driving force for the weaker prices. Ideas are that both Australia and Russia are harvesting record to near record Wheat crops this year. The demand for US Wheat in international markets has been a disappointment all year and has been hindered by low prices and aggressive offers from Russia.
Overnight News: The southern Great Plains should get mostly dry conditions. Temperatures should be above normal. Northern areas should see mostly dry conditions. Temperatures will average above normal. The Canadian Prairies should see mostly dry conditions. Temperatures should average above normal.
Chart Analysis: Trends in Chicago are mixed to down with objectives of 645 and 602 May. Support is at 668, 654, and 648 May, with resistance at 692, 712, and 724 May. Trends in Kansas City are mixed. Support is at 853, 843, and 823 May, with resistance at 882, 888, and 896 May. Trends in Minneapolis are mixed to down with objectives of 840, 823, and 814 May. Support is at 867, 860, and 846 March, and resistance is at 887, 899, and 910 May.
• RICE:
General Comments: Rice was lower again yesterday, and trends are down on the May daily charts. Futures have been in a massive move lower for the past week. Demand has been good from domestic sources and offers seem hard to find right now. Export demand has been uneven and was low last week. Export demand has been an issue for the market all year. Mills are milling for the domestic market in Arkansas and are bidding for some Rice. Markets from Texas to Mississippi are called quiet. Demand in general has been slow to moderate for Rice for exports. Planting remains active in Texas and southern Louisiana with field conditions called very good in Louisiana and too dry in parts of Texas.
Overnight News: The Delta should get scattered showers. Temperatures should be above normal.
Chart Analysis: Trends are down with no objectives. Support is at 1625, 1620, and 1606 May and resistance is at 1671, 1689, and 1700 May.
• CORN AND OATS
General Comments: Corn and Oats closed higher yesterday, with Corn higher on reports of increased demand of cash grain and forecasts for improved field working conditions this week keeping farmers from selling as the weather is expected to turn drier and warmer for much of the central US. US prices are currently very competitive with those from South America as Brazil concentrates on Soybeans exports and not Corn and US demand has improved because of the price differentials and the lack of a Brazil offer into the market. This trend should continue for the next few months if not longer. Prices from South America should now remain strong as countries there concentrate on Soybeans exports and not Corn. NOAA is forecasting that La Nina will develop this Summer and replace El Nino. US growing conditions are usually good when this happens.
Overnight News:
Chart Analysis: Trends in Corn are mixed. Support is at 638, 628, and 625 May, and resistance is at 655, 660, and 668 May. Trends in Oats are down with objectives of 317 May. Support is at 334, 328, and 315 May, and resistance is at 353, 360, and 369 May.
• SOYBEANS
General Comments: Soybeans and the products were lower yesterday on reduced demand ideas for US Soybeans. Reports from Brazil show that basis levels there are under pressure due to the large crop being harvested now. The basis might get higher later in the marketing period as total South American production is probably about the same as last year. Brazil has a very good crop, but the additional Soybeans grown in Brazil will be wiped out by the losses in Argentina. Argentina has been forced to import from Brazil to keeps its crushing facilities operating. Soybeans export demand is flowing to Brazil now. It remains hot but rains are reported in Argentina and crop conditions are getting stable. Forecasts from NOAA for very good growing conditions in the Midwest were also a factor, but there is too much rain in most growing areas right now. Warmer and drier weather is in the forecast for this week, so some areas can get started with fieldwork
Overnight News:
Chart Analysis: Trends in Soybeans are mixed to down with objectives of 1485 and 1463 May. Support is at 1483, 1471 and 1462 May, and resistance is at 1507, 1527, and 1532 May. Trends in Soybean Meal are mixed to down with objectives of 428.00 May. Support is at 446.00, 425.00, and 422.00 May, and resistance is at 459.00, 469.00, and 475.00 May. Trends in Soybean Oil are mixed. Support is at 5390, 5130, and 5000 May, with resistance at 5630, 5810, and 5980 May.
• CANOLA AND PALM OIL
General Comments: Palm Oil closed higher again yesterday on follow through buying on a lack of offer from Indonesia. Trends are mixed on the daily charts despite news that OPEC was cutting oil production again. There are ideas are that prices can remain elevated due to bad weather in Malaysia but demand remains weaker than hoped for from India and China. Indonesia has not been offering as it tries to build stocks for its own bio fuels industry but it is expected to start offering very soon. Canola was higher yesterday on planting and fieldwork delays. Forecasts for warmer weather to show up in the Prairies this week could start to allow for fieldwork to start. Brazil is expected to dominate the oilseeds market for the next few months. Reports indicate that domestic demand has been strong due to favorable crush margins.
Overnight News:
Chart Analysis: Trends in Canola are mixed. Support is at 756.00, 745.00, and 733.00 May, with resistance at 781.00, 789.00, and 798.00 May. Trends in Palm Oil are mixed to down with objectives of 3650 June. Support is at 3800, 3700, and 3680 June, with resistance at 3870, 3980, and 4050 June.
Midwest Weather Forecast: Mostly dry conditions. Temperatures should average above normal.
Read Full Story »»»
DiscoverGold
Softs Report: Cotton, OJ, Coffee, Sugar, Cocoa
By: Jack Scoville | April 11, 2023
• COTTON
General Comments: Cotton was lower yesterday on anticipation of the USDA supply and demand reports to be released today. The weekly export sales report was weaker last week but still featured buying from Vietnam and China. Prices were higher after the release of the report on Thursday and built on the gains on Friday. Ideas are that the world economic problems were fading into the background as the US stock market has rallied. Chart trends turned up. Chinese buying should stay strong as the country improves economically as it opens up from the covid lockdowns.
Overnight News: The Delta will get scattered showers and storms and above normal temperatures. The Southeast will see scattered showers and above normal temperatures. Texas will have mostly dry conditions and above normal temperatures. The USDA average price is now 80.06 ct/lb. ICE daily certified stocks are now 1,485 bales, from 1,485 bales yesterday. USDA said that Cotton is now 6% planted. From 4% last week, 7% last year, and 7% average.
Chart Trends: Trends in Cotton are mixed. Support is at 82.00, 80.30, and 79.80 May, with resistance of 84.90, 84.60 and 85.30 May.
• FCOJ
General Comments: FCOJ closed higher yesterday in range trading. Trends remain mostly up in the market. Futures remain supported by very short Orange production estimates for Florida. Demand is thought to be backing away from FCOJ with prices as high as they are currently. Historically low estimates of production due in part to the hurricanes and in part to the greening disease that have hurt production, but conditions are significantly better now with scattered showers and moderate temperatures. The weather remains generally good for production around the world for the next crop including production areas in Florida that have been impacted in a big way by the two storms seen previously in the state. Brazil has some rain and conditions are rated good.
Overnight News: Florida should get mostly dry conditions. Temperatures will average above normal. Brazil should get scattered showers and near normal temperatures.
Chart Trends: Trends in FCOJ are mixed to up with no objectives. Support is at 270.00, 260.00, and 257.00 May, with resistance at 287.00, 293.00, and 299.00 May.
• COFFEE
General Comments: New York closed a little lower and London was closed yesterday despite ideas of little on offer from producers and reports of increasing demand. The Robusta market has been especially tight and has been pushing on the Arabica price. Producers in Vietnam are said to have low stocks left to sell and producers in Colombia and Brazil are also reported to be short Coffee to sell. The lack of offers from South America and Vietnam is still supporting prices and reports indicate that demand for Robusta from Vietnam is strong and increasing due to cost differentials with Arabica. Differentials are now weakening in Brazil, Honduras, and Colombia, but reports indicate that differentials might start to firm up again as production ideas are low for Colombia and Brazil.
Overnight News: ICE certified stocks are lower today at 0.729 million bags. The ICO daily average price is now 173.40 ct/lb. Brazil will get scattered showers with near to above normal temperatures. Central America will get mostly dry conditions. Vietnam will see isolated showers.
Chart Trends: Trends in New York are mixed to up with no objectives. Support is at 180.00, 177.00, and 172.00 May, and resistance is at 190.00, 193.00 and 197.00 May. Trends in London are up with objectives of 2320 May. Support is at 2250, 2210, and 2160 May, and resistance is at 2330, 2360, and 2390 May.
• SUGAR
General Comments: New York closed higher and London was closed yesterday as the overall bull market held. Trends are up on the daily and the weekly charts. Indian production is thought to be less than 33 million tons this year as mills are closing early there and Pakistan also has reduced production. India has produced 30.0 million tons of Sugar so far this season, down 3.3% from last year. Thailand mills are also closing earlier than expected so the crop there might be less. New crop Brazil production is solid this year but is still in the fields. Brazil producers are currently active in the futures market placing hedges on the production. European production is expected to be reduced again this year. Some analysts now say that Chinese production could be the lowest in six years due to bad growing conditions.
Overnight News: Brazil will get scattered showers. Temperatures should average near to above normal. India will get mostly dry conditions and near to above normal temperatures. ICE said that 140 notices were posted against May Sugar 16 futures this morning.
Chart Trends: Trends in New York are up with no objectives. Support is at 2220, 2180, and 2140 July and resistance is at 2360, 2390, and 2420 July. Trends in London are up with no objectives. Support is at 630.00, 619.00, and 605.00 August and resistance is at 653.00, 659.00, and 665.00 August.
• COCOA
General Comments: New York closed mixed to higher and London was closed yesterday. Wire reports suggest that producer selling increased on the recent rally in these markets. Trends remain up for at least the short term. Talk is that hot and dry conditions reported earlier in Ivory Coast could curtail main crop production, and main crop production ideas are not strong. Mid crop production ideas are strong due to rains mixed with some sun recently reported in Cocoa areas of the country. Ghana has reported a disease in its Cocoa to hurt production potential there, but overall production expectations are high. The rest of West Africa appears to be in good condition. The weather is good in Southeast Asia. Ivory Coast Cocoa arrivals are now estimated at 1.779 million tons, down 4.8% from last year. Callebaut said yesterday that overall chocolate volume has fallen by 3.6% in the first six months with reductions in Europe and Americas outweighing a small increase in Asia.
Overnight News: Isolated showers are forecast for West Africa. Temperatures will be near to above normal. Malaysia and Indonesia should see scattered showers. Temperatures should average near normal. Brazil will get isolated showers and near to above normal temperatures. ICE certified stocks are higher today at 5.377 million bags.
Chart Trends: Trends in New York are mixed. Support is at 2850, 2820, and 2780 May, with resistance at 2960, 2990, and 3020 May. Trends in London are mixed to up with objectives of 2170, 2180, and 2220 May. Support is at 2150, 2100, and 2070 May, with resistance at 2200, 2230, and 2260 May.
Read Full Story »»»
DiscoverGold
Grain Traders Buckle Up Your Chinstrap. The Corn & Ethanol Report
By: Daniel Flynn | April 11, 2023
We kickoff the day with NFIB Business Optimism Index at 5:00 A.M., Redbook YoY at 7:55 A.M., Crop Production USDA Supply/Demand and WASDE Reports at 11:00 A.M., 3-Year Note Auction at 12:00 P.M., Fed Harker Speech at 3:00 P.M., API Energy Stocks at 3;30 P.M., and Fed Kashkari Speech at 6:30 P.m.
On the Corn Front the market rallied with old crop leading the way with May 10 ½ cents higher, July 10 ¾ cents higher, and September & December each up 6 cents. The drought in the Southwest corn belt along with delays in the Northern plains offset expectations for good planting progress in the Midwest. Export Inspections at 32 million bushels were in line with expectations. YTD commitments at 794 million are down 37% from aa year ago. Funds were short covering and reversed their net short position to roughly 21, 500 long positions. Plantings were slightly ahead of last week. Corn planting is underway in 7 states, Illinois, Kansas, Kentucky, Missouri, North Carolina, Tennessee. And Texas. We will be waiting to decipher the Crop Production USDA Supply/Demand and WASDE data due out at 11:00 A.M., late this morning. In the overnight electronic session the May corn is currently trading at 653 ½ which is a ½ of a cent lower. The trading range has been 657 ½ to 652.
On the Ethanol Front the Indian Express newspaper report ethanol supplies in Maharashtra are expected to fall this season due to low sugarcane yields and production with just 1.27 million liters produced compared to the 1.32 million liters expected. As such, sugarcane mills are not expected to meet their contracted volume commitments of ethanol supply but there is a hope the state’s 12% blending mandate will still be achieved thanks to grain-based ethanol production. The crush has nearly come to an end this season with just six of the state’s mills still crushing. With the Renewable Fuels Association and the US Grains Council pushing to export more ethanol fuel and biodiesel to Latin America and many other destinations on the globe like Japan the US ethanol industry could be a driving force in the world market, this could further open up more doors. Remember the US is the largest producer of ethanol with Brazil coming in second controlling 82% of the world’s ethanol. There were no trades or open interest in ethanol futures.
Read Full Story »»»
DiscoverGold
Cuts Are Coming. The Energy Report
By: Phil Flynn | April 11, 2023
OPEC Plus Russia is becoming Biden’s worse nightmare! Ok, maybe his worst nightmare along with security leaks, cities where crime rates have gone through the roof, but you get my drift. As we see demand start to rise, we are seeing OPEC cut back and that means oil prices should have found its floor.
The latest evidence that OPEC is serious about cutting production comes from Energy Intelligence. The group reported that crude oil output in March by OPEC-plus members taking part in the production agreement saw its steepest fall in 10 months, or 680,000 b/d, to 37.64 million b/d, according to Energy Intelligence’s assessment. The bulk of the decline came from Russia and Nigeria, which together accounted for 440,000 b/d, or almost two-thirds, of the monthly reduction. The March production was 2.5 million b/d short of OPEC’s target for the month, the largest shortfall since October.
There are some who are saying that OPEC is cutting production because they are seeing signs that demand is not so strong. Yet the evidence seems to be flying in the face of that argument. Reuters reported yesterday that India’s fuel consumption jumped to a record high in March, data showed on Monday. Consumption of fuel, a proxy for oil demand, rose by 5% from a year earlier to 4.83 million barrels per day (20.5 million tonnes), the highest recorded data going back to 1998 from the Indian Oil Ministry’s Petroleum Planning and Analysis Cell.
Also, reports that China’s demand growth has been somewhat disappointing seems to be ignoring the fact that China imported a record amount of crude oil. China National Petroleum Corporation’s Economics and Technology Research Institute (ETRI) said in its annual industry outlook released at the end of last month that China’s crude oil imports will average 10.8 million barrels per day (bpd) in 2023, matching the previous record high from 2020.
So, I am not buying the argument that OPEC cut production because they saw that demand was weak. I think OPEC and Russia cut production in response to the fact that the Biden administration decided to manipulate the price of oil with Strategic Petroleum Reserve releases. I think OPEC is responding to the fact that Europe put a price cap on oil. I believe the OPEC cut its payback.
The US inventory report this week will get a little help from the Strategic Petroleum Reserve as we saw another 1.6 million barrels of oil released last week. The amount was from previously agreed to government mandated release and is a far cry from the massive releases we saw earlier in the year and that puts the Strategic Petroleum Reserve at 369.6 million barrels. The 1.6 million barrels released last week surprisingly was sweet oil.
As we have pointed out before, one of the reasons why oil prices stayed somewhat reasonable this year was because of an incredibly warm winter in Europe and the United States. The Energy Information Administration (EIA) acknowledged that mild temperatures reduced U.S. household heating fuel consumption last winter and the EIA said, “Since October, our estimates of heating oil consumption fell by 9% and prices by 2%. They estimated that the average U.S. household that uses heating oil as its primary space heating fuel, consumed 470 gallons of heating oil this winter, down 9% from the October estimate of 519 gallons. Warmer-than-normal winter temperatures reduced consumption, particularly in the Northeast. Overall, 4% of U.S. households use heating oil as the primary space heating fuel, mostly located in the Northeast.
In March they estimated that consumer prices averaged $4.45 per gallon, slightly ($0.09) lower than we forecast in October. We expect U.S. household expenditures for heating oil to average $2,094 for the 2022–23 winter heating season, down more than 11% from the initial October estimate of $2,354. Although heating oil costs are lower than we had previously expected, the cost was 13% higher compared with the 2021–22 winter heating season.
The EIA sat that at the beginning of the winter they expected Russia’s full-scale invasion of Ukraine and subsequent sanctions would limit Europe’s supply of heating oil, and record-high natural gas prices would lead to fuel switching from natural gas to distillate fuel (which includes heating oil and diesel fuel), contributing to higher heating oil prices. Warmer-than-normal winter temperatures in Europe reduced distillate demand below our initial estimates, and imports into Europe from the Middle East and Asia helped offset the loss of imported distillate from Russia and increased inventories.
Merger mania as well as an ambitious plan for carbon capture seems to suggest that the long-term outlook for fossil fuel demand continues to be very strong. Pioneer Natural Resources Co’s (PXD.N) shares rose as much as 8.5% on Monday following a report that Exxon Mobil Corp (XOM.N) held preliminary talks with the U.S. shale oil producer about a possible acquisition according to Reuters. This is Exxon’s big move to build dominance in the Permian Basin. It also is a bet that shale oil and gas will be a profitable play. The Wall Street Journal said, “Exxon, which has been on the prowl in the Permian Basin for months, has also discussed a potential deal with Occidental and at least one other company, the Journal reported. Such a transaction would send the strongest signal yet that drillers in the Permian, the hottest U.S. oil field, are set to bulk up through acquisitions. Oil companies boast healthy balance sheets that give them the stomach and means to shop for targets.
Mitch Shedlock at Mish Talk writes that, “Occidental Petroleum is making a billion-dollar bet on using tennis court sized fans to suck carbon dioxide from the air. He writes that when they start running in 2024, the fans will suck massive amounts of carbon dioxide out of the air. The carbon will be funneled thousands of feet down deep wells into geological formations, where it should remain for centuries. Removing CO2 from the atmosphere at this scale has never been done before, and the enterprise comes with abundant commercial and scientific uncertainties. The plant’s fans will pull up to 500,000 metric tons of carbon dioxide from the air a year—about as much as 111,000 American cars spew out in a year, according to the Environmental Protection Agency. The Houston-based company said it wants to build up to 135 such plants by 2035, depending on public incentives and demand for carbon credits. Fans pull air into containers, where chemicals bind with the CO2 to separate it from the air, eventually creating pellets. The pellets are heated to release pure carbon dioxide, which is compressed to be transported through pipelines and funneled deep underground.
Airbus has repurchased credits from Occidental covering 100,000 metric tons of carbon removal a year over four years, according to the companies. Mish points out that the taxpayer are also footing the bill. “The Occidental plan is possible thanks to subsidies that will cover 45 percent of the cost. He says that there are 278 million cars in the US and 1.4 billion in the world. When fully operational, Occidental’s fans will only reduce the energy of 111,000 cars.
Occidental hopes to make money by selling carbon tax credits to other companies that use unclean energy. Powering the fans requires energy. Occidental is investigating the use of mini-nuclear reactors and using energy from natural-gas powered plants that capture their own CO2. The Inflation Reduction Act signed into law by Biden last year, rewards companies that capture and store atmospheric CO2 with a $180 tax-credit.
Natural gas is desperately seeking a bottom. It looks a bit better but be cautious. While the weather forecast for late April seems to be below normal, in Europe temperatures are above normal. Just remember that just because it’s cheap it can still get cheaper. Still it’s tempting at these levels to start to build positions, especially in the back months.
Read Full Story »»»
DiscoverGold
Drought in Key Regions for Major U.S. Crops
By: Mish Schneider | April 10, 2023
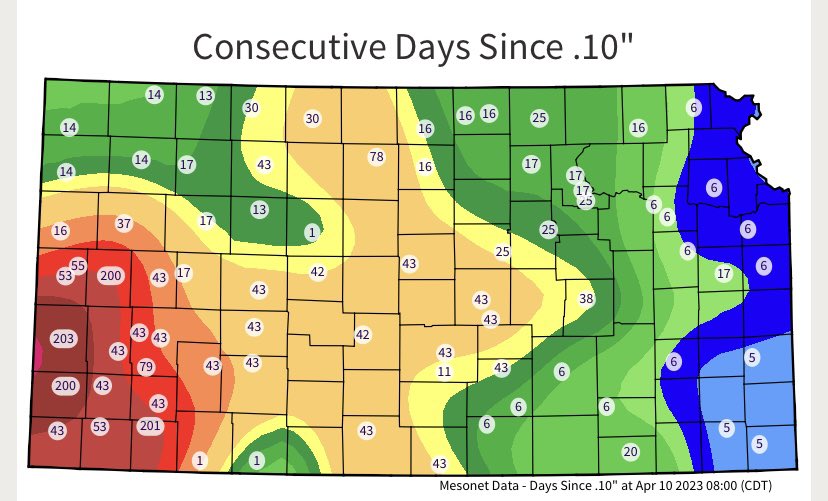
The chart shows how many days have passed since any significant rain in the major crop growing regions in the U.S.
Initial yield estimates for this year's U.S. winter wheat crop have been hammered by persistent drought. 12 Southwest Kansas counties dominate the area of drought. Wheat, corn, and oats are the major crops. Yet the futures prices do not reflect these growing (pun intended) concerns.
Part of the reason is that Russia, the main exporter of wheat, is selling the grain at a huge discount.
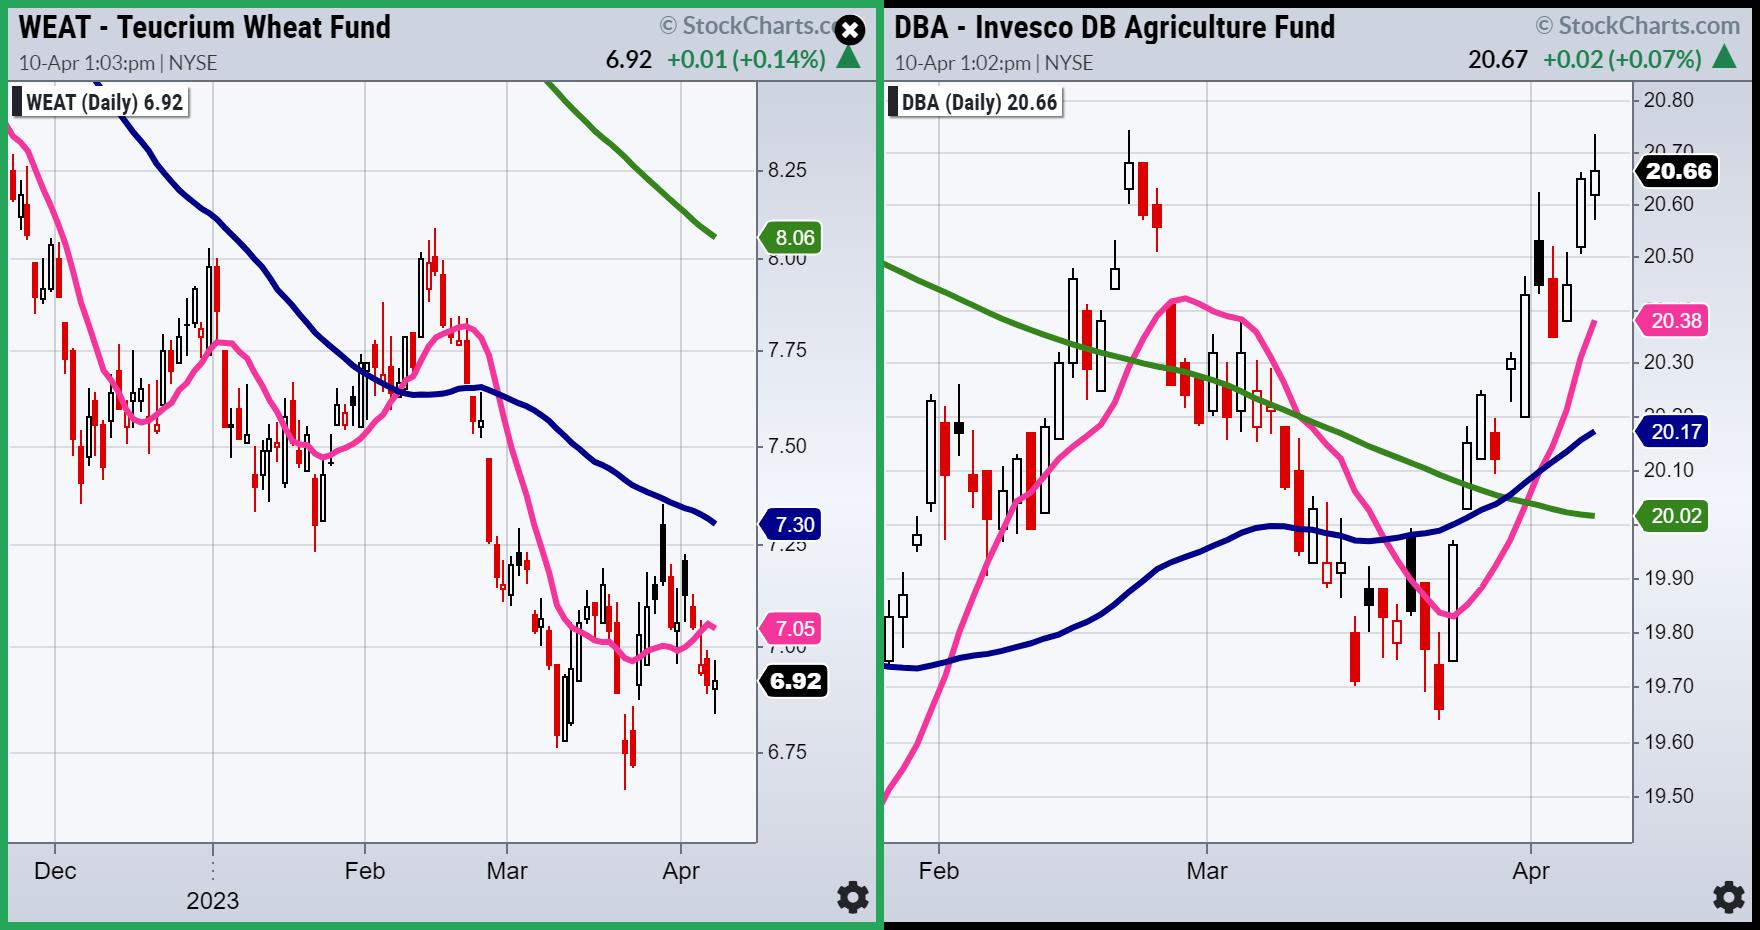
However, a couple of weeks ago on March 28th, we featured the agricultural ETF DBA as a buy opportunity. And over this past weekend, our Market Outlook mentions that one huge risk off indicator is that the "Soft Commodities (DBA) made a golden cross right as they are running into multi-month technical resistance and are already at potentially overbought levels on both price and momentum. according to Real Motion. However, if DBA takes out the $21 level, then it would signal a breakout of a multi-year base."
So here we are with drought, technical resistance, and another very low risk entry for wheat or WEAT the ETF.
Over the weekend, we wrote about Regional Banks (KRE) as a potential double bottom and key to this data-heavy week. As a side note, KRE remained green on Monday. Another push higher, and many of the picks from the weekend's Daily should also work out.
Back to mother nature, though -- 2 charts and 2 distinct perspectives. The chart on the left is of WEAT, the ETF for wheat futures. In a daily timeframe, it is in a bearish phase. Nevertheless, it is holding the March low and, through the cyan line, could set up for a long with a very good stop point.
DBA, in a strong bullish phase, now has 2 tops at 20.75 (today and in February). Should that clear, 22.00 is the next target.
Read Full Story »»»
DiscoverGold
$Natgas with a big reversal day off the bottom.
Deliveries on Live Cattle/Gasoil/Palm Oil/London Sugar
By: The PRICE Futures Group | April 10, 2023
• Today is First Notice Day for April Live Cattle.
• Wed April 12th is Last Trading Day for April Gasoil.
• Fri April 14th is Last Trading Day for April Palm Oil and May London Sugar.
Read Full Story »»»
DiscoverGold
Planting Season In Full Swing. The Corn & Ethanol Report
By: Daniel Flynn | April 10, 2023
We kickoff the day with Wholesale Trade at 7:30 A.M., Wholesale Inventories MoM at 9:00 A.M., Export Inspections at 10:00 A.M., 3-Month & 6-Month Bill Auction at 10:30 A.M., Crop Progress at 3:00 P.M., and Fed Williams Speech at 3:45 P.M.
On the Corn Front Brad Haire with Southeast Farm Press reported, Larry Ford farms in Greenwood, Fla., in the states panhandle said, “every year is different. You can farm for many years, in my case more than 50, but you haven’t farmed this year yet.” Crop Progress is mostly ahead of schedule and we will receive further evidence on today’s Crop Progress report. The market has been trading mainly in a choppy tight trading range. In the overnight electronic session the May corn is currently trading at 643 ¼ which is a ¼ of a cent lower. The trading range has been 645 to 641 ½.
On the Ethanol Front in March a delegation of public and private sector representatives from Mexico, Costa Rica, Ecuador, Panama and Columbia traveled to North Dakota to see the US ethanol industry in action before attending the Renewable Fuels Association’s National Ethanol Conference in Orlando, Fla. Hosted by the North Dakota Corn Utilization Council, the team visited a corn farm, a grain elevator and ethanol plant, and met with David Ripplinger of North Dakota State while in the state. “This mission allowed our Latin America and Mexico delegation members to learn first-hand about ethanol production and the supply chain in the United States, as well as to hear about the latest events and innovations in the biofuels sector,” said Federico Salcedo, USGC regional ethanol consultant. “We hope this mission will allow the delegation to return to their countries and continue promoting the biofuels policies that will have a great social, economic and environmental impact.”
Read Full Story »»»
DiscoverGold
Life in the Eighties. The Energy Report
By: Phil Flynn | April 10, 2023
Oil prices are getting used to oil in the eighty-handle supported by coming OPEC production cuts as well as rising geopolitical risk. China’s tensions with Taiwan and the ongoing Russia war in Ukraine continues to have influence on OPEC plus Russia decisions. The $60.00 a barrel price cap farce on Russian oil looks like it is backfiring as China and India suck down Russian oil and Japan is already asking for a waiver as they need to get Russian supply. What that means is that oil should start building a floor at $80.00, working toward the high end of the $80.00 handle in the coming weeks.
That means it is going to be a very expensive summer at the gas pump. Gas prices are already on the rise up almost $10 a gallon from last week. AAA reported that the national average for regular gas is $3.604 per gallon up from $3.506 from a week ago. US gasoline supplies are 7% below average range for this time of year while demand for gasoline is surging. The Energy Information Administration (EIA) pegged demand at a 4-week average of 9.0 million barrels a day, up by 3.9% from the same period last year. While we will see refiners ramp up, being this far behind on supply does not bode well for prices especially as oil prices go higher and China oil imports are expected to increase by 500,000 and 1 million barrels per day (bpd) this year to as high as a record breaking 11.8 million barrels per day reversing previous two years’ decline to exceed 2020’s record of 10.8 million bpd.
Because of that strong demand in China, it is reported that Saudi Arabia will keep supplying at some refiners across Asia with full contractual volumes of crude despite the 500,000-barrel production cut.
What that means is for other parts of the world oil from Saudi Arabia will become much tighter. And as we know Saudi Arabia doesn’t think they’re going to have any problems selling that oil in Asia because they raised their official selling price even before the official announcement of the OPEC production cut. So Saudi Arabia can have its cake and eat it to.
The US has drained the Strategic Petroleum Reserves so there’s not going to be a lot of relief coming from the Biden administration when it comes to rising gasoline prices this summer. The Biden administration energy policy has allowed Saudi Arabia and OPEC to have more sway over global prices than they’ve had pretty much since the rise of the US shale revolution. This was a huge strategic misstep by the Biden administration.
The diesel situation isn’t much better. Medium and sour grades of crude oil are still commanding higher prices than normal because of the global diesel shortage. Diesel supplies in the United States according to the EIA, are about 12% below the five-year average for this time of year your refiners must focus on gasoline as well and so it’s going to be a real battle for refiners to keep the market well supplied.
The Financial Times is reporting that, “The Chinese navy has conducted 120 flight sorties from an aircraft carrier over the past three days, Japan said on Monday, highlighting the concerns that Beijing’s war games around Taiwan have raised for the US and its allies in the Indo-Pacific region.” The FT said, “Beijing launched the maneuvers on Saturday to “punish” Taiwan after President Tsai Ing-wen met House Speaker Kevin McCarthy in California last week. But the drills, which the People’s Liberation Army on Monday said its forces had successfully completed, have given China the opportunity to train its armed forces, and took place in proximity to Japan and US forces, the bulk of which are stationed in Okinawa.
Another major embarrassment for the Biden administration was a huge national security leak coming from inside the Pentagon. The Wall Street Journal reported that, “Russia could achieve its long-sought goal of air superiority in Ukrainian skies as early as May because Ukraine is running out of antiaircraft missiles, according to purported Pentagon presentations that have leaked on social media. The Journal said that, “The Pentagon and the Justice Department began an investigation last week into document leaks when some purported U.S. Department of Defense presentations were posted by Russian propagandists on Telegram on Thursday. The Wall Street Journal, which viewed these documents and a larger trove that emerged on Friday, hasn’t been able to independently verify their authenticity. Pentagon spokeswoman Sabrina Singh said Sunday that the U.S. continued to assess the validity of the documents “that appear to contain sensitive and highly classified material.” She said the U.S. had discussed the matter with allies over the weekend and was weighing the potential national security impact of the breach.” Thank goodness the so-called adults are in charge.
After last week petroleum draw, we should see a bit of a rebound. Look for crude to be up 1.0 million barrels and gas and diesel to be up 2.0 million barrels. Refinery runs up 0.5.
Natural gas is flirting with falling below $2 again. Shoulder season is not going to be very kind to this market. Looks like we will see our first injection into storage with an expectation of an increase somewhere around 29 BCF.
Read Full Story »»»
DiscoverGold
Coffee Prices Suddenly Boosted by Downbeat Forecasts
By: Investing.com | April 6, 2023
May Arabica Coffee rose 3.09% and May ICE (NYSE:ICE) ICE) Robusta coffee (RMK23) rose 2.17% on Wednesday, April 5. ICE Arabica stocks tightened to support prices after ICE monitored them on Tuesday, falling to a 3.5-month low of 732,533 bags. Worldwide coffee prices are supported by fewer coffee exports globally.
Indeed, shortly after cocoa futures staged their own price rally, coffee prices rose sharply as well, with Arabica hitting a 1-week high and Robusta climbing to the next futures high in 7.5 months. Falling global coffee exports point to tighter supply, with commodity funds buying the closer coffee futures after the International Coffee Organization (ICO) reported that global coffee exports fell 8.7% YoY from October to February to $48.66 million.
Thus, Robusta gained support amid global supply concerns after coffee retailer Volcafe predicted the global Robusta coffee market would be short of a record 5.6 million bags in 2023/24 session. Elsewhere, coffee production in Indonesia, the world's third-largest Robusta coffee producer, will fall 20% YoY to 9.6 million bags in 2023 due to damage caused by excessive rainfall in growing areas, the Indonesian, the world's third-largest Robusta producer, Coffee Exporters and Industry Association reported.
Let’s remind, that the USDA reduced its forecast of worldwide coffee production for 2022–2023 from 175 million bags in June to 172.8 million bags in its biannual report, which was published on December 23, 2022. In addition, the USDA decreased its estimate of the world's coffee ending stocks for 2022–2023 from 34.7 million bags in June to 34.1 million bags, showing a reduction of 1.7%. Also, on November 22, the USDA's Foreign Agricultural Service (FAS) reduced its forecast for Brazil's coffee production in 2022–2023 by 2.6% to 62.6 million bags from an earlier estimate of 64.3 million bags. Brazil's biannual coffee crop was projected to yield more this year, but the drought drastically downplayed such hopeful expectations.
More importantly, some institutional commodity research contributors downgraded their estimates for Brazil's Arabica coffee production to 42.7 million bags from 44 million bags back in February, citing heavy rains in southern Minas Gerais that led to the spread of disease. Another positive for Arabica prices is the National Federation of Coffee Growers' forecast published on March 3, saying that first-year coffee production in Colombia, the world's second-largest producer of Arabica coffee, will drop 4.8% YoY by mid-2023 to 5 million coffee bags as excess rain and cloudy weather affect yields.
The second-largest producer of coffee in Central America, Guatemala, revealed that its exports of 172,439 bags declined 8% YoY in January. The Colombia Coffee Producers Organization reported Colombia's February coffee exports decreased 6% YoY to 928,000 bags on March 13. Brazil's February green coffee exports slumped -35.8%YoY to 2.11 million bags. In contrast, representing a rare bright spot, exports of Honduran Mar coffee increased by 14% YoY to 1.097 million bags. The largest exporter of Arabica beans from Central America is exactly Honduras.
All in all, the ICO predicted on March 10 that the worldwide 2022–2023 coffee market will experience a shortfall for a second straight year, following the 4–5 million bag deficit in 2021/22 brought on by problems with the arabica crop. Summary of Outlook:
Since both global and local coffee authorities, namely, the International Coffee Organization (ICO), on one hand, and the Colombia Coffee Growers Federation and the Association of Indonesian Coffee Exporters and Industries – are pointing to shortfalls in coffee supplies – coffee prices will likely lose their fragile support of the recent months, and resume their upward pressure. Taking account, that this may become the second consecutive year of coffee supplies’ deficiency – the prices, all other things being equal – are capable of staging a full-fledged rally soon. Trying to define the target, we may offer an idea that it will be proportionate to 6-7% overall export drop, plus benchmark inflation rate estimate – which will likely arrive at 13-14% appreciation, all other things being equal.
Read Full Story »»»
DiscoverGold
Today's Futures Heat Map • Strongest: Sugar, Cotton, Palladium, Coffee
By: Barchart | April 6, 2023
• Today's Futures Heat Map
Strongest: Sugar, Cotton, Palladium, Coffee
Weakest: Natural Gas, Heating Oil, Orange Juice, Corn

Read Full Story »»»
DiscoverGold
Deliveries on Live Cattle/ICE Gas Oil
By: The PRICE Futures Group | April 6, 2023
• Mon, April 10th is First Notice Day for April Live Cattle.
• Wed, April 12th is LTD for April ICE Gas Oil.
Read Full Story »»»
DiscoverGold
Turning the Screws. The Energy Report
By: Phil Flynn | April 6, 2023
It you thought the OPEC production cut was going to be the only indignity that Saudi Arabia would direct at the Biden administration, well you had better think again.
Saudi Arabia raised the official selling price for May – loading Arab Light to Asia by 30 cents a barrel from April to $2.80 a barrel over Oman/Dubai quotes. This increase was a sign that Saudi Arabia feels pretty darn confident that they could raise their price for oil despite some concern about the global economy without any ill effects. This comes on a day when the foreign ministers of Iran and Saudi Arabia met on Thursday in their first formal talks in 7 years hosted by the Chinese foreign ministry in Beijing. The price increase move also sent a message that Saudi Arabia is going to stand up to the Biden administration’s feeble attempts to control oil prices with SPR releases attempts to cap oil prices at a time when US petroleum prices are getting uncomfortably low. Biden and his team may have missed an opportunity to refill the reserve and that will come back to haunt us all.
The Energy Information Administration report should get the Biden Administration very worried. While the price reaction was somewhat muted because of weak ADP jobs reports and a big drop-in US service sector data, the reality of gasoline supplies falling seven weeks in a row is a signal that gas prices at the pump are getting ready to spike. The EIA reported another huge 4.1 million barrels drop in gasoline supply, putting them 7% below the five-year average. That comes as gasoline demand is on the rise. Not only was it up week over week, it was also reported that US consumers bought 390.4 million gallons of gasoline per day last week. That is +30.8 million barrels year over year.
U.S. commercial crude oil inventories did not fare much better. The EIA reported that crude supplies fell by decreased by 3.7 million barrels from the previous week. At 470.0 million barrels, U.S. crude oil inventories are about 4% above the five-year average for this time of year. Yet I remind you that 4% is misleading as the US SPR, because of Biden’s unprecedented release from the reserve, is at the lowest level since 1982.
Distillate fuel inventories decreased by 3.6 million barrels last week and are about 12% below the five-year average for this time of year. Farmers will be getting to work planting and demand for diesel will rise. Total commercial petroleum inventories decreased by 11.0 million barrels last week. Demand is pretty much back to one year-ago levels. While the EIA says that demand based in total products supplied over the last four-week period averaged 20.1 million barrels a day, down by 1.5% from the same period last year, it partially reflects poor planting start.
Gasoline demand over the past four weeks, motor gasoline product supplied averaged 9.0 million barrels a day, up by 3.9% from the same period last year. Distillate fuel product supplied averaged 3.9 million barrels a day over the past four weeks, down by 0.1% from the same period last year. Jet fuel product supplied was up 6.1%.
There may be some hope on gas though as Reuters reports that the Exxon Mobil Corp has completed the startup of a new $2 billion crude distillation unit (CDU) at its Beaumont, Texas, refinery, making the plant the second largest in the United States, said people familiar with plant operations. The new 250,000 barrel-per-day (bpd) Crude C CDU lifts the Beaumont refinery’s capacity to 619,024 bpd, second only to the Motiva Enterprises (MOTIV.UL) refinery in nearby Port Arthur, Texas, the people said according to Reuters.
Despite reports of a deal, Iraq’s northern oil exports to Turkey have not yet resumed, sources told Reuters on Thursday, leaving several fields shut in the semi-autonomous Kurdistan region.
Now we know that Biden thinks his energy policy is more virtuous that President Trump’s “drill baby drill” policy but there are signs that the road to climate hell is paved with good intentions. Only has the war in Ukraine led to the burning of more coal and dirtier fuels, the Russian price caps are taking oil on longer routes that add to greenhouse gases. Oil transported by rail also adds to the so-called greenhouse gases.
The upside risk for oil and products is substantial. Some people are worried about the OPEC supply cut gap, but the consolidation is making thinks look like it’s getting ready for another spike.
Read Full Story »»»
DiscoverGold
$WTIC/$Brent are continuing to hold the gap up.
Today's Futures Heat Map • Weakest: Palladium, Platinum, Soybean Meal, Wheat
By: Barchart | April 5, 2023
• Today's Futures Heat Map
Strongest: Coffee, Orange Juice, Gasoline, Heating Oil
Weakest: Palladium, Platinum, Soybean Meal, Wheat

Read Full Story »»»
DiscoverGold
Midday Redness In Soy Market
By: Barchart | April 5, 2023
The soybean trade is working 2 3/4 to 4 cents lower so far through the midweek session. May beans have printed a 21 cent range so far. Soymeal is trading with $5.70 to $6.90/ton losses so far. BO futures are down 13 to 20 points at midday.
USDA confirmed a private export sale of 276k MT of old crop soybeans to unknown destinations this morning.
AgRural reported the Brazilian soybean harvest at 76% complete – up 6% points from last week but still trailing the rapid 81% pace last year. StoneX raised their soybean production outlook by 3 MMT for Brazil to 157.7 MMT, with 96 MMT of exports for 22/23. Official Brazilian export data showed 13.27 MMT of soybeans were exported in March. That was up from 12.19 MMT last year.
Argentina’s latest ‘soy-dollar’ preferential exchange rate, the 3rd of its kind, is set to roll out on Wednesday. This plan will lock in a 210 peso/dollar exchange rate for soybeans and soy products sold for export from Wednesday – May 31. The current ratio is 210.8099 pesos to $ - compared to 60/1 before covid and 170/1 at the start of 2023. The Argentine government needs the tax revenue from exports, but the severe declines in 2023 crop production will limit exports.
May 23 Soybeans are at $15.13 1/2, down 4 cents,
Nearby Cash is at $14.69 5/8, down 4 1/4 cents,
Jul 23 Soybeans are at $14.79, down 3 3/4 cents,
Nov 23 Soybeans are at $13.16, down 4 cents,
Read Full Story »»»
DiscoverGold
Coffee Prices Surge As Global Supplies Shrink
By: Barchart | April 5, 2023
May arabica coffee (KCK23) this morning is up +5.40 (+3.09%), and May ICE robusta coffee (RMK23) is up +49 (+2.17%).
Coffee prices this morning are sharply higher, with arabica posting a 1-week high and robusta posting a 7-1/2 month nearest-futures high. A decline in global coffee exports signals tighter supplies that sparked fund buying of coffee futures today after the International Coffee Organization (ICO) reported global coffee exports from Oct-Feb fell -8.7% y/y to 48.66 mln bags.
Another supportive factor for arabica coffee is a stronger Brazilian real (^USDBRL). The real Wednesday rallied to a 2-month high against the dollar, discouraging export selling from Brazil's coffee producers.
Robusta has support on global supply concerns after coffee trader Volcafe forecasted the global 2023/24 robusta coffee market would see a record deficit of 5.6 mln bags. In addition, the Association of Indonesian Coffee Exporters and Industries said that Indonesia, the world's third-largest robusta producer, will see its 2023 coffee production fall -20% y/y to 9.6 mln bags due to damage from excessive rainfall across its growing regions.
Tighter ICE arabica stockpiles support prices after ICE monitored arabica coffee inventories Tuesday fell to a 3-1/2 month low of 732,533 bags.
A bearish factor for robusta coffee is a negative carryover from last Wednesday when Vietnam's General Statistics Office reported that Vietnam's Mar coffee exports rose +9.2% y/y to 230,000 MT. Vietnam is the world's largest producer of robusta beans.
Reduced flooding concerns in Brazil's coffee fields are a negative factor for coffee prices. The drier conditions should allow farmers in Minas Gerais, Brazil's largest arabica growing region, back into coffee fields to apply fertilizers and pesticides. Somar Meteorologia reported Monday that Brazil's Minas Gerais region received 12.6 mm of rain in the week ended April 2, or 52% of the historical average. Minas Gerais accounts for about 30% of Brazil's arabica crop.
A rebound in current coffee supplies is bearish for prices after ICE robusta coffee inventories rose to a 3-1/2 month high at 7,712 lots on March 23. Also, the Green Coffee Association on March 15 reported that U.S. Feb green coffee inventories rose +5.9% y/y to 6.105 mln bags.
Arabica coffee has support after Rabobank cut its 2023 Brazil arabica production estimate last Monday to 42.7 million bags from a February estimate of 44 million bags, citing heavy rains in the south of Minas Gerais that caused diseases to spread.
Another bullish factor for arabica prices was the projection from the National Federation of Coffee Growers on March 3 that coffee output in Colombia, the world's second-largest producer of arabica coffee, will drop -4.8% y/y to 5 mln bags in the first half of 2023 as excessive rain and cloudy days hurt yields.
Smaller global coffee exports support prices. Guatemala, the second-largest coffee producer in Central America, reported its coffee exports fell -8% y/y in January to 172,439 bags. On March 13, the Colombia Coffee Growers Federation reported Colombia Feb coffee exports fell -6% y/y to 928,000 bags. Brazil's Feb green coffee exports dropped -35.8% y/y to 2.11 mln bags. By contrast, Honduran Mar coffee exports rose +14% y/y to 1.097 million bags. Honduras is Central America's biggest exporter of arabica beans.
The ICO on March 10 projected that the global 2022/23 coffee market would be in deficit for a second year following the 4 mln bag to 5 mn bag deficit in 2021/22 due to arabica crop woes. The USDA, in its bi-annual report released on December 23, cut its global 2022/23 coffee production estimate by -1.3% to 172.8 mln bags from a June estimate of 175.0 mln bags. In addition, the USDA cut its 2022/23 global coffee ending stocks estimate by -1.7% to 34.1 mln bags from a June estimate of 34.7 mln bags. Meanwhile, the USDA's Foreign Agriculture Service (FAS) on November 22 cut its Brazil 2022/23 coffee production forecast by -2.6% to 62.6 mln bags from a prior estimate of 64.3 mln bags. This year was supposed to be the higher-yielding year of Brazil's biennial coffee crop, but coffee output this year was slashed by drought.
Read Full Story »»»
DiscoverGold
Corn Fractionally Mixed For Midday
By: Barchart | April 5, 2023
Through midday the corn market is fractionally mixed, save for the May contract’s 1 3/4 cent gain. The midweek session has seen a 13 1/2 cent range so far in the May contract. Dec corn has traded between -3 3/4 to +3 3/4 cents.
Private exporters sold another 125k MT of old crop corn to unknown destinations.
The RFA reported 1.02b gallons of E-15 sales for 2022. That was a yearly record and a 26% increase from the prior year.
Safras and Mercado estimates the Brazilian 2nd corn crop at 92.2 MMT, an increase from their 87.7 MMT prior estimate. That sets the total corn output at 130.3 from 125.3 MMT. Brokerage StoneX has their estimate at 100.54 MMT for the 2nd crop and 131.3 MMT for the total output.
Brazilian export data showed 1.335 MMT of corn was shipped in March. That was up from just 14k MT last year following the 1st crop’s drought.
May 23 Corn is at $6.55 1/4, up 1 1/2 cents,
Nearby Cash is at $6.58 3/8, up 1 cents,
Jul 23 Corn is at $6.27 1/2, down 1/2 cent,
Dec 23 Corn is at $5.60 1/4, up 1/4 cent,
Read Full Story »»»
DiscoverGold
Midday Weakness For Wheat Futures
By: Barchart | April 5, 2023
So far through Wednesday the wheat futures market is working lower this far. SRW futures are down 6 to 8 cents through midday. KC Wheat futures are trading 7 3/4 to 12 1/2 cents lower. Spring wheat futures are also down by double digits with 10 to 11 3/4 cent losses so far.
At the state level, NASS crop conditions converted KS to a 230 on the Brugler500 scale. That is the lowest of the reported states on Monday, 49 points under the National 279 Brugler500 score, and the lowest initial rating for KS since at least the 2012 drought. Initial conditions in TX scored a 253 on the Brugler500 Index, which is up by 84 points from last year’s start but still 33 points lower than 2-years back.
May 23 CBOT Wheat is at $6.81 1/2, down 10 cents,
Jul 23 CBOT Wheat is at $6.94, down 10 cents,
Cash SRW Wheat is at $6.24 3/8, down 10 cents,
May 23 KCBT Wheat is at $8.61, down 11 1/2 cents,
Cash HRW Wheat is at $8.21 1/8, down 12 5/8 cents,
May 23 MGEX Wheat is at $8.76 3/4, down 12 3/4 cents,
Read Full Story »»»
DiscoverGold
Midweek Gains For Cattle Futures
By: Barchart | April 5, 2023
Cattle are trading 40 to 95 cents higher so far through Wednesday. Feeders are also working in the black with 37 to 77 cent gains. There were no sales for the 892 head on the FCE this morning as packers bid to $166 against the $170 asks. USDA reported light cash trade for Tuesday, but maintains unestablished market conditions for the week. The 04/03 CME Feeder Cattle Index was $1.34 stronger to $193.02.
USDA’s Wholesale Boxed Beef prices were $1.18 higher in Choice this morning and 77 cents lower in Select. USDA estimated FI cattle slaughter at 126k head for Tuesday. After revising Monday lower the WTD running total is now 9,000 head below last week and 3,000 head below the same week last year at 243,000 head.
April 23 Cattle are at $168.400, up $0.800,
Jun 23 Cattle are at $160.650, up $0.425,
Aug 23 Cattle are at $160.325, up $0.550,
Cash Cattle Index was $164.000, from $163.00 last week
April 23 Feeder Cattle are at $198.375, up $0.425
May 23 Feeder Cattle are at $202.925, up $0.650
Read Full Story »»»
DiscoverGold
April Hogs Standing Out
By: Barchart | April 5, 2023
Front month lean hog futures are trading with triple digit losses, save for the stand out April contract which is bouncing back by triple digits. The April-July spread is now $16.82. The National Average Morning Base Hog price was 76 cents weaker to $71.25 on 4/5. The CME Lean Hog Index for 3/31 was $75.20 after a 26 cent drop.
Pork cutout futures are also mixed with a $1 gain in April to triple digit losses in the other nearby contracts. USDA’s Pork Carcass Cutout value was 98 cents higher in the AM report to $77.83. USDA estimated FI hog slaughter at 481k head for Tuesday. That sets the WTD total at 966,000, matching last week and 7,000 above the same week last year.
April 23 Hogs are at $74.275, up $2.050,
May 23 Hogs are at $81.500, down $0.675
April 23 Pork Cutout is at $79.000, up $1.100,
Read Full Story »»»
DiscoverGold
It's time to keep an eye on soybeans - again
By: Jay Kaeppel | April 5, 2023
• Soybeans tend to rally during the late winter into early spring period. So far, this year has been a disappointment. But it might not be too late. The recent strong rebound combined with typical April behavior suggests soybean bulls may still have an opportunity.
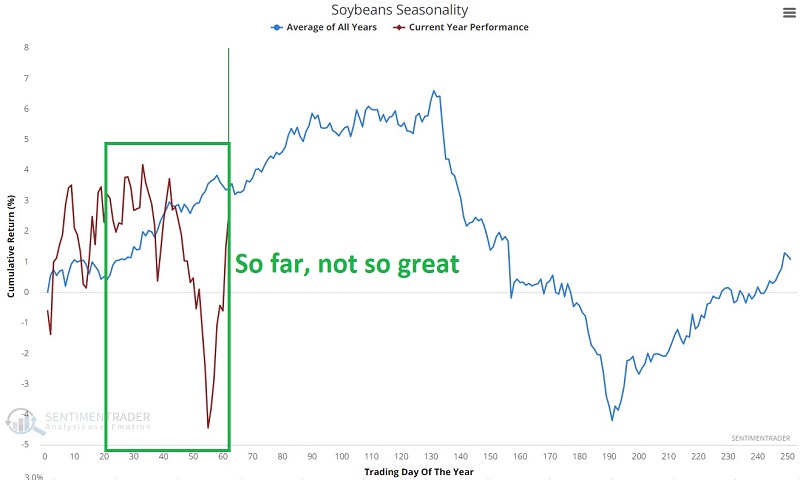
Read Full Story »»»
DiscoverGold
Implications of lumber's struggles versus gold
By: Jason Goepfert | April 5, 2023
• The ratio of lumber to gold prices has slid to a new yearly low. This is often assumed to be a negative for the economy and therefore stock prices. While it has preceded some nasty declines, most of the time it did not. It also tended to precede rallies in lumber and gold themselves.
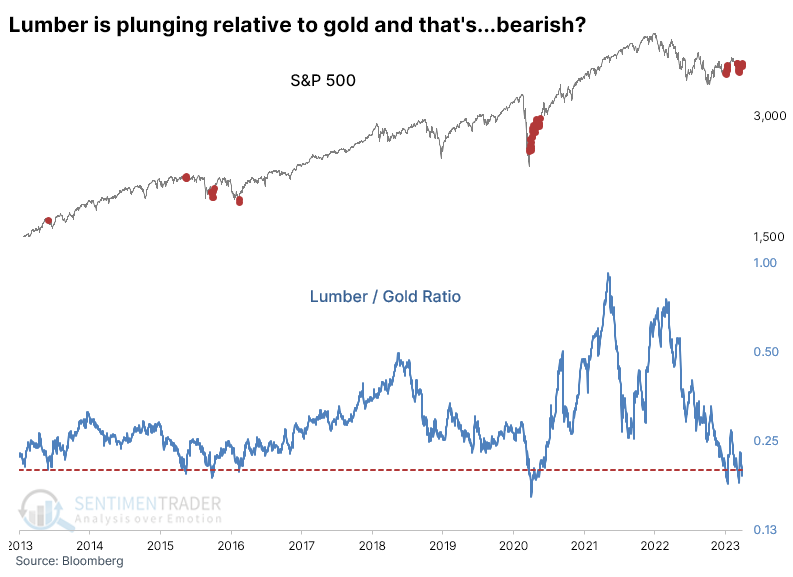
Read Full Story »»»
DiscoverGold
Japan US Biofuel Agreement Huge To Corn. The Corn & Ethanol Report
By: Daniel Flynn | April 5, 2023
We kickoff the day with MBA 30-Year Mortgage Rate, MBA Mortgage Market Index, MBA Mortgage Refinance Index, MBA Purchase Index, and MBA Mortgage Applications at 6:00 A.M., ADP Employment Change at 7:15 A.M., Balance of Trade, Exports and Imports at 7:30 A.M., S&P Global Composite PMI Final and S&P Global Services PMI Final at 8:45 A.M., ISM Non-Manufacturing PMI, ISM Non-Manufacturing Employment, ISM Non-Manufacturing New Orders, ISM Non-Manufacturing Prices, and ISM Non-Manufacturing Business activity at 9:00 A.M., EIA Energy Stocks at 9:30 A.M., 17-Week Bill Auction at 10:30 A.M., and Dairy Products Sales at 2:00 P.M.
On the Corn Front several bullish headlines will push this market higher, whether it is exports, global weather and demand, tar spots, global biofuels and ethanol. The news Japan and the United States coordinated as Japan decided to revamp and update their biofuels policies. With the US as a partner, this will improve exports of ethanol overseas, as we may have a new major player in imports of US ethanol like Canada and Mexico. This should boost corn & soybean prices as the USDA confirmed stocks are low, while demand will be big and the Renewable Fuel Standard continues to grow and make and stocks more scarce as globally countries are thinking hand to mouth for human consumption. In the overnight electronic session the May corn is currently trading at 649 which is 4 ¾ cents lower. The trading range has been 655 to 648.
Read Full Story »»»
DiscoverGold
Interference with Market Dynamics. The Energy Report
By: Phil Flynn | April 5, 2023
Oil prices continued to surge because of interference with market dynamics. That is one of the main reasons that OPEC plus surprised the market with a 1.16 million barrels per day production cut according to Russian deputy prime minister Alexander Novak.
Now some may believe that those comments are directly related to the European Union’s $60 barrel price cap on Russian seaborne oil with an adjustment mechanism to keep the cap at 5%, but really the implications of the interference with market dynamics goes much deeper than that. This comment reflects a larger issue of interference with market dynamics and global geopolitics. The real interference with market dynamics started under Biden. First it was the politically motivated canceling of the Keystone XL pipeline that had no real justification. That move was an interference in the market because the market assumed that when you are dealing with US, you are dealing with a country that is based on law. TC Energy, who acted in good faith with the US government, had to record a roughly $1.8 billion impairment charge for Keystone XL in May and formally terminated the project in June.
That move by Biden hurt the credibility of the US and interfered with market dynamics and helped discourage investment in not only US energy projects but also other type of business ventures. That interference with market dynamics also came with an unjustified drilling moratorium on Federal lands and a slowdown in drilling permits. The slowdown in lease sales and forcing ESG has interfered with market dynamics, adding inefficiencies in the system, and adding to inflation.
The other major interference into market dynamics was the misuse and abuse of the nation’s Strategic Petroleum Reserve. Biden made it clear that when he first tapped the SPR to lower gas prices it was supposed to send a message to Saudi Arabia not to mess with Biden. Yet what Biden did unwittingly was start an oil war that the Saudis are now winning. Biden should have known that the SPR is not big enough to compete with Saudi Arabia. Saudi Arabia played the long game allowing the US to drain the reserve and then get even with a production cut.
That interference with market dynamics by Biden’s energy policy sadly is starting to show-up already in US oil inventories. The American Petroleum Institute (API) reported a stunning supply drop across the board leading with a 4.346-million-barrel drop in crude oil supply and a sharp 1.035 million barrel drop in the Cushing, Oklahoma hub. Gasoline supply plunged by 3.970 million barrels and distillates also dove by 3.693 million barrels.
Now the globe is heading into a huge supply deficit. That is what I expect and so does the International Energy Agency (IEA) and the Fitch rating service. The reason why we are heading into energy shortages is mainly caused by inference in market dynamics. Short sided ESG governance programs and force-feeding investment in inefficient green energy sources and unprecedented interference in market dynamics is going to put an extreme burden on the poor and middle class and has added to increased global geopolitical instability. Biden’s discouraging US production has given OPEC more control over our daily life.
Interference with Market Dynamics is going to make it harder for refiners to meet demand. Sheela Tobben, Bloomberg News wrote that, “A shock move by OPEC and its allies to cut their mainly high-sulfur crude output is about to thrust Latin America into the spotlight as a possible source of replacements. This could turn into a battleground for US refiners wanting to keep outsiders away from those supplies just as they gear up for North America’s high-demand summer season. American buyers have for years cultivated supply lines across the Americas while large OPEC producers like Saudi Arabia steered the bulk of their oil to Asia — a region that offers the Kingdom the most profitable returns.
Competition could come when Asian refiners have already been actively purchasing heavy crudes from South America and Canada, boosting their prices. But there might not be enough to go around. Canadian barrels have been limited by seasonal maintenance and Latin American supply won’t be enough to counter the announced cuts from the Organization of Petroleum Exporting Countries alliance. That could propel heavy oil prices even higher, spurring fuel inflation.”
And if you don’t think OPEC is serious about cutting production, it’s already been reported that OPEC production fell by 80,000 barrels in March to 29.16 million barrels. Now the reports of Kurdistan and Iraq did lead to some price relief, but today’s Energy Information Administration report should send a signal to the market that supplies are tight and more than likely are going get much tighter. Oil sold off a bit after reports that oil production and exports have resumed at the Hasira oil field.
The Wall Street Journal reports, “Exxon Mobil Corp. XOM has ended a major campaign to find oil in Brazil, after coming up empty-handed on a multibillion-dollar wager that produced a series of disappointing wells, according to people familiar with the matter. After failing for the third time to find commercially viable amounts of crude in Brazil’s deep waters last year, the Texas oil giant has stopped its current drilling efforts in the offshore acreage it started snapping up with partners for $4 billion in 2017, these people said.”
We have been warning for some time that we were going to come into a situation where demand could very easily outstrip supply. We were warning during the height of the banking crisis sell off to put on hedges because we believed prices would snap back up. Hedges are still strongly recommended and exposure to oil and gas should be in your portfolio.
Natural gas is still struggling. EBW analytics put it bluntly saying that, “A stunning shoulder season weather forecast collapse has flipped a cool-leaning April outlook into forecasts vying for the warmest April in history. The meltdown in weather-driven demand has been parried by non-weather fundamentals including record LNG feedgas demand approaching 14.4 Bcf/d and pipeline constraints driving a temporary downturn in production. Still, a resurgent storage surplus vs. the five-year average may now approach 400 Bcf by late April—reviving oversupply fears and depressing natural gas.
Read Full Story »»»
DiscoverGold
Cotton On Rally So Far
By: Barchart | April 5, 2023
Cotton futures are trading with double digit gains into the midweek session so far. The cotton futures market settled Tuesday 1.1% to 1.6% in the red. That took the May contract to a net 172 point loss for the week. December’s 118 point loss on Tuesday has the contract 168 points in the red for the week-to-date.
The Dollar Index was 0.54% weaker on Tuesday, approaching the early Feb lows of 100.805. The index was priced at 101.245 at the settle.
USDA’s Ag Attaché set the Pakistani cotton crop at 5.3m bales for 23/24 rebounding from the old crop’s flooding. Despite the larger domestic output, the Attaché maintained a 4.6m bale import for 23/24. Their old crop import was 300k bales above the USDA official. For Turkey, the Attaché expects a 3.376m bale crop, a 1.561m bale loss yr/yr, citing the decline in world price. They also mentioned the Feb 6th earthquakes as being devastating to the Kahramanmaras region’s textile output, but that recovery is already underway.
The Cotlook A Index was back down by 80 points to 96.75 cents/lb. The AWP for cotton is 67.84 cents/lb.
Read Full Story »»»
DiscoverGold
Today's Futures Heat Map • Strongest: Silver, Platinum, Gold, Cocoa
By: Barchart | April 4, 2023
• Today's Futures Heat Map
Strongest: Silver, Platinum, Gold, Cocoa
Weakest: Lean Hogs, Pork Cutout, Russell 2000 E-Mini, Soybean Oil

Read Full Story »»»
DiscoverGold
Grains Report: Wheat, Rice, Corn and Oats, Soybeans
By: Jack Scoville | April 4, 2023
• WHEAT
General Comments: Wheat markets were mixed, with Kansas City and Minneapolis a little lower but Chicago a little higher. USDA did not release a condition report today but did show that Winter Wheat is now ahead of average in heading out.. Russia announced it is increasing taxes on exports of Wheat. Cargill and Viterra said that they will shut export programs in Russia and might be bowing to Russian pressure to do so as the country is moving to take more control of the export program. ADM is also considering making the move. Trends are mostly up on the daily charts. Ideas that big Russian offers and cheaper Russian prices would be a feature for a while in the world market was the driving force for the weaker prices. Ideas are that both Australia and Russia are harvesting record to near record Wheat crops this year. The demand for US Wheat in international markets has been a disappointment all year and has been hindered by low prices and aggressive offers from Russia.
Overnight News: The southern Great Plains should get mostly dry conditions. Temperatures should be above normal. Northern areas should see scattered snow showers in southern areas. Temperatures will average below normal. The Canadian Prairies should see mostly dry conditions. Temperatures should average below normal.
Chart Analysis: Trends in Chicago are mixed. Support is at 690, 681, and 675 May, with resistance at 712, 724, and 728 May. Trends in Kansas City are mixed to up with objectives of 945 May. Support is at 864, 853, and 843 May, with resistance at 888, 896, and 898 May. Trends in Minneapolis are mixed to up with objectives of 910 and 938 May. Support is at 882, 871, and 860 March, and resistance is at 899, 910, and 913 May.
• RICE:
General Comments: Rice was lower again yesterday. Trends are down on the May charts. The weekly export sales report showed weaker demand. Demand has been good from domestic sources and offers seem hard to find right now. Export demand has been uneven and was low last week. Export demand has been an issue for the market all year. Mills are milling for the domestic market in Arkansas and are bidding for some Rice. Markets from Texas to Mississippi are called quiet. Demand in general has been slow to moderate for Rice for exports. Planting remains active in Texas and southern Louisiana with field conditions called very good in Louisiana and too dry in parts of Texas.
Overnight News: The Delta should get scattered showers. Temperatures should be above normal.
Chart Analysis: Trends are down with objectives of 1671 and 1568 May. Support is at 1695, 1665, and 1625 May and resistance is at 1744, 1749, and 1760 May.
• CORN AND OATS
General Comments: Corn closed mostly higher yesterday but May closed a little lower. Oats were lower and trends are down in this market. US prices are currently very competitive with those from South America as Brazil concentrates on Soybeans exports and not Corn and US demand has improved because of the price differentials and the lack of a Brazil offer into the market. This trend should continue for the next few months if not longer. Prices from South America should now remain strong as countries there concentrate on Soybeans exports and not Corn. The Brazil Summer crop and the Argentine crop is developing under stressful conditions. It has been wet so the Soybeans harvest has been delayed and the Safrinha Corn planting is becoming delayed as well. These delays continue, but the harvest of Soybeans and the planting of Corn is now progressing well. NOAA is forecasting that La Nina will develop this Summer and replace El Nino. US growing conditions are usually good when this happens. However, it is very wet now and some early planting has been delayed.
Overnight News:
Chart Analysis: Trends in Corn are up with objectives of 681 May. Support is at 655, 647, and 643 May, and resistance is at 668, 672, and 682 May. Trends in Oats are down with objectives of 317 May. Support is at 348, 341, and 338 May, and resistance is at 369, 374, and 380 May.
• SOYBEANS
General Comments: Soybeans and Soybean Oil were higher yesterday, but Soybean Meal was lower. Saudi Arabia joined Russia in cutting Crude Oil production and Crude Oil rallied and dragged Soybean Oil and Soybeans along for the ride. The trends are up on the daily reports for Soybeans and Soybean Meal and are turning up for Soybean Oil. Reports from Brazil show that basis levels there are under pressure due to the large crop being harvested now. The basis might get higher later in the marketing period as total South American production is probably about the same as last year. Brazil has a very good crop, but the additional Soybeans grown in Brazil will be wiped out by the losses in Argentina. Argentina has been forced to import from Brazil to keeps its crushing facilities operating. Soybeans export demand is flowing to Brazil now. It remains hot but rains are reported in Argentina and crop conditions are getting stable. Forecasts from NOAA for very good growing conditions in the Midwest were also a factor, but there is too much rain in most growing areas right now.
Overnight News:
Chart Analysis: Trends in Soybeans are up with no objectives. Support is at 1497, 1488 and 1483 May, and resistance is at 1532, 1544, and 1566 May. Trends in Soybean Meal are mixed to up with objectives of 476.00, 487.00, and 516.-00 May. Support is at 457.00, 453.00, and 447.00 May, and resistance is at 475.00, 485.00, and 490.00 May. Trends in Soybean Oil are mixed to up with objectives of 5850, 6080, and 6150 May. Support is at 5620, 5390, and 5130 May, with resistance at 5810, 5980, and 6050 May.
Read Full Story »»»
DiscoverGold
The Corn & Ethanol Report. Overbought & Profit Taking Early In The Grain Session
By: Daniel Flynn | April 4, 2023
We Kickoff the day with Redbook YoY at 7:55 A.M., JOLT’s Job Openings IBD/TIPP Economic Optimism, Factory Orders MoM, Factory Orders ex Transportation, and JOLT’s Job Quits at 9:00 A.M., Fed Cook Speech at 12:30 P.M., API Energy Stocks at 3:30 P.M., Fed Mester Speech and LMI Logistics Managers Index Current at 5:45 P.M.
On the Corn Front the USDA’s Crop Progress said five states have started planting corn. Farmers in Kansas, Kentucky, North Carolina, Tennessee, and Texas have started planting the 2023 crop. Kansas corn is 1% planted, on pace with the five-year average and 1% behind last year’s 2%pace. In Kentucky, 2% of the corn crop is in the ground, ahead of both the 2022 and the five-year average planting pace. North Carolina farmers are slightly behind last year and the five-year average with 1%of their corn crop, on pace with the five-year average with 1% of the crop planted so far. Tennessee farmers have also planted 1% of their corn crop, on pace with the five-year average and ahead of the 2022 growing season’s pace. Over the past seven days, Texas farmers planted 5% of the state’s corn. Total planted corn acreage stands at 57% in the Lone Star State, says the USDA. That’s 3% ahead of the 54% five-year average Across all 18 of the top corn growing states 2% of the US corn crop is in the ground, says the USDA. John Scheve with Superior Feed reported the USDA Stock confirmed what was expected, there is less corn in storage compared to last year. This should mean limited downside on old crop corn prices an US corn exports will be watched closely over the next three months. Scheve also said reduced corn acres does not necessarily lead to more soybean acres. Yesterday we had flash sales of 130,000 MT corn to Mexico and 2600 MT of Bean Oil sold to unknown destinations. Brazil’s soybean exports jump as corn shipments slow. We’re starting in the red this morning with the May corn currently trading at 650 ½ which is 7 ¼ cents higher. The trading range has been 657 ½ to 650.
On the Ethanol Front corn for ethanol use fell in February. The USDA says 399.844 million bushels of corn were used in fuel alcohol production, a decrease of 9% from January and 2% from February 2022. Those declines can be tied to uncertainties about ethanol consumption because of relatively high gasoline prices and poor producer margins. Production of distillers dried grains with soluble was reported at 1,560,717 tons, down 9% on the month and 8% on the year. The next corn for ethanol use will be the big grain report day April 11th. Bullish news is Jim Wiesemeyer with AGWEB reports Japan on Friday announced a new biofuels policy. It could allow the US to capture 100% of Japan’s on-road ethanol market, US Trade Representative (USTR) Katherine Tai said Friday. “The new biofuels policy Japan announced is the result of the close collaboration between our two countries and it will allow US producers to meet Japan’s demand for more diverse energy sources,” Tai said in a news release. There were no trades or open interest in ethanol futures.
Read Full Story »»»
DiscoverGold
Softs Report: Cotton, OJ, Coffee, Sugar, Cocoa
By: Jack Scoville | April 4, 2023
• COTTON
General Comments: Cotton was lower yesterday despite news that Saudi Arabia and Russia will cut back on oil production. That should mean that less poly products are created and sold in competition with Cotton, but also could put a hurt on any recovery hopes for world economics. The weekly export sales report was strong last week and featured buying from Vietnam and China. Ideas are that the world economic problems were fading into the background as the US stock market has rallied. Chart trends turned p. Chinese buying should stay strong as the country improves economically as it opens up from the covid lockdowns.
Overnight News: The Delta will get scattered showers and storms and above normal temperatures. The Southeast will see mostly dry conditions and above normal temperatures. Texas will have mostly dry conditions and above normal temperatures. The USDA average price is now 80.46 ct/lb. ICE said that certified stocks are now 1,485 bales, from 1,485 bales yesterday. USDA said that Cotton is now 4% planted, from 4% last year and 4% average.
Chart Trends: Trends in Cotton are mixed. Support is at 81.20, 80.30, and 79.80 May, with resistance of 84.00, 84.60 and 85.30 May.
• FCOJ
General Comments: FCOJ was higher and made new highs for the move. Trends remain up in the market. Futures remain supported by very short Orange production estimates for Florida. Demand is thought to be backing away from FCOJ with prices as high as they are currently. Historically low estimates of production due in part to the hurricanes and in part to the greening disease that have hurt production, but conditions are significantly better now with scattered showers and moderate temperatures. The weather remains generally good for production around the world for the next crop including production areas in Florida that have been impacted in a big way by the two storms seen previously in the state. Brazil has some rain and conditions are rated good.
Overnight News: Florida should get mostly dry conditions. Temperatures will average above normal. Brazil should get scattered showers and near normal temperatures.
Chart Trends: Trends in FCOJ are up with no objectives. Support is at 260.00, 257.00, and 254.00 May, with resistance at 275.00, 281.00, and 287.00 May.
• COFFEE
General Comments: New York and London closed higher yesterday on ideas of little on offer from producers. Demand ideas remain strong for Robusta on price comparisons with Arabica and demand for Arabica has been maintained. Producers in Vietnam are said to have low stocks left to sell and producers in Colombia and Brazil are also reported to be short Coffee to sell. The lack of offers from South America and Vietnam is still supporting prices and reports indicate that demand for Robusta from Vietnam is strong and increasing due to cost differentials with Arabica. Differentials are now weakening in Brazil, Honduras, and Colombia, but reports indicate that differentials might start to firm up again as production ideas are low for Colombia and Brazil.
Overnight News: ICE certified stocks are slightly lower today at 0.742 million bags. The ICO daily average price is now 164.99 ct/lb. Brazil will get isolated showers with above normal temperatures. Central America will get mostly dry conditions. Vietnam will see isolated showers.
Chart Trends: Trends in New York are mixed. Support is at 172.00, 165.00, and 162.00 May, and resistance is at 180.00, 184.00 and 190.00 May. Trends in London are mixed. Support is at 2160, 2140, and 2090 May, and resistance is at 2250, 2270, and 2300 May.
• SUGAR
General Comments: New York and London both closed higher and at new highs for the move yesterday. Support came in part from news that Saudi Arabia and Russia are cutting Crude Oil production. That should boost demand for Ethanol from Sugarcane. Supplies are tight. Indian production is thought to be less than 33 million tons this year as mills are closing early there and Thailand mills are also closing earlier than expected so the crop there might be less. New crop Brazil production is solid this year but is still in the fields. Reports from private analysts suggest that Brazil can have a 13% increase in center-south production. Brazil producers are currently active in the futures market placing hedges on the production. European production is expected to be reduced again this year. Some analysts now say that Chinese production could be the lowest in six years due to bad growing conditions.
Overnight News: Brazil will get isolated showers. Temperatures should average above normal. India will get mostly dry conditions and near to above normal temperatures.
Chart Trends: Trends in New York are up with no objectives. Support is at 2140, 2090, and 2050 July and resistance is at 2240, 2270, and 2300 July. Trends in London are up with no objectives. Support is at 621.00, 605.00, and 592.00 August and resistance is at 635.00, 641.00, and 647.00 August.
• COCOA
General Comments: New York and London closed l0ower yesterday and trends have turned mixed on the daily charts. Wire reports suggest that producer selling increased on the recent rally in these markets. Trends remain up for at least the short term. Talk is that hot and dry conditions reported in Ivory Coast could curtail main crop production, and main crop production ideas are not strong. Mid crop production ideas are strong due to rains recently reported in Cocoa areas of the country. Ghana has reported a disease in its Cocoa to hurt production potential there, but overall production expectations are high. The rest of West Africa appears to be in good condition. The weather is good in Southeast Asia. Ivory Coast Cocoa arrivals are now estimated at 1.779 million tons, down 4.8% from last year.
Overnight News: Isolated showers are forecast for West Africa. Temperatures will be near normal. Malaysia and Indonesia should see scattered showers. Temperatures should average near normal. Brazil will get isolated showers and near to above normal temperatures. ICE certified stocks are lower today at 5.354 million bags.
Chart Trends: Trends in New York are mixed. Support is at 2850, 2820, and 2780 May, with resistance at 2910, 2960, and 2990 May. Trends in London are mixed. Support is at 2100, 2070, and 2030 May, with resistance at 2160, 2200, and 2230 May.
Read Full Story »»»
DiscoverGold
Saudi First America Last. The Energy Report
By: Phil Flynn | April 4, 2023
Joe Biden seemed to show distain for President Trump’s “America First” Agenda. Biden was also very jealous with the high regard that President Trump was held in in Saudi Arabia and Israel and other countries around the Middle East. He earned respect by engineering the historic peace achievement with the Arab accords that had former Israeli enemies recognizing Israel and OPEC responded to Trump’s tweets for more oil production. The Mid-East also allowed President Trump to end the production war between Russian and Saudi Arabia that helped save the US oil and gas industry. President Trump also wanted to refill the SPR after the covid price crash at about $24.00 a barrel but was thwarted by democrats that called it a bailout for the US oil and gas industry. That vindictive decision cost American taxpayers many millions of dollars.
So, Biden chose to reverse those energy policies led by trying to shun long time US ally Saudi Arabia, vowing to make them a “pariah state”. Yet that short-sighted policy is now backfiring on the administration that put America last and now is causing Saudi Arabia to ignore the needs of the US and instead put Saudi Arabia first. That means that Saudi Arabia will become closer with our adversary and will not adhere to US requests for more oil production unless it is in Saudi Arabia’s best interest. In fact I would argue that the recent OPEC production cut would not have happened if the Biden administration had a more professional relationship with the country.
OPEC’s latest one million barrel a day production cut shows how Biden has lost control of the global oil market but more importantly, how his policies have pushed Saudi Arabia closer to the interests of China and Iran and away from US interests. Bidens’s policies have made America a more expensive and dangerous place. The Wall Street Journal reported today that, “An oil production cut by Saudi Arabia and its allies demonstrated how Crown Prince Mohammed bin Salman is willing to set aside U.S. concerns to pursue a nationalist energy policy aimed at funding an expensive makeover of his kingdom. The Journal pointed out that, “’the second time in less than six months that the Saudis have disregarded U.S. concerns—despite significant potential ramifications on the bilateral relationship—that elevated oil prices would help fuel Russia’s war machine. Sunday’s production cut is the clearest signal yet that the Saudis will do whatever it takes to keep oil prices at levels that benefit them. Prince Mohammed is implementing what analysts label a “Saudi First” economic policy aimed at giving priority to national interests at a time of growing uncertainty about the U.S. commitment to defend its Middle Eastern allies amid increased great-power competition in the region.”
It was also reported that the Saudis again felt betrayed by the Biden administration when US energy Secretary Jennifer Granholm seemed to reverse a promise that the US would start to refill the Strategic Petroleum Reserve at below $70.00 a barrel. The announcement about the SPR when Granholm suggested the replenishment would not happen, was it might take years for that to happen and the market plummeted. So again, the Saudis saw that they could not trust this administration, so they better go it alone and find allies in China and repair relations with Iran just to hedge their bets.
No one believes that Saudi Arabia should have gotten off from some type of punishment for the murder of Jamal Khashoggi, the Saudi dissident journalist that was assassinated by agents of the Saudi government at the Saudi consulate in Istanbul. But for the larger interests of the United States, it should have been handled in a much more professional manor. Instead, Biden dismissed Crown Prince Bin Salman and refused to talk with the real leader of the country until it became apparent that Saudi Arabia was an important strategic and economic partner. Biden foolishly tried to send Saudi Arabia a message by tapping oil from the Strategic Petroleum Reserve because he was unhappy that Saudi Arabia did not adhere to his wishes on oil production. This then started a long term production war with OPEC that the United States is going to lose. The US has now drained its reserve and is having a very difficult time buying that oil back. It’s likely that Biden’s manipulation of the market has caused some long-term structural damage that will end up costing taxpayers more money in higher energy bills.
That circles us back to this weekend’s surprise production cut. Even the International Energy Agency, that normally underestimates demand, was warning that even prior to this move by OPEC the world was going to be under supplied with oil. This is going to leave a huge supply deficit in the back half of the year and is going to cause much higher prices for consumers. And while we call this a surprise production cut, the reality is that the Biden administration has encouraged this type of behavior from the OPEC cartel. Biden’s immature foreign policy, for example vowing to make Saudi Arabia a pariah state or by accusing US energy companies falsely of war profiteering and price gouging is a type of leadership that that has caused a lot of the problems that we see with the US economy. Biden and his energy policies is focused on ESG investment and is making a structural shortage of oil and gas worse.
Of course, Joe Biden takes no responsibility and blames the oil companies, the man on the moon and the war in Ukraine. Reuters reports that, “The United States and European Union will confront any attempts to destabilize global energy markets, the two sides said on Tuesday after a meeting of officials in Brussels where they discussed the fallout in energy markets of Russia’s invasion of Ukraine.” The two sides reiterated their strong commitment to directly confront, with adequate measures, all efforts to further destabilize the global energy situation and to circumvent sanctions,” they said in a joint statement.
Now one story, if it were not for the OPEC cut, would have been bearish for prices. Reuters is reporting that, “Iraq’s federal government and the Kurdistan Regional Government (KRG) have reached a final deal to restart northern oil exports to be announced Tuesday, official sources told Reuters. A formal request has been sent to Turkey to restart oil exports through an Iraq-Turkey pipeline and “in the next few hours pumping will resume,” a Baghdad government official said. Turkey stopped pumping about 450,000 b/d of Iraqi crude through a pipeline from the Fish-Khabur border area to its Ceyhan port on March 25 after Iraq won an arbitration case.
Reuters is also reporting that “Baghdad has reached an agreement to hold a 30% stake in Total Energies long-delayed $27 billion Iraq project, two sources told Reuters on Tuesday. “The deal should be activated within days,” a senior Iraqi oil ministry official said.”
Heating oil and gasoline crack spread suffered a little bit with the reality that refiners would have to pay a lot more for crude oil to make oil and gas products yet in the long term, that is bullish for both gasoline and diesel fuel. Refiners will be tempted to make less supply if the margins falter. The good news is it’s that crack spreads are still historically high.
While gasoline prices are seven cents higher than they were a week ago, at least overnight they seemed to be stable according to AAA. Yet make no mistake about it, the move by OPEC will start to add to gasoline prices in the coming days and weeks. Hopefully, hedgers took advantage of the bank related sell off to put on hedges. They are going to be coming in handy here once the summer driving season kicks in the high gear.
Natural gas on the other hand cannot get a break. Once again, these markets are trying to find the bottom in the low $2 area but it’s difficult do. The one advantage of having high oil prices is that you should see more associated gas coming out of the wells. Of course the warm winter and the Freeport LNG disaster may cause us big problems in natural gas a year or two down the road.
Read Full Story »»»
DiscoverGold
Today's Futures Heat Map • Weakest: Natural Gas, Cocoa, Milk, Feeder Cattle
By: Markets & Mayhem | April 3, 2023
• Today's Futures Heat Map
Strongest: Crude Oil, Coffee, Gasoline, Heating Oil
Weakest: Natural Gas, Cocoa, Milk, Feeder Cattle

Read Full Story »»»
DiscoverGold
Bigger Acreage Confirmed. The Corn & Ethanol Report
By: Daniel Flynn | April 3, 2023
We kickoff the month with S&P Global Manufacturing PMI Final at 8:45 A.M., ISM Manufacturing PMI, ISM Manufacturing Employment, ISM Manufacturing New Orders, ISM Manufacturing Prices and Construction Spending at 9:00 A.M., Export Inspections at 10:00 A.M.,3-Month & 6-Month Bill Auction at 10:30 A.M., Cotton System, Dairy Products, Fats & Oils, and Grain Crushings at 2:00 P.M., Crop progress at 3:00 P.M., and Fed cook Speech at 3:15 P.M.,
On the Corn Front the USDA’s Quarterly Grain Stocks was bullish for old crop corn and soybeans. This morning’s Export Inspections may shed some light on global demand along with weather, disease ( tar spots) and everything you can put in the market. If is not panic or higher energy prices this will further drive inflation and cost to the Grain Complex and food hand to mouth is going to continue upward exponentially and further inflation. In the overnight electronic session the May corn is currently trading at 665 which is 4 ½ cents higher. The trading range has been 667 ¾ to 659 ¼.
On the Ethanol Front the Minnesota train derailment opened eyes, crews are still working to clear the damage. The EPA said, other cars carrying the substance were also at risk of releasing the chemical were also at risk of releasing dangerous toxins. Sen. Amy Klobuchar said at a news conference at the sight was quoted it “seems” there is no contamination within the soil, she continued< No one was hurt. The ground is good. “So let’s just what we can do going forward to make sure it does not happen again,” the Minnesota Democrat said. This is another headline that supports investing in pipelines to move product, not the alternative. There were no trades or open interest in ethanol futures.
Read Full Story »»»
DiscoverGold
The Revenge of the Pariah State. The Energy Report
By: Phil Flynn | April 3, 2023
A “surprise” oil production cut and the price cap falling apart, it was only a matter of time until the petroleum markets broke out. The Saudi Energy Minister Prince Abdulaziz bin Salman warned oil traders and governments not to mess with the oil market or they would be “ouching like hell”. Now it appears that over the weekend we have the revenge of the pariah state and the Biden administration, along with US consumers, will be ouching like hell.
OPEC led by Saudi Arabia, which has shown its displeasure with the Biden administration and their misuse of the Strategic Petroleum Reserve, were reportedly angered on comments by Energy Secretary Jennifer Granholm that they had no plans to buy oil back to refill the reserve even as the Silicon Valley Bank failure caused oil liquidation and had oil fall below $70 a barrel. That is the area where the Biden administration said they would be buying oil back. So, in response, Saudi Arabia and the rest of OPEC plus producers said they would cut oil production by about 1.116 million barrels a day.
Saudi Arabia announced that they would cut production by what they called a “voluntary reduction” of 500,000 barrels a day from May 1st and other OPEC members are joining in. Algeria says that they are going to cut by 48,000 barrels a day. The United Arab Emirates is going to cut production by 144,000 barrels a day from may until the end of 2023. That is on top of their previously agreed production cut of 2.0 million barrels a day.
The Wall Street Journal reported that Russia nominally is part of Sunday’s action, but its output cut—500,000 barrels a day—was announced weeks ago and was likely involuntary, as the damage to its economy from sanctions and the war deepens. Russian officials said they were extending their production cut for the entire year. Russian government revenue has been squeezed, the country’s biggest exports, gas and oil, have lost major customers, and the ruble is down more than 20% since November against the dollar.”
Yet I am not so sure the Journal is totally correct on this. The reality is there are signs that Russia has successfully found new customers for its oil, mainly China and India and even Japan is buying Russian oil above the price cap. In fact, the Wall Street Journal also reported that Japan asked the US for an exception to the price cap. Now with OPEC reducing output, there will be more countries desperate for oil and adherence to the price cap will lead to shortages or the whole price cap mechanism will fall apart. Kremlin spokesman Dmitry Peskov said that oil production cuts were intended to keep “crude oil and petroleum product prices at a certain level.” The production cut “is not recommended at this time” according to the White House but the statement was a far cry from when the Biden administration vowed “serious consequences” if the group cut production.
Yet let’s face it, this production cut is a slap in the face to the Biden administration. The administration vowed to make Saudi Arabia a pariah state is now back to begging OPEC not to cut production. The Biden administration’s energy policy has discouraged US drilling and production and has allowed OPEC to have the power to snub the US and its oil needs. Biden’s amateurish handling of foreign affairs has left the American people in a more vulnerable state.
The upheaval in the market from weak energy policy continues. Reuters reports that, “Russia’s largest oil producer Rosneft (ROSN.MM) and India’s top refiner Indian Oil Corp (IOC.NS) agreed to use the Asia-focused Dubai oil price benchmark in their latest deal to deliver Russian oil to India, three sources familiar with the deal said. The decision by the two state-controlled companies to abandon the Europe-dominated Brent benchmark is part of a shift of Russia’s oil sales towards Asia after Europe shunned Russian oil following Russia’s invasion of Ukraine more than a year ago.” The cut comes as USA oil inventories may start to fall dramatically. We expect that crude supply could fall this week by 4 million barrels and oil prices, like gasoline, will fall by 2 million barrels and distillates by 2.5 million barrels. Refinery runs should increase by 0.5.
ArgusMedia reports that Northern Iraq’s KRG has reached an “initial agreement” with Iraq’s federal govt to resume #crude exports from the north of the country this week, head of the #KRG’s foreign media affairs. That would have been bearish before the OPEC cut. Now, not as much. This is not good for gasoline prices. With supply below normal and tight supplies of gasoline additives, it will make us all pay at the pump. AAAS shows regular gas prices at $3506 up from 343.9 a week ago. Look for further price spikes in the days ahead.
The natural gas meltdown continues. EBW analytics says that after the April contract rolled off the board below $2.00/MMBtu last week, the May contract is rolling down amid a combination of soft Henry Hub spot prices, weakening April weather, and signs of a post-winter supply bump adding to a swelling South-Central surplus. Over the weekend, major weather models lost nearly 20 gHDDs within the 1–15-day window. DTN’s forecast is down 9 gHDDs, another bearish blow at the front of the NYMEX curve. With technical also bearish, further near-term price weakness appears probable.
Read Full Story »»»
DiscoverGold
Q1 2023 futures recap - OJ killed it - Natty died
By: Markets & Mayhem | April 1, 2023
• Q1 2023 futures recap
- OJ killed it
- Natty died

Read Full Story »»»
DiscoverGold
|
Followers
|
89
|
Posters
|
|
|
Posts (Today)
|
2
|
Posts (Total)
|
8924
|
|
Created
|
05/01/07
|
Type
|
Free
|
| Moderators DiscoverGold Pro-Life | |||
- The Commodity Bull is Running... Inflation is Running... Harder Living (i.e. FOOD, CLOTHING, SHELTER) is Dead Ahead... -
- Commodity Futures Trading -
http://finviz.com/futures_performance.ashx
All Commodity Futures Charts From Finbiz.com Available Below:
Daily
Weekly
Monthly
Quarterly
6 Months
12 Months
YTD
2 Years
5 Years
Max
Beneficial Educational Resources on Futures TradingThe futures market is volatile, and it cuts both ways. Leverage that makes it profitable can also ruin reckless, undisciplined traders overnight. Most brokers have paper trading available on their platforms, so those who are new to futures should take advantage and learn with these tools before going live with real money. Mitigate risk with stop loss orders at all times, and cut losses quickly instead of adding contracts and attempting to flip your way out of a losing position. Also, use mini instruments when available, with lower margin requirements, until you have sufficient capital to buy and sell more expensive contracts. Even though the potential is there, don't try to make too many profits at once. If things aren't going well, often times quitting for the day and collecting one's thoughts is the best decision. New opportunities come along daily. Markets are open nearly 24 hours, so set a schedule and stick to it. Avoid trading while tired or distracted, and please don't listen to the advice of others. Do research on fundamentals affecting markets as well as paying attention to TA. Watch key indices, and listen to accurate, real-time news during the session to stay aware of shifting trends. Trade smart, trade safely, and have fun.
Videos on Futureshttps://www.youtube.com/playlist?list=PL9A5C5A93D243CA44 Continuous Improvement in Progress |
Commodity Futures Trading
https://www.tdameritrade.com/investment-products/futures-trading.page
| Volume | |
| Day Range: | |
| Bid Price | |
| Ask Price | |
| Last Trade Time: |


