 News
News  Market Data
  Discover
Support: 888-992-3836
Copyright © 2023 InvestorsHub Inc.


Register for free to join our community of investors and share your ideas. You will also get access to streaming quotes, interactive charts, trades, portfolio, live options flow and more tools.
I still think this is under accumulation. Marker makers were shaking the trees for the next leg up in my opinion. Still have about 31,000 shares. I liked the looks of 500,000 sharers better!!!!!
Yes bid actually inched up after sell which I was surprised.
That is a boatload. The only shareholder I know with that many shares is XM ROCKS, although there have to be several others. Nice it held $16 with that much volume.
JUST IN: $CIBH CIB Marine Bancshares, Inc. Announces Third Quarter 2020 Results
BROOKFIELD, Wis., Oct. 13, 2020 (GLOBE NEWSWIRE) -- CIB Marine Bancshares, Inc. (the “Company” or “CIBM”) (OTCQB: CIBH), the holding company of CIBM Bank, announced its unaudited results of operations and financial condition for the third quarter of 2020. Net inc...
Read the whole news CIBH - CIB Marine Bancshares, Inc. Announces Third Quarter 2020 Results
News out
CIB Marine Bancshares, Inc. Announces Third Quarter 2020 Results
BROOKFIELD, Wis., Oct. 13, 2020 (GLOBE NEWSWIRE) -- CIB Marine Bancshares, Inc. (the “Company” or “CIBM”) (OTCQB: CIBH), the holding company of CIBM Bank, announced its unaudited results of operations and financial condition for the third quarter of 2020. Net income for the quarter was $3.4 million compared to $1.0 million for the same period in 2019 and, for the nine months ending September 30, 2020, it was $5.9 million compared to $2.4 million for the same period in 2019.
A summary of financial results for the quarter and nine months ended September 30, 2020, is attached. Select highlights include:
The return on average assets and efficiency ratio year to date were 1.05% and 72%, respectively, compared to 0.46% and 86%, respectively, for the same period in 2019.
CIBM Bank’s Mortgage Banking Division was a significant contributor to improved quarter and year to date earnings results. Driven by refinance activity due to lower interest rates, net mortgage banking revenues and loan originations for the nine months ended September 30, 2020, were $13.9 million and $418 million, respectively, compared to $6.1 million and $226 million, respectively, for the same period of the prior year.
Compensation expense was up 28% in the Company for the nine months ended September 30, 2020, primarily due to the increase in mortgage division compensation as a result of the significant increase in production. Compensation at the mortgage division represents 52% of the total compensation in the Company year to date; excluding the mortgage division, the Company’s compensation year to date is up less than 2% compared to the same period last year.
Net interest income was up $1.9 million for the first nine months of 2020, compared to the same period in 2019. The primary reasons for the increase include: (i) higher average balances in loans held for sale and Paycheck Protection Program (PPP) loans, (ii) a 68 basis point reduction in the cost of interest bearing liabilities due to the lower interest rate environment, and (iii) the collection of principal plus interest on a large non-performing commercial real estate loan.
In addition to providing the impetus for lower interest rates, COVID-19 and the related Lockdown Recession have affected the Company in many ways. Year to date, CIBM Bank has originated approximately 350 government guaranteed PPP loans, with balances in excess of $43 million. As a result, CIBM Bank has received and deferred $1.5 million in fees from the SBA to be fully recognized in earnings when the loans are repaid or granted forgiveness with repayment by the government. To date, the Company has prepared PPP forgiveness applications totaling $7 million in principal balances and $0.2 million in related deferred origination fees; we expect receipt of proceeds during the fourth quarter. In addition, there were 90 loans totaling $74 million with COVID-19 loan payment deferrals as of September 30, 2020.
Provisions for loan losses were $1.0 million for the nine months ended September 30, 2020, compared to $0.1 million for the same period of 2019. The primary reason for the increase is environmental and qualitative factors as well as certain borrower credit deterioration primarily from those industries hardest hit by COVID-19 and the Lockdown Recession (i.e., restaurants and hospitality).
Non-performing assets, restructured loans, and loans 90 days or more past due and still accruing to total assets and nonaccrual loans to total loans were 0.60% and 0.32%, respectively; compared to 1.35% and 1.09%, respectively, at December 31, 2019; and 1.40% and 1.14%, respectively, at September 30, 2020. The improvements during the first nine months of 2020 were due to certain loan level improvements including a successful large commercial real estate loan collection.
Mr. J. Brian Chaffin, President and CEO of CIBM, commented, “We are happy to report very strong earnings for the first three quarters of 2020. Given the challenges that many banks have faced this year, the efforts of our staff to deliver these results is outstanding. From the logistical and technological aspects of servicing our customers and managing bank and mortgage operations remotely, to implementing the significant number of new government economic and industry level assistance programs, to the bank-wide initiatives to improve earnings and efficiency, investors can be proud of the dedication and commitment of the entire CIBM Bank team.
“Record levels of mortgage banking activity at the Company have contributed to our financial success this year, and we have seen improvements in our funding composition and cost of funds thanks to the lower rate environment and our ‘Project Falcon’ initiatives related to deposit generation and operating efficiencies. Despite the strong results thus far in 2020,” he cautioned, “we expect to see credit deterioration continue in the industry on whole and in portions of CIBM Bank’s portfolio in the quarters ahead. To address the Lockdown Recession’s impact on credit risk, CIBM Bank has established higher loan loss provisions this year, with the possibility of further increases in the quarters to come.”
In closing he added, “We are also pleased to highlight the successful 1-for-15 reverse split of our common stock, effective September 14, 2020. Combined with a pending future upgrade for the Company’s common stock from the OTCQB to OTCQX market during the fourth quarter, this should assist in improving the marketplace for the common stock.”
CIB Marine Bancshares, Inc. is the holding company for CIBM Bank, which operates eleven banking offices and five mortgage loan offices in Illinois, Wisconsin and Indiana. More information on the Company is available at www.cibmarine.com, including recent shareholder letters, links to regulatory financial reports, and audited financial statements.
FORWARD-LOOKING STATEMENTS
CIB Marine has made statements in this release that may constitute “forward-looking statements” within the meaning of the Private Securities Litigation Reform Act of 1995. CIB Marine intends these forward-looking statements to be subject to the safe harbor created thereby and is including this statement to avail itself of the safe harbor. Forward-looking statements are identified generally by statements containing words and phrases such as “may,” “project,” “are confident,” “should be,” “intend,” “predict,” “believe,” “plan,” “expect,” “estimate,” “anticipate” and similar expressions. These forward-looking statements reflect CIB Marine’s current views with respect to future events and financial performance that are subject to many uncertainties and factors relating to CIB Marine’s operations and the business environment, which could change at any time.
There are inherent difficulties in predicting factors that may affect the accuracy of forward-looking statements.
Stockholders should note that many factors, some of which are discussed elsewhere in this Earnings Release and in the documents that are incorporated by reference, could affect the future financial results of CIB Marine and could cause those results to differ materially from those expressed in forward-looking statements contained or incorporated by reference in this document. These factors, many of which are beyond CIB Marine’s control, include but are not limited to:
operating, legal, execution, credit, market, security (including cyber), and regulatory risks;
economic, political, and competitive forces affecting CIB Marine’s banking business;
the impact on net interest income and securities values from changes in monetary policy and general economic and political conditions; and
the risk that CIB Marine’s analyses of these risks and forces could be incorrect and/or that the strategies developed to address them could be unsuccessful.
These factors should be considered in evaluating the forward-looking statements, and undue reliance should not be placed on such statements. Forward-looking statements speak only as of the date they are made. CIB Marine undertakes no obligation to update or revise any forward-looking statements, whether as a result of new information, future events, or otherwise. Forward-looking statements are subject to significant risks and uncertainties and CIB Marine’s actual results may differ materially from the results discussed in forward-looking statements.
FOR INFORMATION CONTACT:
J. Brian Chaffin, President & CEO
(217) 355-0900
brian.chaffin@cibmbank.com
CIB MARINE BANCSHARES, INC.
Selected Unaudited Consolidated Financial Data
At or for the
Quarters Ended 9 Months Ended
September 30, June 30, March 31, December 31, September 30, September 30, September 30,
2020 2020 2020 2019 2019 2020 2019
(Dollars in thousands, except share and per share data)
Selected Statement of Operations Data:
Interest and dividend income $ 7,202 $ 6,669 $ 6,636 $ 6,820 $ 7,035 $ 20,507 $ 21,128
Interest expense 1,017 1,343 1,689 2,030 2,183 4,049 6,617
Net interest income 6,185 5,326 4,947 4,790 4,852 16,458 14,511
Provision for loan losses 501 249 202 715 327 952 102
Net interest income after provision for
loan losses 5,684 5,077 4,745 4,075 4,525 15,506 14,409
Noninterest income (1) 8,104 4,489 2,642 2,249 3,835 15,235 7,907
Noninterest expense 9,056 7,308 6,322 6,879 7,233 22,686 19,295
Income (loss) before income taxes 4,732 2,258 1,065 (555 ) 1,127 8,055 3,021
Income tax expense (benefit) 1,322 575 281 (180 ) 93 2,178 603
Net income (loss) $ 3,410 $ 1,683 $ 784 $ (375 ) $ 1,034 $ 5,877 $ 2,418
Common Share Data (2):
Basic net income (loss) per share (3) $ 2.69 $ 1.36 $ 0.63 $ (0.30 ) $ 1.09 $ 4.69 $ 2.23
Diluted net income (loss) per share (3) 1.56 0.79 0.36 (0.30 ) 0.62 2.73 1.25
Dividend 0.00 0.00 0.00 0.00 0.00 0.00 0.00
Tangible book value per share (4) 50.35 47.25 46.05 44.85 45.40 50.35 45.40
Book value per share (4) 45.27 42.00 40.95 39.60 40.20 45.27 40.20
Weighted average shares outstanding - basic 1,267,582 1,266,170 1,248,270 1,243,095 1,230,361 1,260,499 1,218,737
Weighted average shares outstanding - diluted 2,181,868 2,160,199 2,155,313 2,155,302 2,169,090 2,163,850 2,189,033
Financial Condition Data:
Total assets $ 793,604 $ 793,151 $ 705,473 $ 703,791 $ 700,711 $ 793,604 $ 700,711
Loans 546,351 535,692 513,992 513,705 508,758 546,351 508,758
Allowance for loan losses (9,037 ) (8,483 ) (8,107 ) (8,007 ) (7,560 ) (9,037 ) (7,560 )
Investment securities 107,351 113,303 120,105 120,398 120,648 107,351 120,648
Deposits 593,370 566,811 531,999 530,190 557,745 593,370 557,745
Borrowings 87,994 120,233 68,950 73,847 38,468 87,994 38,468
Stockholders' equity 101,271 97,347 95,841 93,404 94,082 101,271 94,082
Financial Ratios and Other Data:
Performance Ratios:
Net interest margin (5) 3.30 % 2.96 % 3.04 % 2.86 % 2.95 % 3.10 % 2.93 %
Net interest spread (6) 3.16 % 2.76 % 2.78 % 2.55 % 2.62 % 2.90 % 2.61 %
Noninterest income to average assets (7) 4.12 % 2.36 % 1.51 % 1.28 % 2.19 % 2.72 % 1.49 %
Noninterest expense to average assets 4.60 % 3.86 % 3.67 % 3.88 % 4.14 % 4.06 % 3.67 %
Efficiency ratio (8) 63.38 % 74.61 % 83.74 % 97.57 % 83.44 % 71.71 % 86.39 %
Earnings on average assets (9) 1.73 % 0.89 % 0.45 % -0.21 % 0.59 % 1.05 % 0.46 %
Earnings on average equity (10) 13.51 % 6.97 % 3.32 % -1.56 % 4.35 % 8.05 % 3.48 %
Asset Quality Ratios:
Nonaccrual loans to loans (11) 0.32 % 0.92 % 0.97 % 1.09 % 1.14 % 0.32 % 1.14 %
Nonaccrual loans, restructured loans and
loans 90 days or more past due and still
accruing to total loans (11) 0.49 % 1.07 % 1.25 % 1.38 % 1.44 % 0.49 % 1.44 %
Nonperforming assets, restructured loans
and loans 90 days or more past due and still
accruing to total assets (11) 0.60 % 1.02 % 1.24 % 1.35 % 1.40 % 0.60 % 1.40 %
Allowance for loan losses to total loans (11) 1.65 % 1.58 % 1.58 % 1.56 % 1.49 % 1.65 % 1.49 %
Allowance for loan losses to nonaccrual loans,
restructured loans and loans 90 days or
more past due and still accruing (11) 338.59 % 147.79 % 126.26 % 112.66 % 103.07 % 338.59 % 103.07 %
Net charge-offs (recoveries) annualized
to average loans (11) -0.04 % -0.09 % 0.08 % 0.21 % 0.01 % -0.02 % 0.13 %
Capital Ratios:
Total equity to total assets 12.76 % 12.27 % 13.59 % 13.27 % 13.43 % 12.76 % 13.43 %
Total risk-based capital ratio 15.91 % 15.49 % 15.36 % 15.19 % 15.18 % 15.91 % 15.18 %
Tier 1 risk-based capital ratio 14.65 % 14.23 % 14.11 % 13.94 % 13.93 % 14.65 % 13.93 %
Leverage capital ratio 11.20 % 10.82 % 11.08 % 10.71 % 10.86 % 11.20 % 10.86 %
Other Data:
Number of employees (full-time equivalent) 176 177 177 176 182 176 182
Number of banking facilities 11 11 11 11 11 11 11
(1) Noninterest income includes gains and losses on securities.
(2) Common share data prior to September 14, 2020 is adjusted to reflect the 1 share per 15 share reverse split to allow for comparability between the pre and post reverse split periods.
(3) Net income available to common stockholders in the calculation of earnings per share includes the difference between the carrying amount less the consideration paid for redeemed preferred stock of $0.3 million for the third quarter and 9 months ended 2019 and $0.03 million for the 2nd quarter and 9 months ended September 30, 2020.
(4) Tangible book value per share is the stockholder equity less the carry value of the preferred stock and less the goodwill and intangible assets, divided by the total shares of common outstanding. Book value per share is the stockholder equity less the liquidation preference of the preferred stock, divided by the total shares of common outstanding. Book value measures are reported inclusive of the net deferred tax assets. As presented here, shares of common outstanding excludes unvested restricted stock awards.
(5) Net interest margin is the ratio of net interest income to average interest-earning assets.
(6) Net interest spread is the yield on average interest-earning assets less the rate on average interest-bearing liabilities.
(7) Noninterest income to average assets excludes gains and losses on securities.
(8) The efficiency ratio is noninterest expense divided by the sum of net interest income plus noninterest income, excluding gains and losses on securities.
(9) Earnings on average assets are net income divided by average total assets.
(10) Earnings on average equity are net income divided by average stockholders' equity.
(11) Excludes loans held for sale.
CIB MARINE BANCSHARES, INC.
Consolidated Balance Sheets (unaudited)
September 30, June 30, March 31, December 31, September 30,
2020 2020 2020 2019 2019
(Dollars in Thousands, Except Shares)
Assets
Cash and due from banks $ 30,544 $ 9,120 $ 9,006 $ 8,970 $ 9,582
Reverse repurchase agreements 8,208 18,117 3,622 11,196 4,083
Securities available for sale 104,866 110,818 117,640 117,972 118,211
Equity securities at fair value 2,485 2,485 2,465 2,426 2,437
Loans held for sale 67,496 83,997 24,988 16,928 25,347
Loans 546,351 535,692 513,992 513,705 508,758
Allowance for loan losses (9,037 ) (8,483 ) (8,107 ) (8,007 ) (7,560 )
Net loans 537,314 527,209 505,885 505,698 501,198
Federal Home Loan Bank Stock 3,140 2,948 2,947 2,587 926
Premises and equipment, net 4,667 4,679 4,769 4,274 4,504
Accrued interest receivable 2,075 1,973 1,610 1,486 1,646
Deferred tax assets, net 18,547 19,325 19,509 20,069 20,455
Other real estate owned, net 2,103 2,334 2,335 2,396 2,466
Bank owned life insurance 4,774 4,745 4,718 4,691 4,666
Goodwill and other intangible assets 137 142 148 154 159
Other assets 7,248 5,259 5,831 4,944 5,031
Total Assets $ 793,604 $ 793,151 $ 705,473 $ 703,791 $ 700,711
Liabilities and Stockholders' Equity
Deposits:
Noninterest-bearing demand $ 91,134 $ 90,450 $ 67,459 $ 70,175 $ 63,694
Interest-bearing demand 61,262 54,288 47,760 45,512 50,683
Savings 225,724 205,470 196,797 204,976 202,866
Time 215,250 216,603 219,983 209,527 240,502
Total deposits 593,370 566,811 531,999 530,190 557,745
Short-term borrowings 54,052 77,273 68,950 73,847 38,468
Long-term borrowings 33,942 42,960 0 0 0
Accrued interest payable 398 447 543 603 711
Other liabilities 10,571 8,313 8,140 5,747 9,705
Total liabilities 692,333 695,804 609,632 610,387 606,629
Stockholders' Equity
Preferred stock, $1 par value; 5,000,000 authorized shares at both September 30, 2020 and December 31, 2019; 7% fixed rate noncumulative perpetual issued; 40,690 shares of series A and 3,201 shares of series B; convertible; $44.1 million aggregate liquidation preference 37,308 37,308 37,490 37,490 37,489
Common stock, $1 par value; 75,000,000 authorized shares; 1,282,362 and 18,868,329 issued shares; 1,268,293 and 18,657,282 outstanding shares at September 30, 2020 and December 31, 2019, respectively. (1)(2) 1,282 19,240 19,162 18,868 18,868
Capital surplus 179,090 161,032 160,990 161,175 161,110
Accumulated deficit (117,875 ) (121,285 ) (122,969 ) (123,753 ) (123,377 )
Accumulated other comprehensive income, net 2,000 1,586 1,702 158 526
Treasury stock, 14,791 shares on September 30, 2020 and 221,902 shares prior at cost (2) (534 ) (534 ) (534 ) (534 ) (534 )
Total stockholders' equity 101,271 97,347 95,841 93,404 94,082
Total liabilities and stockholders' equity $ 793,604 $ 793,151 $ 705,473 $ 703,791 $ 700,711
(1) Both issued and outstanding shares as stated here exclude 60,570 shares of unvested restricted stock awards at September 30, 2020, and 815,395 shares of unvested restricted stock awards at December 31, 2019.
(2) Effective September 14, 2020 the company executed a reverse stock split of 1 share for every 15 shares outstanding, fractional shares were remitted cash at the current per share market value of $15.75.
CIB MARINE BANCSHARES, INC.
Consolidated Statements of Operations (Unaudited)
At or for the
Quarters Ended 9 Months Ended
September 30, June 30, March 31, December 31, September 30, September 30, September 30,
2020 2020 2020 2019 2019 2020 2019
(Dollars in thousands)
Interest Income
Loans $ 6,054 $ 5,540 $ 5,703 $ 5,793 $ 5,992 $ 17,297 $ 17,496
Loans held for sale 537 451 119 195 152 1,107 334
Securities 573 661 763 764 810 1,997 2,482
Other investments 38 17 51 68 81 106 816
Total interest income 7,202 6,669 6,636 6,820 7,035 20,507 21,128
Interest Expense
Deposits 942 1,263 1,512 1,856 2,027 3,717 5,781
Short-term borrowings 38 54 177 174 156 269 836
Long-term borrowings 37 26 0 0 0 63 0
Total interest expense 1,017 1,343 1,689 2,030 2,183 4,049 6,617
Net interest income 6,185 5,326 4,947 4,790 4,852 16,458 14,511
Provision for (reversal of) loan losses 501 249 202 715 327 952 102
Net interest income after provision for
(reversal of) loan losses 5,684 5,077 4,745 4,075 4,525 15,506 14,409
Noninterest Income
Deposit service charges 89 88 96 98 101 273 279
Other service fees 36 36 20 23 30 92 79
Mortgage banking revenue, net 7,741 3,990 2,177 2,112 2,936 13,908 6,062
Other income 226 266 265 129 150 757 494
Net gains on sale of securities available for sale 0 0 0 0 0 0 0
Unrealized gains (losses) recognized on equity securities 0 20 39 (11 ) 18 59 82
Net gains on sale of SBA loans (55 ) 87 437 166 605 469 858
Net gains (losses) on sale of assets and (writedowns) 67 2 (392 ) (268 ) (5 ) (323 ) 53
Total noninterest income 8,104 4,489 2,642 2,249 3,835 15,235 7,907
Noninterest Expense
Compensation and employee benefits 7,329 5,451 4,421 4,701 5,309 17,201 13,441
Equipment 352 379 363 394 335 1,094 1,023
Occupancy and premises 390 407 460 460 420 1,257 1,313
Data Processing 177 155 164 157 165 496 491
Federal deposit insurance 48 47 0 (10 ) (5 ) 95 143
Professional services 162 242 298 320 198 702 545
Telephone and data communication 71 67 68 81 86 206 247
Insurance 58 55 54 59 70 167 175
Other expense 469 505 494 717 655 1,468 1,917
Total noninterest expense 9,056 7,308 6,322 6,879 7,233 22,686 19,295
Income (losses) from operations
before income taxes 4,732 2,258 1,065 (555 ) 1,127 8,055 3,021
Income tax expense (benefit) 1,322 575 281 (180 ) 93 2,178 603
Net income (loss) 3,410 1,683 784 (375 ) 1,034 5,877 2,418
Preferred stock dividend 0 0 0 0 0 0 0
Discount from repurchase of preferred stock 0 33 0 0 308 33 308
Net income (loss) allocated to
common stockholders $ 3,410 $ 1,716 $ 784 $ (375 ) $ 1,342 $ 5,910 $ 2,726
Source: CIBM Bank
© 2020 GlobeNewswire, Inc.
losing the D on Monday
https://otce.finra.org/otce/dailyList
Got my shares today hope no one hits the bid
Havent gotten mine either. Sometimes it takes a few days to get the shares after a RS in otcland.
That's the problem. There is no CIBHD in my account to trade. All my shares show CIBH with a value of $0. I'm guessing the OTC is the problem.
Trade it as CIBHD
Appears that CIBH actually DID find a way to make their shares less liquid. Bravo!
My accounts still show CIBH shares pre-split quantities with $0.00 value. I'm guessing it's currently untradeable. I'm not impressed.
I can’t even see a price......I would think the price/market makers would have the ability to trade....
Nobody wants to go first? How about a big fund?
CIBH one for 15 reverse split:
https://otce.finra.org/otce/dailyList?viewType=Symbol%2FName%20Changes
Well the split is happening Monday so guess we will find out how it plays out. I didnt realize it was happening so soon guess I am holding through the RS now.

It has held a dollar for a long time. There are a ton more shares being swapped now than 3 years ago. If you listened to the conference call, they did state that nothing changes mathematically in a reverse split. It does allow institutional investors that cannot purchase stocks under $5.00 to purchase. It also allows them to potentially raise capital to repurchase the preferred shares. Either way, it’s good for the commons in my opinion. The sooner we get the preferred stock retired (or manageable), the sooner we get to reap the rewards of a dividend.
Paying a dividend on fewer shares allows for a higher dividend per share, however. Net for shareholders is the same, but $.15 looks better at a glance than $.01.
I would have appreciated them giving their reasoning for the decision. They don't really want their stock publicly traded anyway, so what is the point of the reverse split? I don't think a small bank like this is going to hold $15. Maybe this is some strategy to swap common for preferred, but I just don't see this being necessary at this stage of the game. With the economy in its current state, I don't know that expansion is wise unless they are going to acquire another bank.
It’s a good thing. Yes it’s on paper. The P/E ratios will be the same. It will open doors for someone to infuse cash if they want to. It will also make it easier to market for a sale if that’s in our cards. I personally don’t feel like a sale is being considered after all the work that has been done for the repurchase of the preferred stock. We shall see......
Ive been a part of many splits before and its not that easy. It sounds good on paper but whether it happens or not is a whole nother thing. The ones that do well after the splits have good volume everyday but this one barely trades. Institutions could purchase it here if they really wanted to. Wouldnt take much to get it to $5.00 but like I said earlier if they wont touch it at $1.00 not sure why we should be optimistic that they will buy at $15. or where we need it to be for our patience $30+.
It opens the doors for institutional investors to purchase. That’s it. Nothing changes......
1:15 Reverse split news. Still debating whether I want to hold it or not. If no one wants to buy it at $1 not sure who gonna touch it at $15 and realistically we need it to trade at about $30 minimum to make it even worth us holding all this time.
CIB Marine Bancshares, Inc. Announces 1:15 Reverse Split of Common Stock GlobeNewswire "Press Releases"
BROOKFIELD, Wis , Sept. 11, 2020 (GLOBE NEWSWIRE) -- CIB Marine Bancshares, Inc. (the Company or CIBM) (OTCQB: CIBH), announced that at 4:59a.m., Central Time , on September 14, 2020 (the Effective Date), it will affect a 1-for-15 reverse stock split, as previously approved by its Board of Directors and a majority of its common shareholders. On the Effective Date, the shares of the Companys common stock, $1.00 par value per share (the Common Stock), will begin trading on a split-adjusted basis. The Companys trading symbol is expected to change to CIBHD on the Effective Date and will remain as such for a period of 20 trading days, after which the Companys trading symbol will revert back to the original symbol of CIBH. The Companys CUSIP number will change to 12542L400 with respect to all shares of Common Stock traded or issued on or after the Effective Date.
Upon the Effective Date, each fifteen shares of Common Stock issued and outstanding, and any unvested restricted stock awards issued pursuant to the Companys Restricted Stock Plan, will convert into one share of Common Stock. In addition, the number of shares of Common Stock authorized for issuance under Companys Restricted Stock Plan will be proportionally reduced to reflect the reverse stock split. Neither the authorized number of shares of Common Stock nor the par value per share of the Common Stock will change as a result of the reverse stock split.
No fractional shares will be issued. CIBM will pay cash (without interest) in lieu of issuing fractional shares in connection with the reverse split based on the closing trading price of the Common Stock as listed on the OTCQB market on the Effective Date. Shareholders holding fewer than fifteen shares of Common Stock will only receive cash for their shares held before the reverse stock split and will no longer hold any shares of Common Stock as of the Effective Date. CIBM expects to pay out less than $5,000 in the aggregate for fractional share interests.
The reverse stock split will not impact any common shareholders percentage ownership of CIBM or voting power, except for nominal effects resulting from the treatment of fractional shares. Further, the reverse split will have no effect on the Companys authorized preferred stock, except with respect to a proportional change to the conversion rates of the Series B preferred stock, where applicable.
CIBM has retained its transfer agent, Computershare Inc. and its wholly owned subsidiary Computershare Trust Company, N.A. (together Computershare), to manage the exchange of the pre-split shares for new, post-split shares. Computershare can be contacted toll free at (800) 962-4284.
Shareholders of record with Common Shares held in certificated form will receive instructions from Computershare regarding the process for exchanging their old certificates in the coming days. Computershare will be issuing all post-split shares in book-entry form, unless physical certificates are specifically requested by the shareholder. Shareholders with pre-split shares held in book-entry form or through a bank, broker, custodian or other nominee (i.e., in street name) are not required to take any action and will see the effect of the reverse stock split reflected in their accounts. Shareholders who hold their shares in street name should contact their bank, broker, custodian or other nominee with any questions regarding their procedures in connection with the reverse stock split.
We anticipate that this split will increase the market price per share and make our stock more acceptable to a wider set of brokers, thereby improving the marketability and liquidity of our stock. Our shareholders strongly supported this initiative at our Annual Meeting of Shareholders held on April 30, 2020 , and I am pleased that we have been able to accomplish this for our shareholders, said J. Brian Chaffin , President and CEO of CIB Marine.
CIB Marine Bancshares, Inc. is the holding company for CIBM Bank , which operates eleven banking offices and five mortgage loan offices in Illinois , Wisconsin and Indiana. More information on the Company is available at www.cibmarine.com, including recent shareholder letters, links to regulatory financial reports, and audited financial statements.
FORWARD-LOOKING STATEMENTS CIB Marine has made statements in this release that may constitute forward-looking statements within the meaning of the Private Securities Litigation Reform Act of 1995. CIB Marine intends these forward-looking statements to be subject to the safe harbor created thereby and is including this statement to avail itself of the safe harbor. Forward-looking statements are identified generally by statements containing words and phrases such as may, project, are confident, should be, intend, predict, believe, plan, expect, estimate, anticipate and similar expressions. These forward-looking statements reflect CIB Marines current views with respect to future events and financial performance that are subject to many uncertainties and factors relating to CIB Marines operations and the business environment, which could change at any time.
There are inherent difficulties in predicting factors that may affect the accuracy of forward-looking statements.
Shareholders should note that many factors could affect the future financial results of CIB Marine and could cause those results to differ materially from those expressed in forward-looking statements contained or incorporated by reference in this document. These factors, many of which are beyond CIB Marines control, include but are not limited to:
operating, legal, execution, credit, market, security (including cyber), and regulatory risks;
economic, political, and competitive forces affecting CIB Marines banking business;
the impact on net interest income and securities values from changes in monetary policy and general economic and political conditions; and
the risk that CIB Marines analyses of these risks and forces could be incorrect and/or that the strategies developed to address them could be unsuccessful.
These factors should be considered in evaluating the forward-looking statements, and undue reliance should not be placed on such statements. Forward-looking statements speak only as of the date they are made. CIB Marine undertakes no obligation to update or revise any forward-looking statements, whether as a result of new information, future events, or otherwise. Forward-looking statements are subject to significant risks and uncertainties and CIB Marines actual results may differ materially from the results discussed in forward-looking statements.
FOR INFORMATION CONTACT: J. Brian Chaffin , President & CEO (217) 355-0900 brian.chaffin@cibmbank.com
Margin calls sacrificing CIBH shares for people or what?
News: $CIBH CIB Marine Bancshares, Inc. Announces Second Quarter 2020 Results
BROOKFIELD, Wis., July 16, 2020 (GLOBE NEWSWIRE) -- CIB Marine Bancshares, Inc. (the “Company” or “CIBM”) (OTCQB: CIBH), the holding company of CIBM Bank, announced its unaudited results of operations and financial condition for the second quarter of 2020. ...
In case you are interested CIBH - CIB Marine Bancshares, Inc. Announces Second Quarter 2020 Results
Nope. I try to post updates as soon as I get them ; )
Damn your fast! I just read it......like I said, some big offers were thrown out to “scare” us out of our shares. Didn’t work.
News out
CIB Marine Bancshares, Inc. Announces Second Quarter 2020 Results
BROOKFIELD, Wis., July 16, 2020 (GLOBE NEWSWIRE) -- CIB Marine Bancshares, Inc. (the “Company” or “CIBM”) (OTCQB: CIBH), the holding company of CIBM Bank, announced its unaudited results of operations and financial condition for the second quarter of 2020. Net income for the quarter was $1.7 million compared to $0.8 million for the same period in 2019 and, for the six months ending June 30, 2020, it was $2.5 million compared to $1.4 million for the same period in 2019.
A summary of financial results for the quarter and six months ended June 30, 2020, is attached. Select highlights include:
Net income and income before taxes for the quarter and six months ended June 30th were the strongest in more than five years, excluding the deferred tax valuation adjustment made in the fourth quarter of 2017.
CIBM Bank’s mortgage banking division was a significant contributor to improved earnings results. For the six months ended June 30th, net mortgage banking revenues were $6.2 million, nearly double the same period of the prior year. Lower interest rates have fueled a surge in rate-refinance loan originations, as well as strong new home purchase activity, resulting in over $200 million in loan originations the first half of the year.
Net interest income was up $0.6 million for the first six months of 2020, compared to the same period in 2019. The primary reasons for improvement were higher average balances in loans held for sale and Paycheck Protection Program (PPP) loans, and a 54 basis point reduction in the cost of interest bearing liabilities primarily due to repricing maturing time deposits and money market rate promotions and short-term borrowings in a lower rate environment.
COVID-19 has impacted the Company in many direct and indirect ways. During the second quarter of 2020, CIBM Bank originated around 350 loans or $43 million in government guaranteed PPP loans. In addition, COVID-19 loan payment deferrals reached 87 loans, or around $75 million in total outstanding balances.
Provisions for loan losses were up $0.7 million during the six months ended June 30, 2020, versus the same period in 2019. The primary reason for the increase is environmental and qualitative factors related to the impact COVID-19 has had on the current economic conditions, including the sharp decline in GDP and rapid rise in unemployed persons. A significant number of government programs are acting to support businesses and household income so that the amount of problem loans has remained relatively low to date.
Non-performing assets, restructured loans, and loans 90 days or more past due and still accruing to total assets and nonaccrual loans to total loans were 1.02% and 0.92%, respectively, at March June 30, 2020, down from 1.35% and 1.09%, respectively, at December 31, 2019, and 1.40% and 1.12%, respectively, at June 30, 2020. The improvements during the first six months of 2020 were related to certain loan level improvements, although credit quality is expected to deteriorate in the foreseeable future due to the economic impact of COVID-19.
Mr. J. Brian Chaffin, President and CEO of CIBM, commented, “The Company has spent a significant amount of time addressing COVID-19 related issues – from managing the branches for the safety of our staff and customers, to adjusting to having more than 70% of employees work from home, to working with our clients to meet their banking needs in these challenging times. The situation has forced us to adapt and make or advance plans for improvements in both our products and delivery systems, and in our operations areas. Investors can be proud of the dedication and commitment CIBM Bank employees have exhibited through this period.
“Although income for the first half of the year was much improved over the same period of 2019, we remain committed to improving our longer term operating results using the process we call ‘Project Falcon’, which includes plans to improve our deposit mix, enhance efficiencies, and excel at our core services.”
Mr. Chaffin continued, “A Fifth Amendment to the Company’s Articles of Incorporation, which would make permanent the changes that permit the Company to engage in negotiated voluntary repurchases of its Preferred Stock, was approved by our Common Shareholders in April and has now been presented to the Preferred Shareholders for their approval at a Special Meeting of Preferred Shareholders to be held on August 5, 2020. We will provide the results of that vote on our website following the meeting.”
He concluded, “As discussed in our June 17, 2020, press release, we have completed the third and final modified Dutch auction pursuant to the Second Amendment of our Articles of Incorporation that resulted in the repurchase of 214 shares of preferred stock for a total price of approximately $148,000 representing a $33,000 discount to the carry value of the preferred shares repurchased. We will be providing a more detailed analysis in our upcoming quarterly shareholder letter.”
CIB Marine Bancshares, Inc. is the holding company for CIBM Bank, which operates eleven banking offices and five mortgage loan offices in Illinois, Wisconsin and Indiana. More information on the Company is available at www.cibmarine.com, including recent shareholder letters, links to regulatory financial reports, and audited financial statements.
FORWARD-LOOKING STATEMENTS
CIB Marine has made statements in this release that may constitute “forward-looking statements” within the meaning of the Private Securities Litigation Reform Act of 1995. CIB Marine intends these forward-looking statements to be subject to the safe harbor created thereby and is including this statement to avail itself of the safe harbor. Forward-looking statements are identified generally by statements containing words and phrases such as “may,” “project,” “are confident,” “should be,” “intend,” “predict,” “believe,” “plan,” “expect,” “estimate,” “anticipate” and similar expressions. These forward-looking statements reflect CIB Marine’s current views with respect to future events and financial performance that are subject to many uncertainties and factors relating to CIB Marine’s operations and the business environment, which could change at any time.
There are inherent difficulties in predicting factors that may affect the accuracy of forward-looking statements.
Stockholders should note that many factors, some of which are discussed elsewhere in this Earnings Release and in the documents that are incorporated by reference, could affect the future financial results of CIB Marine and could cause those results to differ materially from those expressed in forward-looking statements contained or incorporated by reference in this document. These factors, many of which are beyond CIB Marine’s control, include but are not limited to:
operating, legal, execution, credit, market, security (including cyber), and regulatory risks;
economic, political, and competitive forces affecting CIB Marine’s banking business;
the impact on net interest income and securities values from changes in monetary policy and general economic and political conditions; and
the risk that CIB Marine’s analyses of these risks and forces could be incorrect and/or that the strategies developed to address them could be unsuccessful.
These factors should be considered in evaluating the forward-looking statements, and undue reliance should not be placed on such statements. Forward-looking statements speak only as of the date they are made. CIB Marine undertakes no obligation to update or revise any forward-looking statements, whether as a result of new information, future events, or otherwise. Forward-looking statements are subject to significant risks and uncertainties and CIB Marine’s actual results may differ materially from the results discussed in forward-looking statements.
FOR INFORMATION CONTACT:
J. Brian Chaffin, President & CEO
(217) 355-0900
brian.chaffin@cibmbank.com
CIB MARINE BANCSHARES, INC.
Selected Unaudited Consolidated Financial Data
At or for the
Quarters Ended 6 Months Ended
June 30, March 31, December 31, September 30, June 30, June 30, June 30,
2020 2020 2019 2019 2019 2020 2019
(Dollars in thousands, except share and per share data)
Selected Statement of Operations Data
Interest and dividend income $ 6,669 $ 6,636 $ 6,820 $ 7,035 $ 7,078 $ 13,305 $ 14,093
Interest expense 1,343 1,689 2,030 2,183 2,256 3,032 4,434
Net interest income 5,326 4,947 4,790 4,852 4,822 10,273 9,659
Provision for (reversal of) loan losses 249 202 715 327 (67 ) 451 (225 )
Net interest income after provision for (reversal of) loan losses 5,077 4,745 4,075 4,525 4,889 9,822 9,884
Noninterest income (1) 4,489 2,642 2,249 3,835 2,710 7,131 4,072
Noninterest expense 7,308 6,322 6,879 7,233 6,557 13,630 12,062
Income (loss) before income taxes 2,258 1,065 (555 ) 1,127 1,042 3,323 1,894
Income tax expense (benefit) 575 281 (180 ) 93 281 856 510
Net income (loss) $ 1,683 $ 784 $ (375 ) $ 1,034 $ 761 $ 2,467 $ 1,384
Common Share Data
Basic net income (loss) per share (2) $ 0.09 $ 0.04 $ (0.02 ) $ 0.07 $ 0.04 $ 0.13 $ 0.08
Diluted net income (loss) per share (2) 0.05 0.02 (0.02 ) 0.04 0.02 0.08 0.04
Dividend 0.00 0.00 0.00 0.00 0.00 0.00 0.00
Tangible book value per share (3) 3.15 3.07 2.99 3.03 2.97 3.15 2.97
Book value per share (3) 2.80 2.73 2.64 2.68 2.60 2.80 2.60
Weighted average shares outstanding - basic 18,992,550 18,724,047 18,646,427 18,455,408 18,290,674 18,858,299 18,261,584
Weighted average shares outstanding - diluted 32,402,984 32,329,698 32,329,533 32,536,354 33,083,324 32,330,877 32,950,273
Financial Condition Data
Total assets $ 793,151 $ 705,473 $ 703,791 $ 700,711 $ 708,270 $ 793,151 $ 708,270
Loans 535,692 513,992 513,705 508,758 513,755 535,692 513,755
Allowance for loan losses (8,483 ) (8,107 ) (8,007 ) (7,560 ) (7,251 ) (8,483 ) (7,251 )
Investment securities 113,303 120,105 120,398 120,648 124,784 113,303 124,784
Deposits 566,811 531,999 530,190 557,745 535,367 566,811 535,367
Borrowings 120,233 68,950 73,847 38,468 69,174 120,233 69,174
Stockholders' equity 97,347 95,841 93,404 94,082 94,035 97,347 94,035
Financial Ratios and Other Data
Performance Ratios:
Net interest margin (4) 2.96 % 3.04 % 2.86 % 2.95 % 2.89 % 3.00 % 2.91 %
Net interest spread (5) 2.76 % 2.78 % 2.55 % 2.62 % 2.58 % 2.77 % 2.61 %
Noninterest income to average assets (6) 2.36 % 1.51 % 1.28 % 2.19 % 1.52 % 1.95 % 1.14 %
Noninterest expense to average assets 3.86 % 3.67 % 3.88 % 4.14 % 3.72 % 3.77 % 3.43 %
Efficiency ratio (7) 74.61 % 83.74 % 97.57 % 83.44 % 87.45 % 78.58 % 88.26 %
Earnings on average assets (8) 0.89 % 0.45 % -0.21 % 0.59 % 0.43 % 0.68 % 0.39 %
Earnings on average equity (9) 6.97 % 3.32 % -1.56 % 4.35 % 3.28 % 5.17 % 3.02 %
Asset Quality Ratios:
Nonaccrual loans to loans (10) 0.92 % 0.97 % 1.09 % 1.14 % 1.12 % 0.92 % 1.12 %
Nonaccrual loans, restructured loans and loans 90 days or more past due and still accruing to total loans (10) 1.07 % 1.25 % 1.38 % 1.44 % 1.45 % 1.07 % 1.45 %
Nonperforming assets, restructured loans and loans 90 days or more past due and still accruing to total assets (10) 1.02 % 1.24 % 1.35 % 1.40 % 1.40 % 1.02 % 1.40 %
Allowance for loan losses to total loans (10) 1.58 % 1.58 % 1.56 % 1.49 % 1.41 % 1.58 % 1.41 %
Allowance for loan losses to nonaccrual loans, restructured loans and loans 90 days or more past due and still accruing (10) 147.79 % 126.26 % 112.66 % 103.07 % 97.34 % 147.79 % 97.34 %
Net charge-offs (recoveries) annualized to average loans (10) -0.09 % 0.08 % 0.21 % 0.01 % 0.44 % -0.01 % 0.19 %
Capital Ratios:
Total equity to total assets 12.27 % 13.59 % 13.27 % 13.43 % 13.28 % 12.27 % 13.28 %
Total risk-based capital ratio 15.49 % 15.36 % 15.19 % 15.18 % 15.32 % 15.49 % 15.32 %
Tier 1 risk-based capital ratio 14.23 % 14.11 % 13.94 % 13.93 % 14.07 % 14.23 % 14.07 %
Leverage capital ratio 10.82 % 11.08 % 10.71 % 10.86 % 10.64 % 10.82 % 10.64 %
Other Data:
Number of employees (full-time equivalent) 177 177 176 182 180 177 180
Number of banking facilities 11 11 11 11 11 11 11
(1) Noninterest income includes gains and losses on securities.
(2) Net income available to common stockholders in the calculation of earnings per share includes the difference between the carrying amount less the consideration paid for redeemed preferred stock of $0.3 million for the third quarter of 2019 and $0.03 million for the 2nd quarter and 6 months ended June 30, 2020.
(3) Tangible book value per share is the stockholder equity less the carry value of the preferred stock and less the goodwill and intangible assets, divided by the total shares of common outstanding. Book value per share is the stockholder equity less the liquidation preference of the preferred stock, divided by the total shares of common outstanding. Book value measures are reported inclusive of the net deferred tax assets. As presented here, shares of common outstanding excludes unvested Restricted Stock Awards.
(4) Net interest margin is the ratio of net interest income to average interest-earning assets.
(5) Net interest spread is the yield on average interest-earning assets less the rate on average interest-bearing liabilities.
(6) Noninterest income to average assets excludes gains and losses on securities.
(7) The efficiency ratio is noninterest expense divided by the sum of net interest income plus noninterest income, excluding gains and losses on securities.
(8) Earnings on average assets are net income divided by average total assets.
(9) Earnings on average equity are net income divided by average stockholders' equity.
(10) Excludes loans held for sale.
CIB MARINE BANCSHARES, INC.
Consolidated Balance Sheets (unaudited)
June 30, March 31, December 31, September 30, June 30,
2020 2020 2019 2019 2019
(Dollars in Thousands, Except Shares)
Assets
Cash and due from banks $ 9,120 $ 9,006 $ 8,970 $ 9,582 $ 8,791
Reverse repurchase agreements 18,117 3,622 11,196 4,083 18,347
Securities available for sale 110,818 117,640 117,972 118,211 122,365
Equity securities at fair value 2,485 2,465 2,426 2,437 2,419
Loans held for sale 83,997 24,988 16,928 25,347 8,450
Loans 535,692 513,992 513,705 508,758 513,755
Allowance for loan losses (8,483 ) (8,107 ) (8,007 ) (7,560 ) (7,251 )
Net loans 527,209 505,885 505,698 501,198 506,504
Federal Home Loan Bank Stock 2,948 2,947 2,587 926 2,363
Premises and equipment, net 4,679 4,769 4,274 4,504 4,643
Accrued interest receivable 1,973 1,610 1,486 1,646 1,820
Deferred tax assets, net 19,325 19,509 20,069 20,455 20,703
Other real estate owned, net 2,334 2,335 2,396 2,466 2,466
Bank owned life insurance 4,745 4,718 4,691 4,666 4,640
Goodwill and other intangible assets 142 148 154 159 165
Other assets 5,259 5,831 4,944 5,031 4,594
Total Assets $ 793,151 $ 705,473 $ 703,791 $ 700,711 $ 708,270
Liabilities and Stockholders' Equity
Deposits:
Noninterest-bearing demand $ 90,450 $ 67,459 $ 70,175 $ 63,694 $ 62,424
Interest-bearing demand 54,288 47,760 45,512 50,683 32,649
Savings 205,470 196,797 204,976 202,866 192,133
Time 216,603 219,983 209,527 240,502 248,161
Total deposits 566,811 531,999 530,190 557,745 535,367
Short-term borrowings 77,273 68,950 73,847 38,468 69,174
Long-term borrowings 42,960 0 0 0 0
Accrued interest payable 447 543 603 711 725
Other liabilities 8,313 8,140 5,747 9,705 8,969
Total liabilities 695,804 609,632 610,387 606,629 614,235
Stockholders' Equity
Preferred stock, $1 par value; 5,000,000 authorized shares at both June 30, 2020 and December 31, 2019; 7% fixed rate noncumulative perpetual issued; 40,690 shares of series A and 3,201 shares of series B; convertible; $44.1 million aggregate liquidation preference 37,308 37,490 37,490 37,489 39,384
Common stock, $1 par value; 75,000,000 authorized shares; 19,239,935 and 18,868,329 issued shares; 19,028,888 and 18,657,282 outstanding shares at June 30, 2020 and December 31, 2019, respectively. (1) 19,240 19,162 18,868 18,868 18,543
Capital surplus 161,032 160,990 161,175 161,110 160,991
Accumulated deficit (121,285 ) (122,969 ) (123,753 ) (123,377 ) (124,412 )
Accumulated other comprehensive income, net 1,586 1,702 158 526 63
Treasury stock 221,902 shares at cost (534 ) (534 ) (534 ) (534 ) (534 )
Total stockholders' equity 97,347 95,841 93,404 94,082 94,035
Total liabilities and stockholders' equity $ 793,151 $ 705,473 $ 703,791 $ 700,711 $ 708,270
(1) Both issued and outstanding shares as stated here exclude 435,157 shares and 815,395 shares of unvested restricted stock awards at June 30, 2020, and December 31, 2019, respectively.
CIB MARINE BANCSHARES, INC.
Consolidated Statements of Operations (Unaudited)
At or for the
Quarters Ended 6 Months Ended
June 30, March 31, December 31, September 30, June 30, June 30, June 30,
2020 2020 2019 2019 2019 2020 2019
(Dollars in thousands)
Interest Income
Loans $ 5,540 $ 5,703 $ 5,793 $ 5,992 $ 5,811 $ 11,243 $ 11,504
Loans held for sale 451 119 195 152 97 570 182
Securities 661 763 764 810 868 1,424 1,672
Other investments 17 51 68 81 302 68 735
Total interest income 6,669 6,636 6,820 7,035 7,078 13,305 14,093
Interest Expense
Deposits 1,263 1,512 1,856 2,027 1,949 2,775 3,754
Short-term borrowings 54 177 174 156 307 231 680
Long-term borrowings 26 0 0 0 0 26 0
Total interest expense 1,343 1,689 2,030 2,183 2,256 3,032 4,434
Net interest income 5,326 4,947 4,790 4,852 4,822 10,273 9,659
Provision for (reversal of) loan losses 249 202 715 327 (67 ) 451 (225 )
Net interest income after provision for (reversal of) loan losses 5,077 4,745 4,075 4,525 4,889 9,822 9,884
Noninterest Income
Deposit service charges 88 96 98 101 95 184 178
Other service fees 36 20 23 30 29 56 49
Mortgage banking revenue, net 3,990 2,177 2,112 2,936 2,148 6,167 3,126
Other income 266 265 129 150 179 531 344
Net gains on sale of securities available for sale 0 0 0 0 0 0 0
Unrealized gains (losses) recognized on equity securities 20 39 (11 ) 18 34 59 64
Net gains on sale of SBA loans 87 437 166 605 253 524 253
Net gains (losses) on sale of assets and (writedowns) 2 (392 ) (268 ) (5 ) (28 ) (390 ) 58
Total noninterest income 4,489 2,642 2,249 3,835 2,710 7,131 4,072
Noninterest Expense
Compensation and employee benefits 5,451 4,421 4,701 5,309 4,445 9,872 8,132
Equipment 379 363 394 335 353 742 688
Occupancy and premises 407 460 460 420 437 867 893
Data Processing 155 164 157 165 160 319 326
Federal deposit insurance 47 0 (10 ) (5 ) 66 47 148
Professional services 242 298 320 198 207 540 347
Telephone and data communication 67 68 81 86 83 135 161
Insurance 55 54 59 70 52 109 105
Other expense 505 494 717 655 754 999 1,262
Total noninterest expense 7,308 6,322 6,879 7,233 6,557 13,630 12,062
Income (losses) from operations before income taxes 2,258 1,065 (555 ) 1,127 1,042 3,323 1,894
Income tax expense (benefit) 575 281 (180 ) 93 281 856 510
Net income (loss) 1,683 784 (375 ) 1,034 761 2,467 1,384
Preferred stock dividend 0 0 0 0 0 0 0
Discount from repurchase of preferred stock 33 0 0 308 0 33 0
Net income (loss) allocated to common stockholders $ 1,716 $ 784 $ (375 ) $ 1,342 $ 761 $ 2,500 $ 1,384
Source: CIBM Bank
© 2020 GlobeNewswire, Inc.
Someone is trying to scare us into selling shares by putting up some big numbers up for sale. Not happening.
News out
CIB Marine Bancshares, Inc. Announces First Quarter 2020 Results
BROOKFIELD, Wis., April 24, 2020 (GLOBE NEWSWIRE) -- CIB Marine Bancshares, Inc. (the “Company” or “CIBM”) (OTCQB: CIBH), the holding company of CIBM Bank, announced its unaudited results of operations and financial condition for the first quarter of 2020. Net income for the quarter ended March 31, 2020, was $0.8 million or $0.04 basic and $0.02 diluted earnings per share, compared to $0.6 million or $0.03 basic and $0.02 diluted earnings per share for the same period of 2019. Pre-tax income for the quarter ended March 31, 2020, was $1.1 million compared to $0.9 million for the same period of 2019.
The increase in net income was the result of a few key factors:
The three major lines of revenue were up in the first quarter of 2020 versus the same period in the prior year. Lower rates generated increased mortgage volumes, which drove net mortgage banking revenues up $1.2 million over the first quarter of 2019; gains on sale of SBA 7(a) loans were up $0.4 million due to higher loan production in the first quarter; and net interest income was up $0.1 million and the net interest margin was up 10 basis points compared to the first quarter of 2019, due to a reduction in the cost of funds.
The provision for loan losses was up $0.4 million and our write-downs in other real estate owned were up $0.3 million for the three months ending March 31, 2020, versus the same period in 2019. The increase in provisions was primarily due to COVID-19 related deterioration of economic conditions in the first quarter of 2020, net of other factors. Further deterioration is also expected in the foreseeable future.
Non-interest expense was up $0.8 million for the three months ending March 31, 2020, compared to the same period of 2019, due primarily to higher compensation related to the increase in mortgage and SBA loan volumes.
Non-performing assets, restructured loans, and loans 90 days or more past due and still accruing to total assets and nonaccrual loans to total loans were 1.24% and 0.97%, respectively, at March 31, 2020, down from 1.35% and 1.09%, respectively, at December 31, 2019, and 1.51% and 1.29%, respectively, at March 31, 2019. The improvements during the first quarter of 2020 were related to certain loan level improvements, although credit quality is expected to deteriorate in the foreseeable future due to the economic impact of COVID-19.
Mr. J. Brian Chaffin, President and CEO of CIBM, commented, “Early in January 2020, CIBM Bank embarked on a major project designed to improve its operating performance over the coming years. This project involved nearly 40% of our employees and was focused on key revenue improvement areas as well as customer experience, products, and other matters. By the end of March, CIBM Bank was deep into our COVID-19 pandemic response – spending significant time coordinating, communicating and implementing our many internal and external responses to COVID-19. Much of our time has been spent evaluating and preparing for significant changes in operations, products, and delivery due to emerging social distancing norms, shelter in home orders by states, and the many federal support programs for individuals, businesses, and the financial sector. Our investors can be proud of the dedication and commitment CIBM Bank employees have exhibited through this period.”
He added, “Income for the first quarter of 2020 was up versus the prior year and would have been stronger by nearly $1.0 million before tax, except for some COVID-19 related charges in our mortgage pipeline due to market dislocations and disruptions in the mortgage markets, and the provision for loan losses due primarily to the near-term decline in economic conditions. Economic forecasts for the future vary widely, but one thing seems to be clear: we are experiencing a historic decline in employment and private sector economic activity due to society’s response to COVID-19. We are preparing for a significant economic downturn and credit shock in our national, regional, and local economies, and it is our aim to be a source of banking strength for our clients during these times.
“By being flexible and agile in these unprecedented times, we remain a trusted advisor for our customers. In just the few months since this pandemic began, we have assisted our clients in navigating this new world so that they can benefit from assistance from both the bank and various government programs, including the approval of more than 213 100% U.S. government guaranteed SBA Paycheck Protection Program loans, totaling over $38 million; six months of principal and interest payments to be made by the SBA on SBA 7(a) loans; and internal loan deferral programs.”
He concluded, “Our shareholder meeting will proceed as scheduled on April 30, 2020. Given the current ‘stay at home’ directives, we encourage shareholders to listen to the meeting via teleconference, as outlined in the Proxy Statement.”
CIB Marine Bancshares, Inc. is the holding company for CIBM Bank, which operates eleven banking offices and five mortgage loan offices in Illinois, Wisconsin and Indiana. More information on the Company is available at www.cibmarine.com, including recent shareholder letters, links to regulatory financial reports, and audited financial statements.
FORWARD-LOOKING STATEMENTS
CIB Marine has made statements in this release that may constitute “forward-looking statements” within the meaning of the Private Securities Litigation Reform Act of 1995. CIB Marine intends these forward-looking statements to be subject to the safe harbor created thereby and is including this statement to avail itself of the safe harbor. Forward-looking statements are identified generally by statements containing words and phrases such as “may,” “project,” “are confident,” “should be,” “intend,” “predict,” “believe,” “plan,” “expect,” “estimate,” “anticipate” and similar expressions. These forward-looking statements reflect CIB Marine’s current views with respect to future events and financial performance that are subject to many uncertainties and factors relating to CIB Marine’s operations and the business environment, which could change at any time.
There are inherent difficulties in predicting factors that may affect the accuracy of forward-looking statements.
Stockholders should note that many factors, some of which are discussed elsewhere in this Earnings Release and in the documents that are incorporated by reference, could affect the future financial results of CIB Marine and could cause those results to differ materially from those expressed in forward-looking statements contained or incorporated by reference in this document. These factors, many of which are beyond CIB Marine’s control, include but are not limited to:
operating, legal, execution, credit, market, security (including cyber), and regulatory risks;
economic, political, and competitive forces affecting CIB Marine’s banking business;
the impact on net interest income and securities values from changes in monetary policy and general economic and political conditions; and
the risk that CIB Marine’s analyses of these risks and forces could be incorrect and/or that the strategies developed to address them could be unsuccessful.
These factors should be considered in evaluating the forward-looking statements, and undue reliance should not be placed on such statements. Forward-looking statements speak only as of the date they are made. CIB Marine undertakes no obligation to update or revise any forward-looking statements, whether as a result of new information, future events, or otherwise. Forward-looking statements are subject to significant risks and uncertainties and CIB Marine’s actual results may differ materially from the results discussed in forward-looking statements.
FOR INFORMATION CONTACT:
J. Brian Chaffin, President & CEO
(217) 355-0900
brian.chaffin@cibmbank.com
CIB MARINE BANCSHARES, INC.
Selected Unaudited Consolidated Financial Data
At or for the
Quarters Ended 3 Months Ended
March 31, December 31, September 30, June 30, March 31, March 31, March 31,
2020 2019 2019 2019 2019 2020 2019
(Dollars in thousands, except share and per share data)
Selected Statement of Operations Data
Interest and dividend income $ 6,636 $ 6,820 $ 7,035 $ 7,078 $ 7,015 $ 6,636 $ 7,015
Interest expense 1,689 2,030 2,183 2,256 2,178 1,689 2,178
Net interest income 4,947 4,790 4,852 4,822 4,837 4,947 4,837
Provision for (reversal of) loan losses 202 715 327 (67 ) (158 ) 202 (158 )
Net interest income after provision for
(reversal of) loan losses 4,745 4,075 4,525 4,889 4,995 4,745 4,995
Noninterest income (1) 2,642 2,249 3,835 2,710 1,362 2,642 1,362
Noninterest expense 6,322 6,879 7,233 6,557 5,505 6,322 5,505
Income (loss) before income taxes 1,065 (555 ) 1,127 1,042 852 1,065 852
Income tax expense (benefit) 281 (180 ) 93 281 229 281 229
Net income (loss) $ 784 $ (375 ) $ 1,034 $ 761 $ 623 $ 784 $ 623
Common Share Data
Basic net income (loss) per share (2) $ 0.04 $ (0.02 ) $ 0.07 $ 0.04 $ 0.03 $ 0.04 $ 0.03
Diluted net income (loss) per share (2) 0.02 (0.02 ) 0.04 0.02 0.02 0.02 0.02
Dividend 0.00 0.00 0.00 0.00 0.00 0.00 0.00
Tangible book value per share (3) 3.07 2.99 3.03 2.97 2.90 3.07 2.90
Book value per share (3) 2.73 2.64 2.68 2.60 2.53 2.73 2.53
Weighted average shares outstanding - basic 18,724,047 18,646,427 18,455,408 18,290,674 18,232,169 18,724,047 18,232,169
Weighted average shares outstanding - diluted 32,329,698 32,329,533 32,536,354 33,009,983 32,815,744 32,329,698 32,815,744
Financial Condition Data
Total assets $ 705,473 $ 703,791 $ 700,711 $ 708,270 $ 702,152 $ 705,473 $ 702,152
Loans 513,992 513,705 508,758 513,755 489,273 513,992 489,273
Allowance for loan losses (8,107 ) (8,007 ) (7,560 ) (7,251 ) (7,865 ) (8,107 ) (7,865 )
Investment securities 120,105 120,398 120,648 124,784 123,500 120,105 123,500
Deposits 531,999 530,190 557,745 535,367 542,938 531,999 542,938
Borrowings 68,950 73,847 38,468 69,174 57,220 68,950 57,220
Stockholders' equity 95,841 93,404 94,082 94,035 92,507 95,841 92,507
Financial Ratios and Other Data
Performance Ratios:
Net interest margin (4) 3.04 % 2.86 % 2.95 % 2.89 % 2.94 % 3.04 % 2.94 %
Net interest spread (5) 2.78 % 2.55 % 2.62 % 2.58 % 2.64 % 2.78 % 2.64 %
Noninterest income to average assets (6) 1.51 % 1.28 % 2.19 % 1.52 % 0.76 % 1.51 % 0.76 %
Noninterest expense to average assets 3.67 % 3.88 % 4.14 % 3.72 % 3.14 % 3.67 % 3.14 %
Efficiency ratio (7) 83.74 % 97.57 % 83.44 % 87.45 % 89.24 % 83.74 % 89.24 %
Earnings on average assets (8) 0.45 % -0.21 % 0.59 % 0.43 % 0.36 % 0.45 % 0.36 %
Earnings on average equity (9) 3.32 % -1.56 % 4.35 % 3.28 % 2.76 % 3.32 % 2.76 %
Asset Quality Ratios:
Nonaccrual loans to loans (10) 0.97 % 1.09 % 1.14 % 1.12 % 1.29 % 0.97 % 1.29 %
Nonaccrual loans, restructured loans and
loans 90 days or more past due and still
accruing to total loans (10) 1.25 % 1.38 % 1.44 % 1.45 % 1.66 % 1.25 % 1.66 %
Nonperforming assets, restructured loans
and loans 90 days or more past due and still
accruing to total assets (10) 1.24 % 1.35 % 1.40 % 1.40 % 1.51 % 1.24 % 1.51 %
Allowance for loan losses to total loans (10) 1.58 % 1.56 % 1.49 % 1.41 % 1.61 % 1.58 % 1.61 %
Allowance for loan losses to nonaccrual loans,
restructured loans and loans 90 days or
more past due and still accruing (10) 126.26 % 112.66 % 103.07 % 97.34 % 96.96 % 126.26 % 96.96 %
Net charge-offs (recoveries) annualized
to average loans (10) 0.08 % 0.21 % 0.01 % 0.44 % -0.06 % 0.08 % -0.06 %
Capital Ratios:
Total equity to total assets 13.59 % 13.27 % 13.43 % 13.28 % 13.17 % 13.59 % 13.17 %
Total risk-based capital ratio 15.36 % 15.19 % 15.18 % 15.32 % 15.56 % 15.36 % 15.56 %
Tier 1 risk-based capital ratio 14.11 % 13.94 % 13.93 % 14.07 % 14.31 % 14.11 % 14.31 %
Leverage capital ratio 11.08 % 10.71 % 10.86 % 10.64 % 10.39 % 11.08 % 10.39 %
Other Data:
Number of employees (full-time equivalent) 177 176 182 180 177 177 177
Number of banking facilities 11 11 11 11 11 11 11
(1) Noninterest income includes gains and losses on securities.
(2) Net income available to common stockholders in the calculation of earnings per share includes the difference between the carrying amount less the consideration paid for redeemed preferred stock of $0.3 million for the third quarter of 2019 and twelve months ended December 31, 2019.
(3) Tangible book value per share is the stockholder equity less the carry value of the preferred stock and less the goodwill and intangible assets, divided by the total shares of common outstanding. Book value per share is the stockholder equity less the liquidation preference of the preferred stock, divided by the total shares of common outstanding. Book value measures are reported inclusive of the net deferred tax assets. As presented here, shares of common outstanding excludes unvested Restricted Stock Awards.
(4) Net interest margin is the ratio of net interest income to average interest-earning assets.
(5) Net interest spread is the yield on average interest-earning assets less the rate on average interest-bearing liabilities.
(6) Noninterest income to average assets excludes gains and losses on securities.
(7) The efficiency ratio is noninterest expense divided by the sum of net interest income plus noninterest income, excluding gains and losses on securities.
(8) Earnings on average assets are net income divided by average total assets.
(9) Earnings on average equity are net income divided by average stockholders' equity.
(10) Excludes loans held for sale.
CIB MARINE BANCSHARES, INC.
Consolidated Balance Sheets (unaudited)
March 31, December 31, September 30, June 30, March 31,
2020 2019 2019 2019 2019
(Dollars in Thousands, Except Shares)
Assets
Cash and due from banks $ 9,006 $ 8,970 $ 9,582 $ 8,791 $ 8,168
Reverse repurchase agreements 3,622 11,196 4,083 18,347 42,729
Securities available for sale 117,640 117,972 118,211 122,365 121,115
Equity securities at fair value 2,465 2,426 2,437 2,419 2,385
Loans held for sale 24,988 16,928 25,347 8,450 4,467
Loans 513,992 513,705 508,758 513,755 489,273
Allowance for loan losses (8,107 ) (8,007 ) (7,560 ) (7,251 ) (7,865 )
Net loans 505,885 505,698 501,198 506,504 481,408
Federal Home Loan Bank Stock 2,947 2,587 926 2,363 2,003
Premises and equipment, net 4,769 4,274 4,504 4,643 4,538
Accrued interest receivable 1,610 1,486 1,646 1,820 1,873
Deferred tax assets, net 19,509 20,069 20,455 20,703 21,156
Other real estate owned, net 2,335 2,396 2,466 2,466 2,466
Bank owned life insurance 4,718 4,691 4,666 4,640 4,613
Goodwill and other intangible assets 148 154 159 165 171
Other assets 5,831 4,944 5,031 4,594 5,060
Total Assets $ 705,473 $ 703,791 $ 700,711 $ 708,270 $ 702,152
Liabilities and Stockholders' Equity
Deposits:
Noninterest-bearing demand $ 67,459 $ 70,175 $ 63,694 $ 62,424 $ 62,553
Interest-bearing demand 47,760 45,512 50,683 32,649 32,467
Savings 196,797 204,976 202,866 192,133 188,110
Time 219,983 209,527 240,502 248,161 259,808
Total deposits 531,999 530,190 557,745 535,367 542,938
Short-term borrowings 68,950 73,847 38,468 69,174 57,220
Accrued interest payable 543 603 711 725 727
Other liabilities 8,140 5,747 9,705 8,969 8,760
Total liabilities 609,632 610,387 606,629 614,235 609,645
Stockholders' Equity
Preferred stock, $1 par value; 5,000,000 authorized shares at both March 31, 2020 and December 31, 2019; 7% fixed rate noncumulative perpetual issued; 40,888 shares of series A and 3,217 shares of series B; convertible; $44.1 million aggregate liquidation preference 37,490 37,490 37,489 39,384 39,384
Common stock, $1 par value; 75,000,000 authorized shares; 19,162,637 and 18,868,329 issued shares; 18,951,590 and 18,657,282 outstanding shares at March 31, 2020 and December 31, 2019, respectively. (1) 19,162 18,868 18,868 18,543 18,456
Capital surplus 160,990 161,175 161,110 160,991 160,930
Accumulated deficit (122,969 ) (123,753 ) (123,377 ) (124,412 ) (125,173 )
Accumulated other comprehensive income (loss), net 1,702 158 526 63 (556 )
Treasury stock 221,902 shares at cost (534 ) (534 ) (534 ) (534 ) (534 )
Total stockholders' equity 95,841 93,404 94,082 94,035 92,507
Total liabilities and stockholders' equity $ 705,473 $ 703,791 $ 700,711 $ 708,270 $ 702,152
(1) Both issued and outstanding shares as stated here exclude 521,087 shares and 815,395 shares of unvested restricted stock awards at March 31,2020 and December 31, 2019, respectively.
CIB MARINE BANCSHARES, INC.
Consolidated Statements of Operations (Unaudited)
At or for the
Quarters Ended 3 Months Ended
March 31, December 31, September 30, June 30, March 31, March 31, March 31,
2020 2019 2019 2019 2019 2020 2019
(Dollars in thousands)
Interest Income
Loans $ 5,703 $ 5,793 $ 5,992 $ 5,811 $ 5,693 $ 5,703 $ 5,693
Loans held for sale 119 195 152 97 85 119 85
Securities 763 764 810 868 804 763 804
Other investments 51 68 81 302 433 51 433
Total interest income 6,636 6,820 7,035 7,078 7,015 6,636 7,015
Interest Expense
Deposits 1,512 1,856 2,027 1,949 1,805 1,512 1,805
Short-term borrowings 177 174 156 307 373 177 373
Total interest expense 1,689 2,030 2,183 2,256 2,178 1,689 2,178
Net interest income 4,947 4,790 4,852 4,822 4,837 4,947 4,837
Provision for (reversal of) loan losses 202 715 327 (67 ) (158 ) 202 (158 )
Net interest income after provision for
(reversal of) loan losses 4,745 4,075 4,525 4,889 4,995 4,745 4,995
Noninterest Income
Deposit service charges 96 98 101 95 83 96 83
Other service fees 20 23 30 29 20 20 20
Mortgage banking revenue, net 2,177 2,112 2,936 2,148 978 2,177 978
Other income 265 129 150 179 165 265 165
Net gains on sale of securities available for sale 0 0 0 0 0 0 0
Unrealized gains (losses) recognized on equity securities 39 (11 ) 18 34 30 39 30
Net gains on sale of SBA loans 437 166 605 253 0 437 0
Net gains (losses) on sale of assets and (writedowns) (392 ) (268 ) (5 ) (28 ) 86 (392 ) 86
Total noninterest income 2,642 2,249 3,835 2,710 1,362 2,642 1,362
Noninterest Expense
Compensation and employee benefits 4,421 4,701 5,309 4,445 3,687 4,421 3,687
Equipment 363 394 335 353 335 363 335
Occupancy and premises 460 460 420 437 456 460 456
Data Processing 164 157 165 160 166 164 166
Federal deposit insurance 0 (10 ) (5 ) 66 82 0 82
Professional services 298 320 198 207 140 298 140
Telephone and data communication 68 81 86 83 78 68 78
Insurance 54 59 70 52 53 54 53
Other expense 494 717 655 754 508 494 508
Total noninterest expense 6,322 6,879 7,233 6,557 5,505 6,322 5,505
Income (losses) from operations
before income taxes 1,065 (555 ) 1,127 1,042 852 1,065 852
Income tax expense (benefit) 281 (180 ) 93 281 229 281 229
Net income (loss) 784 (375 ) 1,034 761 623 784 623
Preferred stock dividend 0 0 0 0 0 0 0
Discount from repurchase of preferred stock 0 0 308 0 0 0 0
Net income (loss) allocated to
common stockholders $ 784 $ (375 ) $ 1,342 $ 761 $ 623 $ 784 $ 623
Source: CIBM Bank
© 2020 GlobeNewswire, Inc.
Good Morning Rocks!!! That's what I'm referring to. If the vote to enact the RS is successful. That's how the PPS goes above the $5.00 mark for institutional investors to step in as you say.
2. To approve a fourth amendment (the “Fourth Amendment”) to the Company’s Amended and Restated Articles of Incorporation, as previously amended (the “Articles of Incorporation”), to authorize the Board of Directors to effect a 1:15 reverse stock split of the Company’s common shares
YOU’RE ALIVE! I have to disagree with you respectfully. This is an opportunity to have institutional investors step in and purchase some shares. This stock (with a P/E of about 15 now) will have some buyers if we can get above the $5.00 restriction that most investment firms require. I would be worried if we were doing a reverse split. This has been mentioned in the past meetings. Opening up the window to reach out and purchase preferred stock from three years to forever is a big thing. As we buy preferred shares back, the common stock becomes more valuable. I hope they don’t do a reverse split and then dilute with an equity investment. I have full faith in the management to “do the right thing” and try and make the commons money. At last count, I think 8 percent of the commons were insiders. They won’t shoot themselves in the foot.......
Just my take. If the RS is enacted, this will likely trail downward for awhile. I've seen these happen again and again and in the short term they usually always trail downward. It's the reality of this situation. If enacted, the environment we've currently entered economically will likely cause that downward trend to be a bit more severe. If I were to guess, I'd say $10(just a guess)is likely, possibly much lower given the grim economic situation this country currently faces.
The positive side of this scenario... This isn't a typical OTC crap shoot Ticker. This is a real community bank that weathered the storm of the financial crisis(Just Barely) and they have re-built quite nicely since the lowly lows of sub-penny carnage we witnessed over a decade ago. I can't believe I'm saying that, "over a decade ago". With that said, there will be support and buyers at many levels if it trails downward. In the long term this will likely emerge from an initial RS slump and enter much higher ground.
Although, once again this current economic scenario we're in could factor in as a major disruptor in the big picture scenario creating much more resistance moving forward if it does hit a larger slump. How much and to what extent remains to be seen... and again this is just my opinion but I believe we have a long road ahead of us as a country and of course economically.
Hope everyone is doing well!!! Stay Safe out there, and remain hypervigilant.
There were 1,000,000 shares traded the other day for .99 or so. Didn’t move the stock one way or another. I’m sure they were waiting to buy at a lower price, but that never came. When and if the shares go to $ 15.00, the institutional buyers will be able to purchase. They can’t buy this under $5.00. I think the best plan is to have that in your back pocket, only used if you have to. We should still keep buying the preferred back at a reasonable price. Let the dust settle from this crap, and re-group. Our SBA loan department should be busy for sure...hopefully we can make money off that.
You may be right but if no one wants it at 1.10 what makes you think they want it at 15.00-20.00? Thats the main worry for me. If any dilution or a seller decides to let go of some shares it could fall back under 5.00 in a heart beat. But I admit I dont have any clue how the institutional investing side of how things work or how preferreds play into it. I am just thinking from an OTC stock trader side of it.
I disagree. It will make available for purchase by real investors.
I am not a fan of a RS on an all ready thinly trading stock. It decreases our shares and will become even thinner post RS. Even if one small seller hits after the split it could drive the price down right back to pre split prices.
I think it’s great to make the changes. This will allow them to make purchases of the preferred shares when the money/opportunity arises. Every share they buy back will increase the value of the common stock. The reverse split mathematically will have no effect. From an institutional investment standpoint, it will allow capital infusion from the investment banking side to occur. As long as they DO NOT dilute the existing common shareholders just to buy out the 73 percent of the preferred shares. All of us here know that the bank has never paid a dividend on the common. The real end game that the commons have is that maybe someday we WILL be able to, OR get a big payday when/if they MERGE/ACQUIRE/SELL. I do NOT want a sale. I do however want to make money in the long run. I am for whatever happens to line my pockets in the long term (5 years from now). Most of the long term people I know would probably be ok with that. It would be hard to see a merger for sure, but as the traffic decreases in facilities around the country, mergers and acquisitions occur a lot. The big boys are hated by the community, and lose tons of customers to the locals. So I am against teaming up at this point. MCB, Busey, Longview Capital, UCB have been in the acquisition mode over the last 10 years. I would say that we would fit best in the MCB, UCB model the best. MCB seems to have a way of growth without hardly and disruption to the community banking format. UCB is also great with that. Busey is the worst.......
Shareholder Meeting voting.
What any oy you guys think about these 2 agenda items:
2. To approve a fourth amendment (the “Fourth Amendment”) to the Company’s Amended and Restated Articles of Incorporation, as previously amended (the “Articles of Incorporation”), to authorize the Board of Directors to effect a 1:15 reverse stock split of the Company’s common shares
3. To approve a fifth amendment (the “Fifth Amendment”) to the Articles of Incorporation to make certain changes to the rights and preferences of the Company’s 7 Percent Fixed Rate Noncumulative Nonconvertible Perpetual Preferred Stock, Series A (“Series A Preferred”) and its 7 Percent Fixed Rate Noncumulative Convertible Perpetual Preferred Stock, Series B (“Series B Preferred” and, together with the Series A Preferred, the “Preferred Stock”), subject to the approval of the requisite number of shares of Series A Preferred and Series B Preferred
Any and all feedback / discussion welcome.
Who knows. Maybe the market makers had a deal to acquire this amount under a certain amount. I know the bank cannot repurchase the commons, but someone may have swapped an equivalent amount of preferred shares to common. This would eliminate some of the preferred and allow the company to further reduce the amount of class A and B outstanding. Just a thought.
probably prearranged imo
That's pretty remarkable. Who had a million to sell and at that price?
added a few .9999 when i seen that big buy wasnt much left
I saw that. So they bought 5.4% of the outstanding shares for a $1.00. Good buy for sure. I hope to still snag my 24k back soon.
1 million shares were just bought at .9999
.88 man this sucks
My bad. I had a margin call on my SIRI shares. I’m not the only one with a call......
|
Followers
|
30
|
Posters
|
|
|
Posts (Today)
|
0
|
Posts (Total)
|
5847
|
|
Created
|
05/14/10
|
Type
|
Free
|
| Moderators | |||
Principal Executive Offices
Elizabeth Neighbors, Paralegal and Investor Relations Manager
1930 W. Bluemound Road, Suite D
Waukesha, WI 53186
Phone: 262.695.6010
Fax: 262.695.8319
Email: shareholderrelations@cibmarine.com
CIB MARINE BANCSHARES INC.
Outstanding Shares: 18,135,344 (Mar 31, 2017)
Float: 16,780,711 (Mar 31, 2017)
Company Officers/Contacts
Brian Chaffin (President, CEO)
Patrick Straka (EVP, CFO)
Daniel Rasmussen (EVP, Secretary, General Counsel, Chief Admin. Officer)
Paul Melnick (EVP, Chief Credit Officer)
Elizabeth Neighbors (IR Manager, Asst. Secretary)
Company Directors
Mark Elste (Chairman)
Charles Baker
Brian Chaffin
Mark Henderson
John Hickey
Willard Bunn III
Gary Longman
Charles Mires
Steven Palmitier
Ronald Rhoades
Summary
CIB Marine Bancshares, Inc. is a bank holding company with its principal executive offices in Waukesha, Wisconsin, a suburb of Milwaukee.
CIB Marine Bancshares, Inc. owns and operates CIBM Bank, which serves communities throughout Central Illinois; Indianapolis, Indiana; Milwaukee, Wisconsin and Chicago, IL; through its full-service banking offices. CIBM Bank operates under the name “Central Illinois Bank” in its central Illinois market, “Marine Bank” in its Indiana and Wisconsin markets and "Avenue Bank" in its Chicagoland market.
CIBM Bank offers a full array of traditional banking services, including a broad range of loan products, such as commercial loans, commercial real estate loans, commercial and residential construction loans, one-to-four family residential real estate loans, consumer loans, and commercial and standby letters of credit; acceptance of demand, savings and time deposits; commercial paper and repurchase agreements; and other banking services
CIB Marine Bancshares, Inc. owns and operates 11 branches in these markets
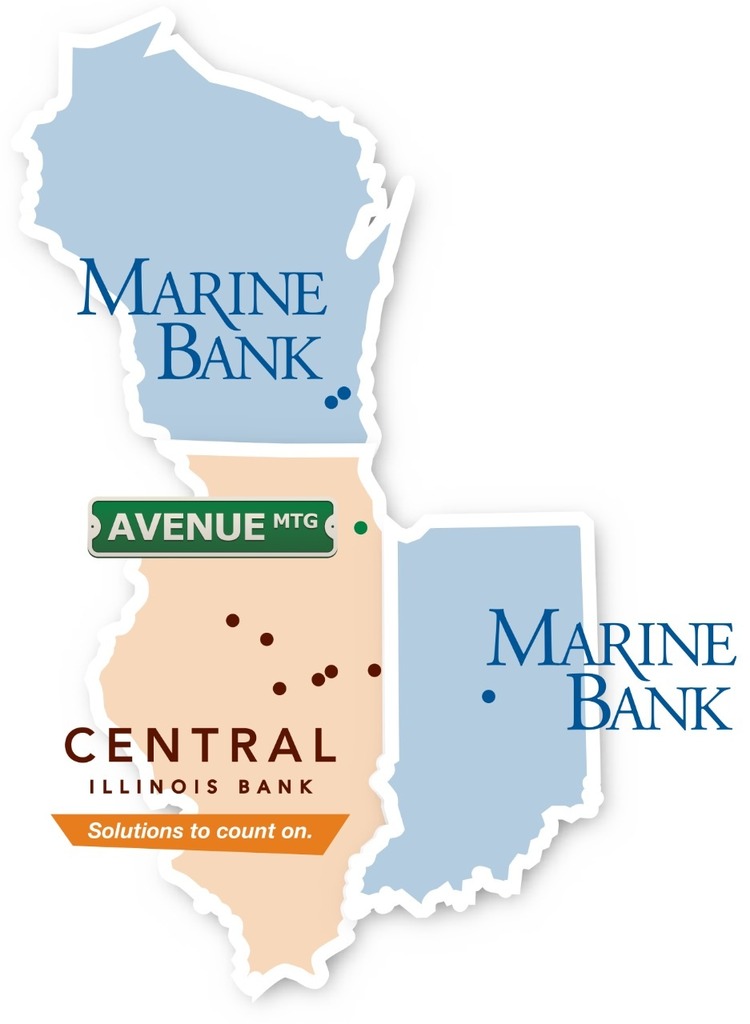
Waukesha, WI

Elm Grove, WI

Indianapolis, IN

Wheaton, IL

Danville, IL
Urbana, IL
Champaign, IL (Midtown)

Champaign, IL

Monticello, IL

Bloomington, IL
Peoria, IL
CIBH Effective Date Forward (10/29/09):
| Volume | |
| Day Range: | |
| Bid Price | |
| Ask Price | |
| Last Trade Time: |


