 News
News  Market Data
  Discover
Support: 888-992-3836
Copyright © 2023 InvestorsHub Inc.


Register for free to join our community of investors and share your ideas. You will also get access to streaming quotes, interactive charts, trades, portfolio, live options flow and more tools.
I really should be liquidating everything and putting it all in CIBH at these levels.
News hit at the closing bell.
CIB Marine Bancshares, Inc. Announces 2019 Results
BROOKFIELD, Wis., Jan. 24, 2020 (GLOBE NEWSWIRE) -- CIB Marine Bancshares, Inc. (the “Company” or “CIBM”) (OTCQB: CIBH), the holding company of CIBM Bank, announced its unaudited results of operations and financial condition for the fourth quarter and year-end 2019. Net income for the year ended December 31, 2019, was $2.0 million or $0.13 basic and $0.07 diluted earnings per share, compared to $3.3 million or $0.28 basic and $0.15 diluted earnings per share for the same period of 2018.
Lower income for the year was the result of a few key factors:
The provision for loan losses was $0.8 million in 2019 compared to a $1.2 million reversal of provision in 2018. Although credit quality measures overall were improved, as highlighted below, impairments on a few loans resulted in a provision to loan losses of $0.7 million during the fourth quarter of 2019 compared to a reversal of $1.2 million for the same period of 2018.
Total gains on the sale of SBA 7(a) loans for the year 2019 declined by $1.1 million compared to 2018 due to a $6 million decline in loans originated for sale and lower premiums on loans sold. The decline reflects the broader industry experience for the year.
Cost of interest bearing liabilities increased 38 basis points from 2018 to 2019 as deposit pricing pressure for time deposits and money market accounts began building in the latter half of 2018 and continued into 2019. As a result, the net interest margin declined by 14 basis points and net interest income declined by $0.5 million in 2019 compared to 2018.
Some highlights of 2019 included:
Mortgage division income before tax increased by $1.0 million for the full year compared to 2018, the result of an increase of approximately $55 million in residential loans originated for sale.
Tangible book value per share and stated book value per share at December 31, 2019, were $2.99 and $2.64 per share of common stock, respectively, reflecting increases of $0.17 and $0.19 versus the prior year-end. The increases were due primarily to $2.0 million in net income; a $1.4 million improvement in accumulated other comprehensive income; and a $0.3 million discount to the carry value of the preferred stock repurchased in 2019, which was accretive to the common shareholders.
Although the cost of interest bearing liabilities was higher overall for the year, it declined by 13 basis points during the fourth quarter as renewing 12-month time deposits and money market accounts with one-year introductory rates were repriced in a lower rate environment.
Non-performing assets, restructured loans, and loans 90 days or more past due and still accruing to total assets and nonaccrual loans to total loans was 1.35% and 1.09%, respectively, at December 31, 2019, compared to 1.45% and 1.34%, respectively, at December 31, 2018.
Mr. J. Brian Chaffin, President and CEO of CIBM, commented, “Although we showed solid results in a number of areas where goals and budgets were met or exceeded – including our corporate banking and mortgage divisions – the higher loan loss provisions resulting from a few loans, higher cost of funds, and lower SBA originations were setbacks in 2019 that resulted in lower than expected overall operating results. In the fourth quarter of 2019, management, working with the Board of Directors, commenced a targeted improvement process with objectives to drive better results in the future. This process is directed at cost of funds, product mix and margins, cost controls and other matters related to the company’s culture, brand, and customer experience.”
Regarding preferred stock repurchases, he stated, “We settled our outstanding preferred stock repurchases during the fourth quarter of 2019 and early 2020. This included the repurchase of 2,229 shares of preferred stock as part of the second of three planned modified Dutch auctions, and 4,923 preferred shares that were subject to repurchase pursuant to a negotiated repurchase agreement entered into in 2018. The total purchase price was $5.1 million. CIB Marine did not issue any new capital or debt to pay for the repurchases and no longer has any outstanding liabilities in its balance sheet for agreements to repurchase stock. Total repurchased shares to date amount to approximately 26% of the 60,000 shares of preferred stock originally issued in 2009 and the shares repurchased to date included 1,159 shares of Series B preferred stock, effectively terminating conversion rights equal to 4.6 million shares of common stock.
“CIB Marine plans to hold the third and final modified Dutch auction during the first half of 2020. More information will be forthcoming,” he concluded.
CIB Marine Bancshares, Inc. is the holding company for CIBM Bank, which operates eleven banking offices and four mortgage loan offices in Illinois, Wisconsin and Indiana. More information on the Company is available at www.cibmarine.com, including recent shareholder letters, links to regulatory financial reports, and audited financial statements.
FORWARD-LOOKING STATEMENTS
CIB Marine has made statements in this release that may constitute “forward-looking statements” within the meaning of the Private Securities Litigation Reform Act of 1995. CIB Marine intends these forward-looking statements to be subject to the safe harbor created thereby and is including this statement to avail itself of the safe harbor. Forward-looking statements are identified generally by statements containing words and phrases such as “may,” “project,” “are confident,” “should be,” “intend,” “predict,” “believe,” “plan,” “expect,” “estimate,” “anticipate” and similar expressions. These forward-looking statements reflect CIB Marine’s current views with respect to future events and financial performance that are subject to many uncertainties and factors relating to CIB Marine’s operations and the business environment, which could change at any time.
There are inherent difficulties in predicting factors that may affect the accuracy of forward-looking statements.
Stockholders should note that many factors, some of which are discussed elsewhere in this Earnings Release and in the documents that are incorporated by reference, could affect the future financial results of CIB Marine and could cause those results to differ materially from those expressed in forward-looking statements contained or incorporated by reference in this document. These factors, many of which are beyond CIB Marine’s control, include but are not limited to:
operating, legal, execution, credit, market, security (including cyber), and regulatory risks;
economic, political, and competitive forces affecting CIB Marine’s banking business;
the impact on net interest income and securities values from changes in monetary policy and general economic and political conditions; and
the risk that CIB Marine’s analyses of these risks and forces could be incorrect and/or that the strategies developed to address them could be unsuccessful.
These factors should be considered in evaluating the forward-looking statements, and undue reliance should not be placed on such statements. Forward-looking statements speak only as of the date they are made. CIB Marine undertakes no obligation to update or revise any forward-looking statements, whether as a result of new information, future events, or otherwise. Forward-looking statements are subject to significant risks and uncertainties and CIB Marine’s actual results may differ materially from the results discussed in forward-looking statements.
FOR INFORMATION CONTACT:
J. Brian Chaffin, President & CEO
(217) 355-0900
brian.chaffin@cibmbank.com
CIB MARINE BANCSHARES, INC.
Selected Unaudited Consolidated Financial Data
At or for the
Quarters Ended 12 Months Ended
December 31, September 30, June 30, March 31, December 31, December 31, December 31,
2019 2019 2019 2019 2018 2019 2018
(Dollars in thousands, except share and per share data)
Selected Statement of Operations Data
Interest and dividend income $ 6,820 $ 7,035 $ 7,078 $ 7,015 $ 7,009 $ 27,948 $ 26,203
Interest expense 2,030 2,183 2,256 2,178 2,064 8,647 6,422
Net interest income 4,790 4,852 4,822 4,837 4,945 19,301 19,781
Provision for (reversal of) loan losses 715 327 (67 ) (158 ) (1,195 ) 817 (1,185 )
Net interest income after provision for
(reversal of) loan losses 4,075 4,525 4,889 4,995 6,140 18,484 20,966
Noninterest income (1) 2,249 3,835 2,710 1,362 1,546 10,156 9,409
Noninterest expense 6,879 7,233 6,557 5,505 6,415 26,174 25,847
Income (loss) before income taxes (555 ) 1,127 1,042 852 1,271 2,466 4,528
Income tax expense (benefit) (180 ) 93 281 229 313 423 1,188
Net income (loss) $ (375 ) $ 1,034 $ 761 $ 623 $ 958 $ 2,043 $ 3,340
Common Share Data
Basic net income (loss) per share (2) $ (0.02 ) $ 0.07 $ 0.04 $ 0.03 $ 0.05 $ 0.13 $ 0.28
Diluted net income (loss) per share (2) (0.02 ) 0.04 0.02 0.02 0.03 0.07 0.15
Dividend 0.00 0.00 0.00 0.00 0.00 0.00 0.00
Tangible book value per share (3) 2.99 3.03 2.97 2.90 2.82 2.99 2.82
Book value per share (3) 2.64 2.68 2.60 2.53 2.45 2.64 2.45
Weighted average shares outstanding - basic 18,646,427 18,455,408 18,290,674 18,232,169 18,232,169 18,406,663 18,209,096
Weighted average shares outstanding - diluted 32,329,533 32,536,354 33,009,983 32,815,744 32,757,855 32,711,639 35,139,642
Financial Condition Data
Total assets $ 703,791 $ 700,711 $ 708,270 $ 702,152 $ 721,259 $ 703,791 $ 721,259
Loans 513,705 508,758 513,755 489,273 491,337 513,705 491,337
Allowance for loan losses (8,007 ) (7,560 ) (7,251 ) (7,865 ) (7,947 ) (8,007 ) (7,947 )
Investment securities 120,398 120,648 124,784 123,500 121,281 120,398 121,281
Deposits 530,190 557,745 535,367 542,938 536,931 530,190 536,931
Borrowings 73,847 38,468 69,174 57,220 86,710 73,847 86,710
Stockholders' equity 93,404 94,082 94,035 92,507 91,035 93,404 91,035
Financial Ratios and Other Data
Performance Ratios:
Net interest margin (4) 2.86 % 2.95 % 2.89 % 2.94 % 2.89 % 2.91 % 3.05 %
Net interest spread (5) 2.55 % 2.62 % 2.58 % 2.64 % 2.62 % 2.60 % 2.80 %
Noninterest income to average assets (6) 1.28 % 2.19 % 1.52 % 0.76 % 0.84 % 1.43 % 1.37 %
Noninterest expense to average assets 3.88 % 4.14 % 3.72 % 3.14 % 3.54 % 3.72 % 3.75 %
Efficiency ratio (7) 97.57 % 83.44 % 87.45 % 89.24 % 99.18 % 89.07 % 88.44 %
Earnings on average assets (8) -0.21 % 0.59 % 0.43 % 0.36 % 0.53 % 0.29 % 0.48 %
Earnings on average equity (9) -1.56 % 4.35 % 3.28 % 2.76 % 4.23 % 2.18 % 3.52 %
Asset Quality Ratios:
Nonaccrual loans to loans (10) 1.09 % 1.14 % 1.12 % 1.29 % 1.34 % 1.09 % 1.34 %
Nonaccrual loans, restructured loans and
loans 90 days or more past due and still
accruing to total loans (10) 1.38 % 1.44 % 1.45 % 1.66 % 1.62 % 1.38 % 1.62 %
Nonperforming assets, restructured loans
and loans 90 days or more past due and still
accruing to total assets (10) 1.35 % 1.40 % 1.40 % 1.51 % 1.45 % 1.35 % 1.45 %
Allowance for loan losses to total loans (10) 1.56 % 1.49 % 1.41 % 1.61 % 1.62 % 1.56 % 1.62 %
Allowance for loan losses to nonaccrual loans,
restructured loans and loans 90 days or
more past due and still accruing (10) 112.66 % 103.07 % 97.34 % 96.96 % 99.72 % 112.66 % 99.72 %
Net charge-offs (recoveries) annualized
to average loans (10) 0.21 % 0.01 % 0.44 % (0.06 %) (0.74 %) 0.15 % -0.29 %
Capital Ratios:
Total equity to total assets 13.27 % 13.43 % 13.28 % 13.17 % 12.62 % 13.27 % 12.62 %
Total risk-based capital ratio 15.19 % 15.18 % 15.32 % 15.56 % 15.34 % 15.19 % 15.34 %
Tier 1 risk-based capital ratio 13.94 % 13.93 % 14.07 % 14.31 % 14.09 % 13.94 % 14.09 %
Leverage capital ratio 10.71 % 10.86 % 10.64 % 10.39 % 10.10 % 10.71 % 10.10 %
Other Data:
Number of employees (full-time equivalent) 176 182 180 177 183 176 183
Number of banking facilities 11 11 11 11 11 11 11
(1) Noninterest income includes gains and losses on securities.
(2) Net income available to common stockholders in the calculation of earnings per share includes the difference between the carrying amount less the consideration paid for redeemed preferred stock of $0.3 million for the third quarter of 2019 and twelve months ended December 31, 2019, and $1.8 million for the twelve months ended December 31, 2018.
(3) Tangible book value per share is the stockholder equity less the carry value of the preferred stock and less the goodwill and intangible assets, divided by the total shares of common outstanding. Book value per share is the stockholder equity less the liquidation preference of the preferred stock, divided by the total shares of common outstanding. Book value measures are reported inclusive of the net deferred tax assets. As presented here, shares of common outstanding excludes unvested Restricted Stock Awards.
(4) Net interest margin is the ratio of net interest income to average interest-earning assets.
(5) Net interest spread is the yield on average interest-earning assets less the rate on average interest-bearing liabilities.
(6) Noninterest income to average assets excludes gains and losses on securities.
(7) The efficiency ratio is noninterest expense divided by the sum of net interest income plus noninterest income, excluding gains and losses on securities.
(8) Earnings on average assets are net income divided by average total assets.
(9) Earnings on average equity are net income divided by average stockholders' equity.
(10) Excludes loans held for sale.
CIB MARINE BANCSHARES, INC.
Consolidated Balance Sheets (unaudited)
December 31, September 30, June 30, March 31, December 31,
2019 2019 2019 2019 2018
(Dollars in Thousands, Except Shares)
Assets
Cash and due from banks $ 8,970 $ 9,582 $ 8,791 $ 8,168 $ 13,037
Reverse repurchase agreements 11,196 4,083 18,347 42,729 58,662
Securities available for sale 117,972 118,211 122,365 121,115 118,926
Equity securities at fair value 2,426 2,437 2,419 2,385 2,355
Loans held for sale 16,928 25,347 8,450 4,467 4,632
Loans 513,705 508,758 513,755 489,273 491,337
Allowance for loan losses (8,007 ) (7,560 ) (7,251 ) (7,865 ) (7,947 )
Net loans 505,698 501,198 506,504 481,408 483,390
Federal Home Loan Bank Stock 2,587 926 2,363 2,003 3,172
Premises and equipment, net 4,274 4,504 4,643 4,538 4,498
Accrued interest receivable 1,486 1,646 1,820 1,873 1,570
Deferred tax assets, net 20,069 20,455 20,703 21,156 21,422
Other real estate owned, net 2,396 2,466 2,466 2,466 2,486
Bank owned life insurance 4,691 4,666 4,640 4,613 4,590
Goodwill and other intangible assets 154 159 165 171 176
Other assets (1) 4,944 5,031 4,594 5,060 2,343
Total Assets $ 703,791 $ 700,711 $ 708,270 $ 702,152 $ 721,259
Liabilities and Stockholders' Equity
Deposits:
Noninterest-bearing demand $ 70,175 $ 63,694 $ 62,424 $ 62,553 $ 63,507
Interest-bearing demand 45,512 50,683 32,649 32,467 33,660
Savings 204,976 202,866 192,133 188,110 181,432
Time 209,527 240,502 248,161 259,808 258,332
Total deposits 530,190 557,745 535,367 542,938 536,931
Short-term borrowings 73,847 38,468 69,174 57,220 86,710
Accrued interest payable 603 711 725 727 710
Other liabilities (1) 5,747 9,705 8,969 8,760 5,873
Total liabilities 610,387 606,629 614,235 609,645 630,224
Stockholders' Equity
Preferred stock, $1 par value; 5,000,000 authorized shares at December 31, 2019; 7% fixed rate noncumulative perpetual issued; 40,888 shares of series A and 3,217 shares of series B; convertible; $44.1 million aggregate liquidation preference 37,490 37,489 39,384 39,384 39,384
Common stock, $1 par value; 75,000,000 authorized shares; 18,868,329 and 18,455,610 issued shares; 18,657,282 and 18,244,563 outstanding shares at December 31, 2019 and 2018, respectively. (2) 18,868 18,868 18,543 18,456 18,456
Capital surplus 161,175 161,110 160,991 160,930 160,815
Accumulated deficit (123,753 ) (123,377 ) (124,412 ) (125,173 ) (125,796 )
Accumulated other comprehensive income (loss), net 158 526 63 (556 ) (1,290 )
Treasury stock 221,902 shares at cost (534 ) (534 ) (534 ) (534 ) (534 )
Total stockholders' equity 93,404 94,082 94,035 92,507 91,035
Total liabilities and stockholders' equity $ 703,791 $ 700,711 $ 708,270 $ 702,152 $ 721,259
(1) The adoption of the new lease accounting standards effective January 1, 2019, resulted in $2.8 million of operating lease right-of-use assets being recorded in other assets, net and a corresponding liability in other liabilities.
(2) Both issued and outstanding shares as stated here exclude 815,395 shares and 1,005,915 shares of unvested restricted stock awards at December 31,2019 and 2018, respectively.
CIB MARINE BANCSHARES, INC.
Consolidated Statements of Operations (Unaudited)
At or for the
Quarters Ended 12 Months Ended
December 31, September 30, June 30, March 31, December 31, December 31, December 31,
2019 2019 2019 2019 2018 2019 2018
(Dollars in thousands)
Interest Income
Loans $ 5,793 $ 5,992 $ 5,811 $ 5,693 $ 5,686 $ 23,289 $ 21,821
Loans held for sale 195 152 97 85 86 529 388
Securities 764 810 868 804 828 3,246 3,043
Other investments 68 81 302 433 409 884 951
Total interest income 6,820 7,035 7,078 7,015 7,009 27,948 26,203
Interest Expense
Deposits 1,856 2,027 1,949 1,805 1,547 7,637 4,876
Short-term borrowings 174 156 307 373 517 1,010 1,546
Total interest expense 2,030 2,183 2,256 2,178 2,064 8,647 6,422
Net interest income 4,790 4,852 4,822 4,837 4,945 19,301 19,781
Provision for (reversal of) loan losses 715 327 (67 ) (158 ) (1,195 ) 817 (1,185 )
Net interest income after provision for
(reversal of) loan losses 4,075 4,525 4,889 4,995 6,140 18,484 20,966
Noninterest Income
Deposit service charges 98 101 95 83 79 377 405
Other service fees 23 30 29 20 31 102 135
Mortgage banking revenue, net 2,112 2,936 2,148 978 1,057 8,174 6,346
Other income 129 150 179 165 143 623 601
Net gains on sale of securities available for sale 0 0 0 0 0 0 15
Unrealized gains (losses) recognized on equity securities (11 ) 18 34 30 23 71 (52 )
Net gains (losses) on sale of assets and (writedowns) (102 ) 600 225 86 213 809 1,959
Total noninterest income 2,249 3,835 2,710 1,362 1,546 10,156 9,409
Noninterest Expense
Compensation and employee benefits 4,701 5,309 4,445 3,687 4,206 18,142 17,458
Equipment 394 335 353 335 364 1,417 1,363
Occupancy and premises 460 420 437 456 423 1,773 1,640
Data Processing 157 165 160 166 169 648 669
Federal deposit insurance (10 ) (5 ) 66 82 74 133 222
Professional services 320 198 207 140 270 865 1,349
Telephone and data communication 81 86 83 78 86 328 321
Insurance 59 70 52 53 47 234 231
Other expense 717 655 754 508 776 2,634 2,594
Total noninterest expense 6,879 7,233 6,557 5,505 6,415 26,174 25,847
Income (losses) from operations
before income taxes (555 ) 1,127 1,042 852 1,271 2,466 4,528
Income tax expense (benefit) (180 ) 93 281 229 313 423 1,188
Net income (loss) (375 ) 1,034 761 623 958 2,043 3,340
Preferred stock dividend 0 0 0 0 0 0 0
Discount from repurchase of preferred stock 0 308 0 0 0 308 1,808
Net income (loss) allocated to
common stockholders $ (375 ) $ 1,342 $ 761 $ 623 $ 958 $ 2,351 $ 5,148
Source: CIBM Bank
© 2020 GlobeNewswire, Inc.
Snagged another 1k today. Need to start accumulating this stock again. Looking forward to positive things in 2020. I hope to resume buying this up. Still way undervalued.......
Definitely. I had held this level way too long. Numbers should be fine. I would like to think we will continue to march up from here. I think more progress will be made buying the preferred shares up. If we could purchase all the preferred shares, that would be a game changer for sure!!!!!
It says in the press release that these directors were added to address directors that are planning on retiring in 12-24 months. These new directors also will help address the lack of diversity of the board. This is ONLY my opinion. If you think that the adding of the directors will alter the direction of the preferred shares/potential sale of the bank, I see no reason to get your hopes up. Just my opinion.
No idea. However, new directors might have reach into $$ that could buy the preferred out of the way.
Buy-out of bank after the newbies get some shares.
Just some speculative thoughts on my part.
Any chance any of the outstanding preferred shares were involved with these additions?
Stacking the board with, imo, experienced folks that could act as a "salesperson" for the company. hhmmmmm......
News out
CIB Marine Bancshares, Inc. Announces Additions to Board of Directors
BROOKFIELD, Wis., Nov. 19, 2019 (GLOBE NEWSWIRE) -- Bank holding company CIB Marine Bancshares, Inc. (OTCQB: CIBH) announced today that Mses. Gina Cocking and JoAnn Cotter have been appointed to its Board of Directors, effective November 21, 2019.
Ms. Cocking is based in the Company’s Chicagoland market and currently serves as Managing Director and Chief Executive Officer of Colonnade Advisors, LLC, an independent investment bank focused on the financial services and business services sectors. Ms. Cocking will stand for election at the annual meeting of shareholders to be held in 2020.
Ms. Cotter is based in the Company’s Wisconsin market and is a retired partner of Wipfli LLP where she served as the leader of the firm’s Financial Institutions Practice.
“We are pleased to welcome these talented women to the Board of CIB Marine Bancshares, Inc.,” said Mr. Mark Elste, Chairman of the Board of Directors.
“Gina Cocking has over 25 years of experience across a variety of areas including private equity, investment banking, financial services and business services. Her wealth of knowledge related to business planning, competitive analysis, operating strategies and product development, will be beneficial to the Board and management as the Company continues to improve upon its growth and efficiency objectives,” said Mr. Elste.
He added, “With more than 20 years of experience as a partner with Wipfli, including 15 years as the Leader of the firm’s Financial Institutions Practice, JoAnn Cotter is uniquely capable of understanding the intricacies of our Company’s operations, and provides depth to our Board of Directors for years to come. We are truly fortunate that such high-caliber leaders have agreed to join our team.”
With the addition of Mses. Cocking and Cotter, the Board of CIB Marine Bancshares, Inc. has been expanded to twelve directors, which is part of the Company’s succession plan to address anticipated retirements from the Board in the next twelve to twenty-four months.
CIB Marine Bancshares, Inc. is the holding company for CIBM Bank, which operates eleven banking offices and five mortgage loan offices in Illinois, Wisconsin and Indiana. More information on the company is available at www.cibmarine.com, including recent shareholder letters, links to regulatory financial reports, and audited financial statements.
FORWARD-LOOKING STATEMENTS
CIB Marine has made statements in this release that may constitute “forward-looking statements” within the meaning of the Private Securities Litigation Reform Act of 1995. CIB Marine intends these forward-looking statements to be subject to the safe harbor created thereby and is including this statement to avail itself of the safe harbor. Forward-looking statements are identified generally by statements containing words and phrases such as “may,” “project,” “are confident,” “should be,” “intend,” “predict,” “believe,” “plan,” “expect,” “estimate,” “anticipate” and similar expressions. These forward-looking statements reflect CIB Marine’s current views with respect to future events and financial performance that are subject to many uncertainties and factors relating to CIB Marine’s operations and the business environment, which could change at any time.
There are inherent difficulties in predicting factors that may affect the accuracy of forward-looking statements.
Stockholders should note that many factors, some of which are discussed elsewhere in this document and any documents that are incorporated by reference, could affect the future financial results of CIB Marine and could cause those results to differ materially from those expressed in forward-looking statements contained or incorporated by reference in this document. These factors, many of which are beyond CIB Marine’s control, include but are not limited to:
operating, legal, execution, credit, market, security (including cyber), and regulatory risks;
economic, political, and competitive forces affecting CIB Marine’s banking business;
the impact on net interest income and securities values from changes in monetary policy and general economic and political conditions; and
the risk that CIB Marine’s analyses of these risks and forces could be incorrect and/or that the strategies developed to address them could be unsuccessful.
These factors should be considered in evaluating the forward-looking statements, and undue reliance should not be placed on such statements. Forward-looking statements speak only as of the date they are made. CIB Marine undertakes no obligation to update or revise any forward-looking statements, whether as a result of new information, future events, or otherwise. Forward-looking statements are subject to significant risks and uncertainties and CIB Marine’s actual results may differ materially from the results discussed in forward-looking statements.
FOR INFORMATION CONTACT:J. Brian Chaffin, President & CEO
(217) 355-0900
brian.chaffin@cibmbank.com
Source: CIBM Bank
© 2019 GlobeNewswire, Inc.
I snagged a couple hundred more today. To absorb 10,000 or more shares and still remain at $1.32 is a great sign that someone is accumulating for sure. Wait till the market makers let it run again......
I snagged 600; 200 @ 1.29, 200 @ 1.35, 200 @ 1.40. Remember when we were all overpaying for shares at .21 or so? People thought we were crazy......so I’m buying for the next couple of years again....at any reasonable price.
Income is "disappointing" in that it didn't go up, but is still solid. Book value continues to go up and they are making progress on the preferreds.
Stock price should be higher than where it is. If I can free up some cash in the next month or two, I'm going to be a buyer. I hate averaging up, but the future of CIBH just appears to be clearing up and the pps will have to go up as a result.
Good luck all!
News out book value goes up and more preferred stock repurchased
CIB Marine Bancshares, Inc. Announces Third Quarter 2019 Results
BROOKFIELD, Wis., Oct. 11, 2019 (GLOBE NEWSWIRE) -- CIB Marine Bancshares, Inc. (the “Company” or “CIBM”) (OTCQB: CIBH), the holding company of CIBM Bank, announced its unaudited results of operations and financial condition for the third quarter of 2019. Income before taxes for the quarter was $1.1 million compared to $1.2 million for the same period in 2018, and for the nine months ending September 30, 2019, it was $3.0 million compared to $3.3 million for the same period in 2018.
A summary of financial results for the quarter and nine months ended September 30, 2019, is attached. Select highlights include:
Tangible book value per share and stated book value per share at September 30, 2019, were $3.03 and $2.68 per share of common stock, respectively, compared to $2.82 and $2.45, respectively, at December 31, 2018. The increase reflects reported income for the nine months ended September 30, 2019, improved net accumulated other comprehensive income (loss) due to improved available for sale security fair values as a result of lower market interest rates, and discounts to the repurchase of preferred stock in the third quarter.
Income before taxes for subsidiary CIBM Bank was $1.2 million for the quarter compared to $1.7 million for the same period in 2018, and $3.3 million for the nine months ended September 30, 2019, compared to $4.2 million for the same period in 2018. Comparing the two nine-month periods, there was a decline in net interest income of $0.4 million due primarily to rising cost of funds and a reduction in SBA reverse repo balances, a decline in non-interest income of $0.2 million due to lower SBA gains on sale as a result of lower origination volumes in part offset by stronger mortgage banking revenues, an increase in provision to allowance for loan losses of $0.1 million and an increase in non-interest expenses by $0.3 million lead by higher compensation, collection and occupancy and premise expenses.
Non-performing assets, restructured loans, and loans 90 days or more past due and still accruing to total assets was 1.40% at September 30, 2019, versus 1.45% at December 31, 2018, and 1.11% at September 30, 2018. The increase from one year ago is primarily the result of one loan placed on non-accrual during the fourth quarter of 2018. CIB Marine’s allowance for loan losses was 1.49% at September 30, 2019, versus 1.62% at December 31, 2018, and 1.62% at September 30, 2018. The decline was primarily due to a $0.5 million charge-off of a loan that was previously reserved for.
Mr. J. Brian Chaffin, President and CEO of CIBM, commented, “Our SBA and Mortgage Divisions’ net revenues were up $0.4 million and $0.8 million, respectively, from second quarter of 2019 due to stronger loan production from both. Notably, the Mortgage Division has had stronger production and higher earnings on that production during 2019 versus the year prior. This can be attributed to solid purchase money and elevated refinance activity on lower mortgage rates so far this year and a number of new lender hires.”
He added, “Our net interest margin improved by 6 basis points from the prior quarter and printed the best result since the third quarter of 2018. We are encouraged that the cost of funds has begun to turn lower and we expect the decline to pick up in the two quarters ahead as we expect a significant amount of maturing time deposits originated near the peak of the rate cycle last year and early this year to reprice at lower rates.
“Finally, during the third quarter, we approved and accepted the repurchase of 2,229 shares of preferred stock as part of the second of three planned preferred stock modified Dutch auctions held pursuant to our 2018 amendments to the Articles of Incorporation. The total price for the shares was $1.6 million, resulting in a discount of $0.3 million to the $1.9 million carrying value of the preferred stock shares. The discount was transferred to paid-in capital for common stock during the third quarter. As a reminder, a $3.5 million liability currently exists for the purchase of 4,923 preferred shares, which CIBM anticipates settling on or before December 1, 2019, as agreed to in 2018.”
CIB Marine Bancshares, Inc. is the holding company for CIBM Bank, which operates eleven banking offices and five mortgage loan offices in Illinois, Wisconsin and Indiana. More information on the Company is available at www.cibmarine.com, including recent shareholder letters, links to regulatory financial reports, and audited financial statements.
FORWARD-LOOKING STATEMENTS
CIB Marine has made statements in this release that may constitute “forward-looking statements” within the meaning of the Private Securities Litigation Reform Act of 1995. CIB Marine intends these forward-looking statements to be subject to the safe harbor created thereby and is including this statement to avail itself of the safe harbor. Forward-looking statements are identified generally by statements containing words and phrases such as “may,” “project,” “are confident,” “should be,” “intend,” “predict,” “believe,” “plan,” “expect,” “estimate,” “anticipate” and similar expressions. These forward-looking statements reflect CIB Marine’s current views with respect to future events and financial performance that are subject to many uncertainties and factors relating to CIB Marine’s operations and the business environment, which could change at any time.
There are inherent difficulties in predicting factors that may affect the accuracy of forward-looking statements.
Stockholders should note that many factors, some of which are discussed elsewhere in this Earnings Release and in the documents that are incorporated by reference, could affect the future financial results of CIB Marine and could cause those results to differ materially from those expressed in forward-looking statements contained or incorporated by reference in this document. These factors, many of which are beyond CIB Marine’s control, include but are not limited to:
operating, legal, execution, credit, market, security (including cyber), and regulatory risks;
economic, political, and competitive forces affecting CIB Marine’s banking business;
the impact on net interest income and securities values from changes in monetary policy and general economic and political conditions; and
the risk that CIB Marine’s analyses of these risks and forces could be incorrect and/or that the strategies developed to address them could be unsuccessful.
These factors should be considered in evaluating the forward-looking statements, and undue reliance should not be placed on such statements. Forward-looking statements speak only as of the date they are made. CIB Marine undertakes no obligation to update or revise any forward-looking statements, whether as a result of new information, future events, or otherwise. Forward-looking statements are subject to significant risks and uncertainties and CIB Marine’s actual results may differ materially from the results discussed in forward-looking statements.
FOR INFORMATION CONTACT:
J. Brian Chaffin, President & CEO
(217) 355-0900
brian.chaffin@cibmbank.com
CIB MARINE BANCSHARES, INC.
Selected Unaudited Consolidated Financial Data
At or for the
Quarters Ended 9 Months Ended
September 30, June 30, March 31, December 31, September 30, September 30, September 30,
2019 2019 2019 2018 2018 2019 2018
(Dollars in thousands, except share and per share data)
Selected Statement of Operations Data
Interest and dividend income $ 7,035 $ 7,078 $ 7,015 $ 7,009 $ 6,798 $ 21,128 $ 19,194
Interest expense 2,183 2,256 2,178 2,064 1,767 6,617 4,358
Net interest income 4,852 4,822 4,837 4,945 5,031 14,511 14,836
Provision for (reversal of) loan losses 327 (67 ) (158 ) (1,195 ) (13 ) 102 10
Net interest income after provision for
(reversal of) loan losses 4,525 4,889 4,995 6,140 5,044 14,409 14,826
Noninterest income (1) 3,835 2,710 1,362 1,546 3,063 7,907 7,863
Noninterest expense 7,233 6,557 5,505 6,415 6,871 19,295 19,432
Income before income taxes 1,127 1,042 852 1,271 1,236 3,021 3,257
Income tax expense 93 281 229 313 345 603 875
Net income $ 1,034 $ 761 $ 623 $ 958 $ 891 $ 2,418 $ 2,382
Common Share Data
Basic net income per share (2) $ 0.07 $ 0.04 $ 0.03 $ 0.05 $ 0.14 $ 0.15 $ 0.23
Diluted net income per share (2) 0.04 0.02 0.02 0.03 0.07 0.08 0.12
Dividend 0.00 0.00 0.00 0.00 0.00 0.00 0.00
Tangible book value per share (3) 3.03 2.97 2.90 2.82 2.71 3.03 2.71
Book value per share (3) 2.68 2.60 2.53 2.45 2.34 2.68 2.34
Weighted average shares outstanding - basic 18,455,408 18,290,674 18,232,169 18,232,169 18,232,169 18,281,049 18,201,320
Weighted average shares outstanding - diluted 32,536,354 33,009,983 32,815,744 32,757,855 34,589,375 32,835,500 35,958,705
Financial Condition Data
Total assets $ 700,711 $ 708,270 $ 702,152 $ 721,259 $ 723,733 $ 700,711 $ 723,733
Loans 508,758 513,755 489,273 491,337 507,677 508,758 507,677
Allowance for loan losses (7,560 ) (7,251 ) (7,865 ) (7,947 ) (8,217 ) (7,560 ) (8,217 )
Investment securities 120,648 124,784 123,500 121,281 118,345 120,648 118,345
Deposits 557,745 535,367 542,938 536,931 523,729 557,745 523,729
Borrowings 38,468 69,174 57,220 86,710 104,357 38,468 104,357
Stockholders' equity 94,082 94,035 92,507 91,035 88,993 94,082 88,993
Financial Ratios and Other Data
Performance Ratios:
Net interest margin (4) 2.95 % 2.89 % 2.94 % 2.89 % 2.97 % 2.93 % 3.10 %
Net interest spread (5) 2.62 % 2.58 % 2.64 % 2.62 % 2.72 % 2.61 % 2.87 %
Noninterest income to average assets (6) 2.19 % 1.52 % 0.76 % 0.84 % 1.72 % 1.49 % 1.56 %
Noninterest expense to average assets 4.14 % 3.72 % 3.14 % 3.54 % 3.82 % 3.67 % 3.82 %
Efficiency ratio (7) 83.44 % 87.45 % 89.24 % 99.18 % 84.63 % 86.39 % 85.38 %
Earnings on average assets (8) 0.59 % 0.43 % 0.36 % 0.53 % 0.50 % 0.46 % 0.47 %
Earnings on average equity (9) 4.35 % 3.28 % 2.76 % 4.23 % 3.77 % 3.48 % 3.30 %
Asset Quality Ratios:
Nonaccrual loans to loans (10) 1.14 % 1.12 % 1.29 % 1.34 % 0.73 % 1.14 % 0.73 %
Nonaccrual loans, restructured loans and
loans 90 days or more past due and still
accruing to total loans (10) 1.44 % 1.45 % 1.66 % 1.62 % 1.09 % 1.44 % 1.09 %
Nonperforming assets, restructured loans
and loans 90 days or more past due and still
accruing to total assets (10) 1.40 % 1.40 % 1.51 % 1.45 % 1.11 % 1.40 % 1.11 %
Allowance for loan losses to total loans (10) 1.49 % 1.41 % 1.61 % 1.62 % 1.62 % 1.49 % 1.62 %
Allowance for loan losses to nonaccrual loans,
restructured loans and loans 90 days or
more past due and still accruing (10) 103.07 % 97.34 % 96.96 % 99.72 % 148.99 % 103.07 % 148.99 %
Net charge-offs (recoveries) annualized
to average loans (10) 0.01 % 0.44 % (0.06 %) (0.74 %) (0.14 %) 0.13 % -0.14 %
Capital Ratios:
Total equity to total assets 13.43 % 13.28 % 13.17 % 12.62 % 12.30 % 13.43 % 12.30 %
Total risk-based capital ratio 15.20 % 15.32 % 15.56 % 15.34 % 14.43 % 15.20 % 14.43 %
Tier 1 risk-based capital ratio 13.95 % 14.07 % 14.31 % 14.09 % 13.18 % 13.95 % 13.18 %
Leverage capital ratio 10.86 % 10.64 % 10.39 % 10.10 % 9.90 % 10.86 % 9.90 %
Other Data:
Number of employees (full-time equivalent) 182 180 177 183 188 182 188
Number of banking facilities 11 11 11 11 11 11 11
(1) Noninterest income includes gains and losses on securities.
(2) Net income available to common stockholders in the calculation of earnings per share includes the difference between the carrying amount less the consideration paid for redeemed preferred stock of $0.3 million for the third quarter and nine months ended September 30, 2019, $0.1 million for the second quarter of 2018, $1.7 million for the third quarter of 2018, and $1.8 million for the nine months ended September 30, 2018.
(3) Tangible book value per share is the stockholder equity less the carry value of the preferred stock and less the goodwill and intangible assets, divided by the total shares of common outstanding. Book value per share is the stockholder equity less the liquidation preference of the preferred stock, divided by the total shares of common outstanding. As presented here, shares of common outstanding excludes unvested Restricted Stock Awards totalling 918,665 shares of common stock at September 30, 2019.
(4) Net interest margin is the ratio of net interest income to average interest-earning assets.
(5) Net interest spread is the yield on average interest-earning assets less the rate on average interest-bearing liabilities.
(6) Noninterest income to average assets excludes gains and losses on securities.
(7) The efficiency ratio is noninterest expense divided by the sum of net interest income plus noninterest income, excluding gains and losses on securities.
(8) Earnings on average assets are net income divided by average total assets.
(9) Earnings on average equity are net income divided by average stockholders' equity.
(10) Excludes loans held for sale.
CIB MARINE BANCSHARES, INC.
Consolidated Balance Sheets (unaudited)
September 30, June 30, March 31, December 31, September 30,
2019 2019 2019 2018 2018
(Dollars in Thousands, Except Shares)
Assets
Cash and due from banks $ 9,582 $ 8,791 $ 8,168 $ 13,037 $ 10,055
Reverse repurchase agreements 4,083 18,347 42,729 58,662 45,076
Securities available for sale 118,211 122,365 121,115 118,926 116,013
Equity securities at fair value 2,437 2,419 2,385 2,355 2,332
Loans held for sale 25,347 8,450 4,467 4,632 8,145
Loans 508,758 513,755 489,273 491,337 507,677
Allowance for loan losses (7,560 ) (7,251 ) (7,865 ) (7,947 ) (8,217 )
Net loans 501,198 506,504 481,408 483,390 499,460
Federal Home Loan Bank Stock 926 2,363 2,003 3,172 3,870
Premises and equipment, net (1) 7,083 7,386 7,220 4,498 4,409
Accrued interest receivable 1,646 1,820 1,873 1,570 1,858
Deferred tax assets, net 20,455 20,703 21,156 21,422 22,410
Other real estate owned, net 2,466 2,466 2,466 2,486 2,494
Bank owned life insurance 4,666 4,640 4,613 4,590 4,565
Goodwill and other intangible assets 159 165 171 176 181
Other assets 2,452 1,851 2,378 2,343 2,865
Total Assets $ 700,711 $ 708,270 $ 702,152 $ 721,259 $ 723,733
Liabilities and Stockholders' Equity
Deposits:
Noninterest-bearing demand $ 63,694 $ 62,424 $ 62,553 $ 63,507 $ 69,165
Interest-bearing demand 50,683 32,649 32,467 33,660 33,701
Savings 202,866 192,133 188,110 181,432 164,603
Time 240,502 248,161 259,808 258,332 256,260
Total deposits 557,745 535,367 542,938 536,931 523,729
Short-term borrowings 38,468 69,174 57,220 86,710 104,357
Accrued interest payable 711 725 727 710 694
Other liabilities 9,705 8,969 8,760 5,873 5,960
Total liabilities 606,629 614,235 609,645 630,224 634,740
Stockholders' Equity
Preferred stock, $1 par value; 5,000,000
authorized shares at September 30, 2019; 7% fixed rate noncumulative perpetual issued;
40,888 shares of series A and 3,217 shares of series B; convertible; $44.1 million aggregate liquidation preference 37,489 39,384 39,384 39,384 39,384
Common stock, $1 par value; 75,000,000
authorized shares; 18,868,329 issued shares; 18,646,427 outstanding shares (2) 18,868 18,543 18,456 18,456 18,454
Capital surplus 161,110 160,991 160,930 160,815 160,716
Accumulated deficit (123,377 ) (124,412 ) (125,173 ) (125,796 ) (126,754 )
Accumulated other comprehensive income (loss), net 526 63 (556 ) (1,290 ) (2,273 )
Treasury stock 221,902 shares at cost (534 ) (534 ) (534 ) (534 ) (534 )
Total stockholders' equity 94,082 94,035 92,507 91,035 88,993
Total liabilities and stockholders' equity $ 700,711 $ 708,270 $ 702,152 $ 721,259 $ 723,733
(1) The adoption of the new lease accounting standards effective January 1, 2019 resulted in $2.8 million of right of use assets being recorded in premise and equipment, net and a corresponding liability in other liabilities.
(2) Both issued and outstanding shares as stated here exclude 918,665 shares of unvested restricted stock awards.
CIB MARINE BANCSHARES, INC.
Consolidated Statements of Operations (Unaudited)
At or for the
Quarters Ended 9 Months Ended
September 30, June 30, March 31, December 31, September 30, September 30, September 30,
2019 2019 2019 2018 2018 2019 2018
(Dollars in thousands)
Interest Income
Loans $ 5,992 $ 5,811 $ 5,693 $ 5,686 $ 5,638 $ 17,496 $ 16,135
Loans held for sale 152 97 85 86 112 334 302
Securities 810 868 804 828 720 2,482 2,215
Other investments 81 302 433 409 328 816 542
Total interest income 7,035 7,078 7,015 7,009 6,798 21,128 19,194
Interest Expense
Deposits 2,027 1,949 1,805 1,547 1,343 5,781 3,329
Short-term borrowings 156 307 373 517 424 836 1,029
Total interest expense 2,183 2,256 2,178 2,064 1,767 6,617 4,358
Net interest income 4,852 4,822 4,837 4,945 5,031 14,511 14,836
Provision for (reversal of) loan losses 327 (67 ) (158 ) (1,195 ) (13 ) 102 10
Net interest income after provision for
(reversal of) loan losses 4,525 4,889 4,995 6,140 5,044 14,409 14,826
Noninterest Income
Deposit service charges 101 95 83 79 105 279 326
Other service fees 30 29 20 31 30 79 104
Mortgage Banking revenue, net 2,936 2,148 978 1,057 1,760 6,062 5,289
Other income 150 179 165 143 173 494 458
Net gains (losses) on sale of securities available for sale 0 0 0 0 (7 ) 0 15
Unrealized gains (losses) recognized on equity securities 18 34 30 23 (18 ) 82 (75 )
Net gains on sale of assets 600 225 86 213 1,020 911 1,746
Total noninterest income 3,835 2,710 1,362 1,546 3,063 7,907 7,863
Noninterest Expense
Compensation and employee benefits 5,309 4,445 3,687 4,206 4,514 13,441 13,252
Equipment 335 353 335 364 351 1,023 999
Occupancy and premises 420 437 456 423 378 1,313 1,217
Data Processing 165 160 166 169 184 491 500
Federal deposit insurance (5 ) 66 82 74 51 143 148
Professional services 198 207 140 270 623 545 1,079
Telephone and data communication 86 83 78 86 78 247 235
Insurance 70 52 53 47 60 175 184
Other expense 655 754 508 776 632 1,917 1,818
Total noninterest expense 7,233 6,557 5,505 6,415 6,871 19,295 19,432
Income from operations
before income taxes 1,127 1,042 852 1,271 1,236 3,021 3,257
Income tax expense 93 281 229 313 345 603 875
Net income 1,034 761 623 958 891 2,418 2,382
Preferred stock dividend 0 0 0 0 0 0 0
Discount from repurchase of preferred shares 308 0 0 0 1,703 308 1,808
Net income allocated to
common stockholders $ 1,342 $ 761 $ 623 $ 958 $ 2,594 $ 2,726 $ 4,190
Source: CIBM Bank
© 2019 GlobeNewswire, Inc.
Well, I'm thinking about taking a few more shares off of the market this week. I just don't see the pps getting too much lower and I think the worse that will happen is that shares bought below 1.30 will rise to a bit over 1.50 and get stuck there for a while. Although that could be a little bit frustrating; getting stuck on the plus side of a slow moving pps isn't exactly a stock disaster epitomized.
I think it will show progress on the repurchase front. The more shares we buy back, the less exposure the commons have. I really don’t know how much we will rise until we start getting some people interested in picking up more shares. I know that the high volume days are gone now. I really think it was done to get the price down for some reason. I hope it stays down so I can continue to add some at this price.
We've slammed the lid on another quarter y'all. I wonder if the 3rd quarter numbers will get the CIBH pps moving north again?
I bought back 500 more shares. I had to sell some at $1.40 a while back.....I’m telling ya, it’s just shenanigans with someone trying to manipulate the price to their advantage.
No, the market makers cleared out the stops and weak hands. My theory is that they were not getting ANY action at this price. So they saw all the stop losses, sell orders and protective trailing stood getting hit. This triggered more sales without any major drop. They won’t be as generous to sell on the way back up. I really think we will be back up to new highs by the beginning of 2020. Just my opinion.
I would expect serious price movement on this kind of volume. And really would expect the price movement to be up. What the heck?
This should clear out the weak hands. Market makers do NOT care what the price is. I think they have some big buys lined up, and are just getting all the shares that will sell at this level
This should clear out the weak hands. Market makers do NOT care what the price is. I think they have some big buys lined up, and are just getting all the shares that will sell at this level
Now THAT’S funny!!!!!!
Hopefully the preferreds panic and sell to CIBH.
I agree. I will also....
Still annoying to see a new 52 week low when the book value is well over 2.00. I will add if they dip it further tomorrow.
These shares are being absorbed nicely. This is PURE manipulation in my opinion. It is someone driving the price down to shake the trees and panic everyone into selling.....just my opinion.
I still think it’s MM’s loading up. Nobody here trades that many shares at once. Manipulation at its best.
Nothing has changed. Personally I think it’s a market makers scaring up some shares.
Good grief who is dumping the bid cant believe we are trading down here?
I saw that man I just wish were over 2.00 by now.
Someone snagged the big lot of shares.....
Decent buy. I'd take a few if I had the funds to do so.
Someone it trying to scare us out of our shares. Ask is 40k for $1.40.
They will get bought......we just have to extend the time period, and just pay a little higher price. The less preferred shares out there, the better. The common price per share will continue to reflect the current value, not the potential or future value. I am holding as many shares as my wallet will allow. I am also nibbling away as many as I can afford. I continue to believe in current management and the direction of CIBH. Someone is trying to hit the bid and run it down, but there seems to be a pretty good market out there for the shares. 5 years ago that volume was a months worth.
They are looking at over $19 million to get those preferred shares bought?
Financial situation is very good, just can't get that pps to move.
I'm thinking of making my first purchase in years. I hate to see my average cost go up so much, but CIBH just seems to be plugging away.
filing out 2Q 2019 Results & Shareholder Letter
https://backend.otcmarkets.com/otcapi/company/financial-report/226994/content
News out
CIB Marine Bancshares, Inc. Announces Second Quarter 2019 Results
Bancshares, Inc. (the “Company” or “CIBM”) (OTCQB: CIBH), the holding company of CIBM Bank, announced its unaudited results of operations and financial condition for the second quarter of 2019. Income before taxes for the quarter was $1.0 million compared to $1.1 million for the same period in 2018, and for the six months ending June 30, 2019, it was $1.9 million compared to $2.0 million for the same period in 2018.
A summary of financial results for the quarter and six months ended June 30, 2019, is attached. Select highlights include:
Tangible book value per share and stated book value per share at June 30, 2019, were $2.97 and $2.60 per share of common stock, respectively, compared to $2.82 and $2.45, respectively, at December 31, 2018. The increase reflects reported income for the six months ended June 30, 2019, and improved net accumulated other comprehensive income (loss) due to improved available for sale security values as a result of lower market interest rates.
Income before taxes for subsidiary CIBM Bank was $1.2 million for the quarter compared to $1.4 million for the same period in 2018, and $2.0 million for the six months ending June 30, 2019, compared to $2.5 million for the same period in 2018. Comparing the two six month periods, there was a decline in net interest income of $0.2 million due primarily to rising cost of funds, and a decline in non-interest income of $0.9 million due to lower net mortgage banking revenues and SBA gains on sale as a result of lower origination volumes. This was offset, in part, by lower non-interest expenses of $0.4 million and a $0.2 million improvement in provisions to loan losses.
Non-performing assets, restructured loans, and loans 90 days or more past due and still accruing to total assets was 1.40% at June 30, 2019, versus 1.45% at December 31, 2018, and 0.94% at June 30, 2018. The increase from one year ago is primarily the result of one loan placed on non-accrual during the fourth quarter of 2018. CIB Marine’s allowance for loan losses was 1.41% at June 30, 2019, versus 1.62% at December 31, 2018, and 1.65% at June 30, 2018. The decline was primarily due to a $0.5 million charge-off of a loan that was previously reserved for.
Mr. J. Brian Chaffin, President and CEO of CIBM, commented, “Our mortgage division increased mortgage loan closings by $47 million in the second quarter versus the first quarter of 2019 and net mortgage banking revenue increased by $1.2 million over the same period. The improvements are attributable to a number of factors including seasonality, the division’s success in purchase money lending activity, a number of new hires, and lower interest rates. At the same time, our loan portfolio grew by $24 million during the quarter with contributions from all major portfolio segments, including commercial, residential, and home equity lines of credit. Our SBA loan originations continue to be softer than the prior year with our gains on sale year to date totaling $0.3 million compared to $0.7 million for the same period last year, but there is a significant pipeline developed that we expect to support higher originations and gains on sale in the quarters ahead.”
He added, “Our rising trend in cost of funds has slowed due to a number of factors, including slower total balance sheet growth in the industry and market pricing for lower future short- and mid-term interest rates. However, it continues to have an adverse effect on our net interest income growth and our net interest margin, which reported at 2.89% for the second quarter of 2019, down from 2.94% in the first quarter.
“Lastly, we concluded the offering period of the second of three planned preferred stock modified Dutch auctions in June of 2019. Of the approximately 29,475 shares of preferred stock offered for sale, approximately 2,229 shares met the criteria for repurchase laid out by the Board of Directors of CIBM and are anticipated to be accepted by CIBM for a total price of $1.6 million, pending necessary regulatory approvals. It is contemplated a discount of $0.3 million to the carrying value of preferred stock shares will be transferred to paid-in capital upon acceptance by CIBM of these offered shares. CIBM plans to settle the transactions from cash and no additional capital has been or is contemplated to be issued to provide funding for the purchases. As a reminder, a $3.5 million liability currently exists for the purchase of 4,923 preferred shares, which will settle on or before December 1, 2019, as agreed to in 2018.”
CIB Marine Bancshares, Inc. is the holding company for CIBM Bank, which operates eleven banking offices and five mortgage loan offices in Illinois, Wisconsin and Indiana. More information on the Company is available at www.cibmarine.com, including recent shareholder letters, links to regulatory financial reports, and audited financial statements.
FORWARD-LOOKING STATEMENTS
CIB Marine has made statements in this release that may constitute “forward-looking statements” within the meaning of the Private Securities Litigation Reform Act of 1995. CIB Marine intends these forward-looking statements to be subject to the safe harbor created thereby and is including this statement to avail itself of the safe harbor. Forward-looking statements are identified generally by statements containing words and phrases such as “may,” “project,” “are confident,” “should be,” “intend,” “predict,” “believe,” “plan,” “expect,” “estimate,” “anticipate” and similar expressions. These forward-looking statements reflect CIB Marine’s current views with respect to future events and financial performance that are subject to many uncertainties and factors relating to CIB Marine’s operations and the business environment, which could change at any time.
There are inherent difficulties in predicting factors that may affect the accuracy of forward-looking statements.
Stockholders should note that many factors, some of which are discussed elsewhere in this Earnings Release and in the documents that are incorporated by reference, could affect the future financial results of CIB Marine and could cause those results to differ materially from those expressed in forward-looking statements contained or incorporated by reference in this document. These factors, many of which are beyond CIB Marine’s control, include but are not limited to:
operating, legal, execution, credit, market, security (including cyber), and regulatory risks;
economic, political, and competitive forces affecting CIB Marine’s banking business;
the impact on net interest income and securities values from changes in monetary policy and general economic and political conditions; and
the risk that CIB Marine’s analyses of these risks and forces could be incorrect and/or that the strategies developed to address them could be unsuccessful.
These factors should be considered in evaluating the forward-looking statements, and undue reliance should not be placed on such statements. Forward-looking statements speak only as of the date they are made. CIB Marine undertakes no obligation to update or revise any forward-looking statements, whether as a result of new information, future events, or otherwise. Forward-looking statements are subject to significant risks and uncertainties and CIB Marine’s actual results may differ materially from the results discussed in forward-looking statements.
FOR INFORMATION CONTACT:
J. Brian Chaffin, President & CEO
(217) 355-0900
brian.chaffin@cibmbank.com
CIB MARINE BANCSHARES, INC.
Selected Unaudited Consolidated Financial Data
At or for the
Quarters Ended 6 Months Ended
June 30, March 31, December 31, September 30, June 30, June 30, June 30,
2019 2019 2018 2018 2018 2019 2018
(Dollars in thousands, except share and per share data)
Selected Statement of Operations Data
Interest and dividend income $ 7,078 $ 7,015 $ 7,009 $ 6,798 $ 6,387 $ 14,093 $ 12,396
Interest expense 2,256 2,178 2,064 1,767 1,406 4,434 2,591
Net interest income 4,822 4,837 4,945 5,031 4,981 9,659 9,805
Provision for (reversal of) loan losses (67 ) (158 ) (1,195 ) (13 ) 149 (225 ) 23
Net interest income after provision for
(reversal of) loan losses 4,889 4,995 6,140 5,044 4,832 9,884 9,782
Noninterest income (1) 2,710 1,362 1,546 3,063 2,968 4,072 4,800
Noninterest expense 6,557 5,505 6,415 6,871 6,737 12,062 12,561
Income before income taxes 1,042 852 1,271 1,236 1,063 1,894 2,021
Income tax expense 281 229 313 345 241 510 530
Net income $ 761 $ 623 $ 958 $ 891 $ 822 $ 1,384 $ 1,491
Common Share Data
Basic net income per share (2) $ 0.04 $ 0.03 $ 0.05 $ 0.14 $ 0.05 $ 0.08 $ 0.09
Diluted net income per share (2) 0.02 0.02 0.03 0.07 0.02 0.04 0.04
Dividend 0.00 0.00 0.00 0.00 0.00 0.00 0.00
Tangible book value per share (3) 2.97 2.90 2.82 2.71 2.58 2.97 2.58
Book value per share (3) 2.60 2.53 2.45 2.34 2.10 2.60 2.10
Weighted average shares outstanding - basic 18,290,674 18,232,169 18,232,169 18,232,169 18,209,032 18,261,584 18,185,641
Weighted average shares outstanding - diluted 33,009,983 32,815,744 32,757,855 34,589,375 36,783,724 32,950,273 36,664,538
Financial Condition Data
Total assets $ 708,270 $ 702,152 $ 721,259 $ 723,733 $ 694,812 $ 708,270 $ 694,812
Loans 513,755 489,273 491,337 507,677 488,762 513,755 488,762
Allowance for loan losses (7,251 ) (7,865 ) (7,947 ) (8,217 ) (8,055 ) (7,251 ) (8,055 )
Investment securities 124,784 123,500 121,281 118,345 119,571 124,784 119,571
Deposits 535,367 542,938 536,931 523,729 517,452 535,367 517,452
Borrowings 69,174 57,220 86,710 104,357 76,427 69,174 76,427
Stockholders' equity 94,035 92,507 91,035 88,993 97,313 94,035 97,313
Financial Ratios and Other Data
Performance Ratios:
Net interest margin (4) 2.89 % 2.94 % 2.89 % 2.97 % 3.15 % 2.92 % 3.18 %
Net interest spread (5) 2.58 % 2.64 % 2.62 % 2.72 % 2.92 % 2.62 % 2.96 %
Noninterest income to average assets (6) 1.52 % 0.76 % 0.84 % 1.72 % 1.77 % 1.14 % 1.47 %
Noninterest expense to average assets 3.72 % 3.14 % 3.54 % 3.82 % 3.99 % 3.44 % 3.82 %
Efficiency ratio (7) 87.45 % 89.24 % 99.18 % 84.63 % 84.56 % 88.26 % 85.80 %
Earnings on average assets (8) 0.43 % 0.36 % 0.53 % 0.50 % 0.49 % 0.39 % 0.45 %
Earnings on average equity (9) 3.28 % 2.76 % 4.23 % 3.77 % 3.36 % 3.03 % 3.07 %
Asset Quality Ratios:
Nonaccrual loans to loans (10) 1.12 % 1.29 % 1.34 % 0.73 % 0.53 % 1.12 % 0.53 %
Nonaccrual loans, restructured loans and
loans 90 days or more past due and still
accruing to total loans (10) 1.45 % 1.66 % 1.62 % 1.09 % 0.82 % 1.45 % 0.82 %
Nonperforming assets, restructured loans
and loans 90 days or more past due and still
accruing to total assets (10) 1.40 % 1.51 % 1.45 % 1.11 % 0.94 % 1.40 % 0.94 %
Allowance for loan losses to total loans (10) 1.41 % 1.61 % 1.62 % 1.62 % 1.65 % 1.41 % 1.65 %
Allowance for loan losses to nonaccrual loans,
restructured loans and loans 90 days or
more past due and still accruing (10) 97.34 % 96.96 % 99.72 % 148.99 % 200.97 % 97.34 % 200.97 %
Net charge-offs (recoveries) annualized
to average loans (10) 0.44 % (0.06 %) (0.74 %) (0.14 %) (0.48 %) 0.19 % -0.14 %
Capital Ratios:
Total equity to total assets 13.28 % 13.17 % 12.62 % 12.30 % 14.01 % 13.28 % 14.01 %
Total risk-based capital ratio 15.32 % 15.56 % 15.34 % 14.43 % 16.40 % 15.32 % 16.40 %
Tier 1 risk-based capital ratio 14.07 % 14.31 % 14.09 % 13.18 % 15.14 % 14.07 % 15.14 %
Leverage capital ratio 10.64 % 10.39 % 10.10 % 9.90 % 11.70 % 10.64 % 11.70 %
Other Data:
Number of employees (full-time equivalent) 180 177 183 188 184 180 184
Number of banking facilities 11 11 11 11 11 11 11
(1) Noninterest income includes gains and losses on securities.
(2) Net income available to common stockholders in the calculation of earnings per share for the second and third quarters of 2018 and the six months ended June 30, 2018 includes the difference between the carrying amount less the consideration paid for redeemed preferred stock of $0.1 million, $1.7 million and $0.1 million, respectively.
(3) Tangible book value per share is the stockholder equity less the carry value of the preferred stock and less the goodwill and intangible assets, divided by the total shares of common outstanding. Book value per share is the stockholder equity less the liquidation preference of the preferred stock, divided by the total shares of common outstanding. As presented here, shares of common outstanding excludes unvested Restricted Stock Awards totalling 1,244,105 shares of common stock at June 30, 2019.
(4) Net interest margin is the ratio of net interest income to average interest-earning assets.
(5) Net interest spread is the yield on average interest-earning assets less the rate on average interest-bearing liabilities.
(6) Noninterest income to average assets excludes gains and losses on securities.
(7) The efficiency ratio is noninterest expense divided by the sum of net interest income plus noninterest income, excluding gains and losses on securities.
(8) Earnings on average assets are net income divided by average total assets.
(9) Earnings on average equity are net income divided by average stockholders' equity.
(10) Excludes loans held for sale.
CIB MARINE BANCSHARES, INC.
Consolidated Balance Sheets (unaudited)
June 30, March 31, December 31, September 30, June 30,
2019 2019 2018 2018 2018
(Dollars in Thousands, Except Shares)
Assets
Cash and due from banks $ 8,791 $ 8,168 $ 13,037 $ 10,055 $ 9,752
Reverse repurchase agreements 18,347 42,729 58,662 45,076 28,403
Securities available for sale 122,365 121,115 118,926 116,013 117,221
Equity securities at fair value 2,419 2,385 2,355 2,332 2,350
Loans held for sale 8,450 4,467 4,632 8,145 15,407
Loans 513,755 489,273 491,337 507,677 488,762
Allowance for loan losses (7,251 ) (7,865 ) (7,947 ) (8,217 ) (8,055 )
Net loans 506,504 481,408 483,390 499,460 480,707
Federal Home Loan Bank Stock 2,363 2,003 3,172 3,870 2,610
Premises and equipment, net (1) 7,386 7,220 4,498 4,409 4,296
Accrued interest receivable 1,820 1,873 1,570 1,858 1,580
Deferred tax assets, net 20,703 21,156 21,422 22,410 22,604
Other real estate owned, net 2,466 2,466 2,486 2,494 2,494
Bank owned life insurance 4,640 4,613 4,590 4,565 4,541
Goodwill and other intangible assets 165 171 176 181 187
Other assets 1,851 2,378 2,343 2,865 2,660
Total Assets $ 708,270 $ 702,152 $ 721,259 $ 723,733 $ 694,812
Liabilities and Stockholders' Equity
Deposits:
Noninterest-bearing demand $ 62,424 $ 62,553 $ 63,507 $ 69,165 $ 72,839
Interest-bearing demand 32,649 32,467 33,660 33,701 32,615
Savings 192,133 188,110 181,432 164,603 175,343
Time 248,161 259,808 258,332 256,260 236,655
Total deposits 535,367 542,938 536,931 523,729 517,452
Short-term borrowings 69,174 57,220 86,710 104,357 76,427
Accrued interest payable 725 727 710 694 497
Other liabilities 8,969 8,760 5,873 5,960 3,123
Total liabilities 614,235 609,645 630,224 634,740 597,499
Stockholders' Equity
Preferred stock, $1 par value; 5,000,000
authorized shares; 7% fixed rate noncumulative perpetual issued; 42,955 shares of series A and 3,380 shares of series B; convertible; aggregate liquidation preference- $46.3 million 39,384 39,384 39,384 39,384 50,107
Common stock, $1 par value; 75,000,000
authorized shares; 18,455,610 issued shares; 18,244,563 outstanding shares 18,543 18,456 18,456 18,454 18,454
Capital surplus 160,991 160,930 160,815 160,716 158,903
Accumulated deficit (124,412 ) (125,173 ) (125,796 ) (126,754 ) (127,140 )
Accumulated other comprehensive income (loss), net 63 (556 ) (1,290 ) (2,273 ) (2,477 )
Treasury stock 221,902 shares at cost (534 ) (534 ) (534 ) (534 ) (534 )
Total stockholders' equity 94,035 92,507 91,035 88,993 97,313
Total liabilities and stockholders' equity $ 708,270 $ 702,152 $ 721,259 $ 723,733 $ 694,812
(1) The adoption of the new lease accounting standards effective January 1, 2019 resulted in $2.8 million of right of use assets being recorded in premise and equipment, net and a corresponding liability in other liabilities.
CIB MARINE BANCSHARES, INC.
Consolidated Statements of Operations (Unaudited)
At or for the
Quarters Ended 6 Months Ended
June 30, March 31, December 31, September 30, June 30, June 30, June 30,
2019 2019 2018 2018 2018 2019 2018
(Dollars in thousands)
Interest Income
Loans $ 5,811 $ 5,693 $ 5,686 $ 5,638 $ 5,372 $ 11,504 $ 10,497
Loans held for sale 97 85 86 112 117 182 190
Securities 868 804 828 720 720 1,672 1,495
Other investments 302 433 409 328 178 735 214
Total interest income 7,078 7,015 7,009 6,798 6,387 14,093 12,396
Interest Expense
Deposits 1,949 1,805 1,547 1,343 1,038 3,754 1,986
Short-term borrowings 307 373 517 424 368 680 605
Total interest expense 2,256 2,178 2,064 1,767 1,406 4,434 2,591
Net interest income 4,822 4,837 4,945 5,031 4,981 9,659 9,805
Provision for (reversal of) loan losses (67 ) (158 ) (1,195 ) (13 ) 149 (225 ) 23
Net interest income after provision for
(reversal of) loan losses 4,889 4,995 6,140 5,044 4,832 9,884 9,782
Noninterest Income
Deposit service charges 95 83 79 105 110 178 221
Other service fees 29 20 31 30 40 49 74
Mortgage Banking revenue, net 2,148 978 1,057 1,760 2,155 3,126 3,529
Other income 179 165 143 173 153 344 285
Net gains (losses) on sale of securities available for sale 0 0 0 (7 ) 0 0 22
Unrealized gains (losses) recognized on equity securities 34 30 23 (18 ) (18 ) 64 (57 )
Net gains on sale of assets 225 86 213 1,020 528 311 726
Total noninterest income 2,710 1,362 1,546 3,063 2,968 4,072 4,800
Noninterest Expense
Compensation and employee benefits 4,445 3,687 4,206 4,514 4,682 8,132 8,738
Equipment 353 335 364 351 337 688 648
Occupancy and premises 437 456 423 378 422 893 839
Data Processing 160 166 169 184 162 326 316
Federal deposit insurance 66 82 74 51 48 148 97
Professional services 207 140 270 623 290 347 456
Telephone and data communication 83 78 86 78 79 161 157
Insurance 52 53 47 60 63 105 124
Other expense 754 508 776 632 654 1,262 1,186
Total noninterest expense 6,557 5,505 6,415 6,871 6,737 12,062 12,561
Income from operations
before income taxes 1,042 852 1,271 1,236 1,063 1,894 2,021
Income tax expense 281 229 313 345 241 510 530
Net income 761 623 958 891 822 1,384 1,491
Preferred stock dividend 0 0 0 0 0 0 0
Discount from repurchase of preferred shares 0 0 0 1,703 105 0 105
Net income allocated to
common stockholders $ 761 $ 623 $ 958 $ 2,594 $ 927 $ 1,384 $ 1,596
Source: CIBM Bank
© 2019 GlobeNewswire, Inc.
I hope so! Its amazing how quiet it is on here lately. I am still acquiring some of my shares back. I had to sell about 20k due to some cash flow issues. Soooooo, the lower the better for me right now.
It's almost time to slam the lid on another quarter y'all. I wonder if the numbers will be good enough to get the pps to finally surge past the two buck level? Since I'm always the optimist, I'll say yes.
Meeting was good. Two questions were asked.....one was “can the preferred shares be exchanged for commons?”
Sure can. My opinion is how stupid would they be to do that....give them voting rights? Hahaha! Not happening!
Pretty sad we are trading way under book value as well. No I am not going I dont have enough skin in the game to travel that far. Are you going?
Pretty sad when the largest institutional holder of CIBH has 41,580 shares. What’s up with that? Anyone going to the shareholder meeting tomorrow?
|
Followers
|
31
|
Posters
|
|
|
Posts (Today)
|
0
|
Posts (Total)
|
5847
|
|
Created
|
05/14/10
|
Type
|
Free
|
| Moderators | |||
Principal Executive Offices
Elizabeth Neighbors, Paralegal and Investor Relations Manager
1930 W. Bluemound Road, Suite D
Waukesha, WI 53186
Phone: 262.695.6010
Fax: 262.695.8319
Email: shareholderrelations@cibmarine.com
CIB MARINE BANCSHARES INC.
Outstanding Shares: 18,135,344 (Mar 31, 2017)
Float: 16,780,711 (Mar 31, 2017)
Company Officers/Contacts
Brian Chaffin (President, CEO)
Patrick Straka (EVP, CFO)
Daniel Rasmussen (EVP, Secretary, General Counsel, Chief Admin. Officer)
Paul Melnick (EVP, Chief Credit Officer)
Elizabeth Neighbors (IR Manager, Asst. Secretary)
Company Directors
Mark Elste (Chairman)
Charles Baker
Brian Chaffin
Mark Henderson
John Hickey
Willard Bunn III
Gary Longman
Charles Mires
Steven Palmitier
Ronald Rhoades
Summary
CIB Marine Bancshares, Inc. is a bank holding company with its principal executive offices in Waukesha, Wisconsin, a suburb of Milwaukee.
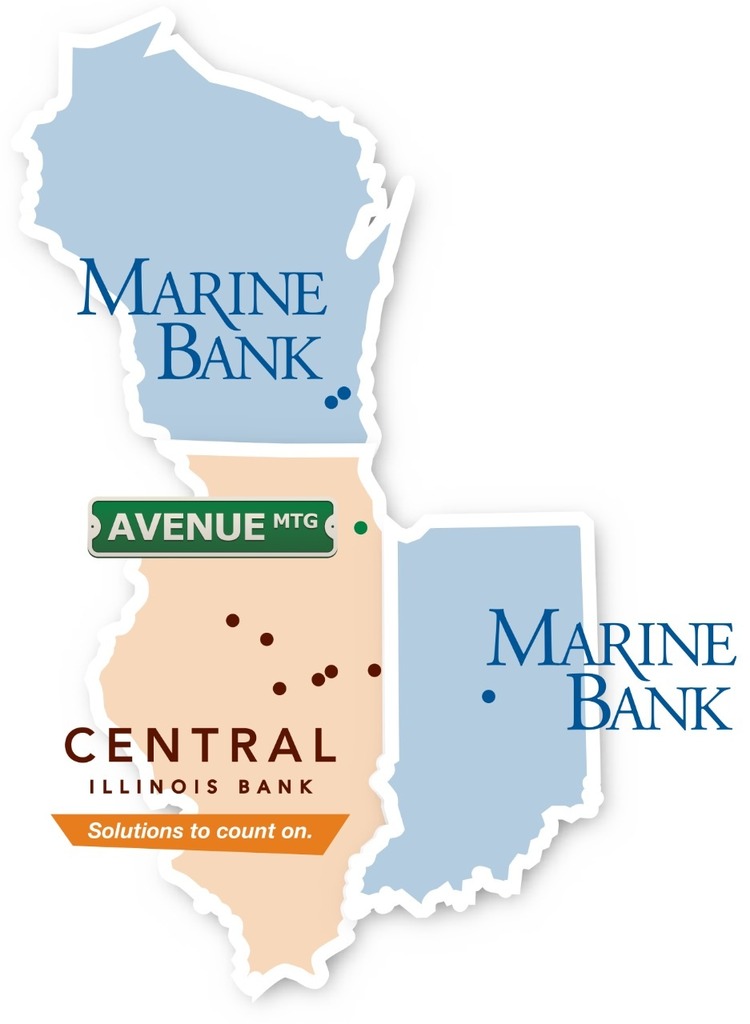
CIB Marine Bancshares, Inc. owns and operates CIBM Bank, which serves communities throughout Central Illinois; Indianapolis, Indiana; Milwaukee, Wisconsin and Chicago, IL; through its full-service banking offices. CIBM Bank operates under the name “Central Illinois Bank” in its central Illinois market, “Marine Bank” in its Indiana and Wisconsin markets and "Avenue Bank" in its Chicagoland market.
CIBM Bank offers a full array of traditional banking services, including a broad range of loan products, such as commercial loans, commercial real estate loans, commercial and residential construction loans, one-to-four family residential real estate loans, consumer loans, and commercial and standby letters of credit; acceptance of demand, savings and time deposits; commercial paper and repurchase agreements; and other banking services
CIB Marine Bancshares, Inc. owns and operates 11 branches in these markets
Waukesha, WI

Elm Grove, WI

Indianapolis, IN

Wheaton, IL

Danville, IL
Urbana, IL

Champaign, IL (Midtown)

Champaign, IL

Monticello, IL

Bloomington, IL
Peoria, IL
CIBH Effective Date Forward (10/29/09):
| Volume | |
| Day Range: | |
| Bid Price | |
| Ask Price | |
| Last Trade Time: |


