 News
News  Market Data
  Discover
Support: 888-992-3836
Copyright © 2023 InvestorsHub Inc.


Register for free to join our community of investors and share your ideas. You will also get access to streaming quotes, interactive charts, trades, portfolio, live options flow and more tools.
Cereplast -- >>> Cereplast Provides an Overview of the First Half of 2013 and an Outlook for the Remainder of the Year
Press Release: Cereplast, Inc
Jul 30, 2013
http://finance.yahoo.com/news/cereplast-provides-overview-first-half-120000360.html
SEYMOUR, Ind., July 30, 2013 (GLOBE NEWSWIRE) -- Cereplast, Inc. (CERP) (the "Company"), a leading manufacturer of proprietary biobased, compostable and sustainable bioplastics, today is providing a shareholder update including an overview of the first half of 2013 and an outlook for the remainder of the year. The Company has made great strides over the past seven months and anticipates continued growth and success during the rest of 2013.
Compared to 2012, revenue for the first 6 months of 2013 experienced major growth, with the expected number to top approximately $1.7MM compared to about $0.2MM in 2012, reflecting a nearly 800% increase. This growth was fueled by the passing of Italian legislation that will require merchants to replace traditional single-use plastic bags with bioplastic and other alternatives. Severe sanctions will be imposed upon merchants that do not comply. Although this legislation is pending enforcement, management expects it to go into full effect in the fall of 2013. Upon enforcement, the Company believes that there will be a substantial increase in demand for its bioplastic resins. For the past 18 months, the Company has nurtured a group of over 70 Italian companies that have completed multiple successful tests with various grades of Cereplast Compostables(R) blown film resins. The Company estimates that the potential addressable market for their blown film resins in Italy is approximately $50 million per year. The Company has ample production capacity to serve such a demand.
Cereplast's office in Hyderabad, India has been actively educating local converters and introducing Cereplast resins. The demand is starting to accumulate, and several agreements are currently underway. India is one of the largest consumers of plastic polymers in the world, and the potential volume for bioplastic sales in the country is quite significant as they adopt bioplastic alternatives to conventional plastics, India is also very sensitive to the environment and has experienced firsthand the calamities created by excess industrialization and carbon dioxide emissions.
In the United States, the Company is working on over ten new projects both for Cereplast Compostables(R) resins and Cereplast Sustainables(R) resins. The steady increase in oil pricing is fueling a renewed interest in Cereplast resins and with two new business development managers dedicated to the domestic market, Management is confident to see measurable results before the end of Q3.
The Cereplast Research and Development department commercialized two new resins including Biopropylene A150D, an injection molding grade manufactured with 51% post-industrial algae biomass, and Compostable 2020D, an extrusion blow molding resin. Two new patents were granted and applications have been filed to protect the Company's new innovation in nano materials and algae biobased resins. The Company also incorporated a new, wholly owned subsidiary Algaeplast vehicle to develop algae-related research.
On the corporate side, the Company adopted an aggressive approach and filed legal actions against certain clients for their 2011 unpaid purchases. The Company was already successful in recouping valuable inventory in Italy as a settlement for outstanding receivables and is optimistic about the overall outcome of these pending actions.
"We are optimistic for the remainder of the year," said Mr. Frederic Scheer, Cereplast's Chairman and Chief Executive Officer. "Growth is expected to continue and increase and we believe that our growth projections will contribute to a stronger share price. The fundamentals of the company are excellent and our Management team is working to exceed our shareholders' revenue expectations."
About Cereplast, Inc.
Cereplast, Inc. (CERP) designs and manufactures proprietary biobased, sustainable bioplastics which are used as substitutes for traditional plastics in all major converting processes - such as injection molding, thermoforming, blow molding and extrusions - at a pricing structure that is competitive with traditional plastics. On the cutting-edge of biobased plastic material development, Cereplast now offers resins to meet a variety of customer demands. Cereplast Compostables(R) resins are ideally suited for single-use applications where high biobased content and compostability are advantageous, especially in the food service industry. Cereplast Sustainables(R) resins combine high biobased content with the durability and endurance of traditional plastic, making them ideal for applications in industries such as automotive, consumer electronics and packaging. Learn more at www.cereplast.com. You may also visit the Cereplast social networking pages at Facebook.com/Cereplast, Twitter.com/Cereplast and Youtube.com/Cereplastinc.
<<<
W. R. Grace - profile -
>>> W. R. Grace & Co. engages in the production and sale of specialty chemicals and materials worldwide. Its Grace Catalysts Technologies segment offers fluid catalytic cracking (FCC) catalysts for the production of transportation fuels, such as gasoline and diesel fuels, and other petroleum-based products; FCC additives; hydro processing catalysts used in process reactors to upgrade heavy oils; polyolefin catalysts and catalyst supports for the production of polypropylene and polyethylene thermoplastic resins; and chemical catalysts used in industrial, environmental, and consumer applications. The company?s Grace Materials Technologies segment offers silica-based and silica-alumina-based engineered materials used in industrial and consumer, coatings and print media, pharmaceutical, and life science and related applications; and packaging materials, such as can and closure sealants, and coatings for cans and closures. This segment also provides polyolefin catalysts and catalyst supports for use in the manufacture of polyethylene and polypropylene resins; and chromatography columns and consumables, and CO2 adsorbents used in anesthesiology and mine safety applications. The company?s Grace Construction Products segment offers specialty construction chemicals and materials, including concrete admixtures and polymeric fibers; additives used in cement processing; products for architectural concrete; admixtures for masonry concrete; process control solutions for ready mix concrete; building materials for new construction and renovation/repair projects that include waterproofing membranes, specialty grouts, and air and vapor barriers, and other products for preventative and repair applications; and fire protection products. W. R. Grace & Co. was founded in 1854 and is headquartered in Columbia, Maryland. On April 2, 2001, W. R. Grace & Co. filed a voluntary petition for reorganization under Chapter 11 in the United States Bankruptcy Court for the District of Delaware. <<<
WD-40 Company - profile -
>>> WD-40 Company (WDFC) engages in the provision of consumer products worldwide. It offers multi-purpose maintenance products under the WD-40 brand for household, marine, automotive, construction, repair, sporting goods, gardening, and various industrial applications; multi-purpose drip oil and spray lubricant products, and other specialty maintenance products under the 3-IN-ONE brand for household, locksmithing, HVAC, marine, farming, construction, and jewelry manufacturing applications; and industrial grade and specialty maintenance products that include lubricants, penetrants, degreasers, and cleaners under the Blue Works brand for various industrial applications. The company also provides specialty problem solving products, which comprise penetrants, water resistant silicone sprays, corrosion inhibitors, and rust removers under the WD-40 Specialist name; and bicycle maintenance products that include wet and dry chain lubricants, heavy-duty degreasers, foaming bike wash, and frame protectants under the WD-40 Bike name for avid cyclists, bike enthusiasts, and mechanics. In addition, it offers homecare and cleaning products, such as liquid mildew stain removers and automatic toilet bowl cleaners under the X-14 brand; automatic toilet bowl cleaners under the 2000 Flushes brand; room and rug deodorizers in the form of powder, aerosol foam, and trigger spray under the Carpet Fresh brand; aerosol carpet stain removers, and liquid trigger carpet stain and odor eliminators under the Spot Shot brand; carpet and household cleaners, and rug and room deodorizers under the 1001 brand; and heavy-duty hand cleaner products in bar soap and liquid form under Lava and Solvol brands. The company sells its products primarily through mass retail and home center stores, warehouse club stores, grocery stores, hardware stores, automotive parts outlets, and industrial distributors and suppliers. WD-40 Company was founded in 1953 and is headquartered in San Diego, California. <<<
Westlake Chemicals - profile -
>>> Westlake Chemical Corporation (WLK) manufactures and markets basic chemicals, vinyls, polymers, and fabricated building products. It operates in two segments, Olefins and Vinyls. The Olefins segment provides ethylene, polyethylene, styrene monomer, and various ethylene co-products, such as chemical grade propylene, crude butadiene, pyrolysis gasoline, and hydrogen. The Vinyls segment offers polyvinyl chloride (PVC), vinyl chloride monomer, ethylene dichloride, chlorine, caustic soda, and ethylene. This segment also manufactures and sells building products fabricated from PVC, including pipe, fence and deck, and window and door components. The company?s products are used in various applications, which include consumer and industrial markets, such as flexible and rigid packaging, automotive products, coatings, and residential and commercial construction, as well as in other durable and non-durable goods. Westlake Chemical Corporation provides its products for chemical processors, plastics fabricators, construction contractors, municipalities, and supply warehouses in the United States, Canada, Singapore, Switzerland, and internationally. The company was founded in 1985 and is headquartered in Houston, Texas. <<<
Valspar - profile -
>>> The Valspar Corporation (VAL) manufactures and distributes various coatings, paints, and related products worldwide. The company operates in two segments, Coatings and Paints. The Coatings segment offers decorative and protective coatings for metal, wood, and plastic primarily for original equipment manufacturing customers. Its products include primers, topcoats, varnishes, sprays, stains, fillers, and other coatings for various customers in manufacturing industries, such as agricultural and construction equipment, appliances, building products, furniture, metal fabrication, metal packaging, and transportation. This segment also offers coatings for interior and exterior metal packaging containers comprising food containers and beverage cans; coatings for aerosol and paint cans; and crowns for glass bottles, plastic packaging, and bottle closures. In addition, it provides coatings that are applied to metal coils; general industrial products, including powder, liquid, and electrodeposition coating technologies; and wood products, including decorative and protective coatings for wood furniture, building products, cabinets, and floors, as well as color design manufacturing and technical services. The Paints segment offers consumer paints consisting of interior and exterior decorative paints, stains, primers, varnishes, and floor paints, as well as specialty decorative products, such as enamels, aerosols, and faux finishes that are used in do-it-yourself and professional markets. It also offers automotive refinish and aerosol spray paints. This segment distributes its products through home centers, hardware wholesalers, distributors, retailers, independent dealers, body shops, and company-owned stores. The Valspar Corporation also manufactures and sells specialty polymers and colorants, as well as sells furniture protection plans, and furniture care and repair products under the Guardsman brand. The company was founded in 1806 and is headquartered in Minneapolis, Minnesota. <<<
Sensient -- >>> Sensient : Solid Growth And Much Cheaper Than The Competition
Jul 2 2013
by: Matthew Frankel
http://seekingalpha.com/article/1530992-sensient-solid-growth-and-much-cheaper-than-the-competition?source=yahoo
Sensient Technologies (SXT) has lagged the S&P 500 so far this year, with shares up just 7%. Despite rising revenues and increasing profit margins, this maker of colors, flavors, and fragrances has not managed to keep up with its competition. For example, International Flavors & Fragrances (IFF) is perhaps the closest comparison to Sensient and is up about 15% so far in 2013. Does this mean that Sensient is one of the bargains in this industry, or would investors be better off putting their money in one of the alternatives?
About Sensient
As mentioned, Sensient is a manufacturer of various products related to colors, flavors, and fragrances. The company's operations are categorized into two segments, the Flavors & Fragrances Group and the Color Group.
Flavors & Fragrances include products that are meant to enhance or alter the flavor or aroma of a customer's products. Most of this segment is geared toward the food industry, but also produces flavorings for the pharmaceutical business. Products made by the segment include flavor-delivery systems, essential oils, natural and artificial flavors, aroma chemicals, and the company's dehydrated flavors business, Sensient Dehydrated Flavors. The dehydrated products include onion and garlic-based seasonings as well as a line of other spices and dehydrated vegetables.
The Color Group produces a variety of colorings for beverages, processed foods, confections, pet foods, cosmetics, and more. The group operates under several trade names such as Sensient Food Colors, Sensient Pharmaceutical Technologies, Sensient Paper Colors, and Sensient Cosmetic Technologies.
Growth
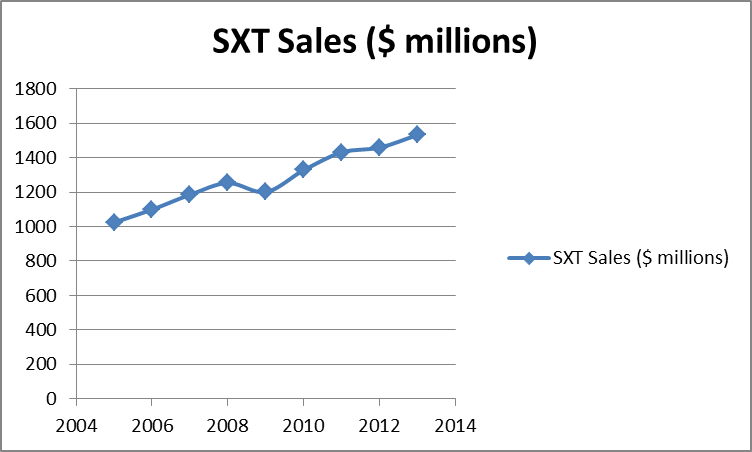
After a small contraction in revenues brought on by the recession, Sensient has grown its revenues every year since 2009 and is projected to grow by 5% this year. Additionally, profit margins have been widening in recent years, and this trend is also projected to continue due to increased demand for their products which leads to greater pricing power. The company is expecting operating margins of 17.2% this year, up from 17.0% in 2012.
(click to enlarge)
Sensient's recent trend is toward more natural colors and flavorings, recognizing the changing desires of consumers. Currently, the company produces a mix of natural and synthetic products and has expressed its intention to invest significant capital in research and development over the next few years in order to make this transition, as well as to increase its production capacity as global demand grows.
Looking at the chart above, other than the peak recessionary years, Sensient's growth actually seems very linear (and maybe even predictable). If you believe (as I do) that the economic recovery will continue for the next several years, there is no reason to think this growth pattern will change, especially with increased R&D spending. A further increase in sales should also lead to further improvement in Sensient's profit margins, which will translate to a very nice earnings growth rate.
Valuation and alternatives
Sensient currently trades at a significant discount to its competitors. Shares trade at 15.3 times last year's earnings, which due to the previously mentioned combination of higher revenues and wider margins are expected to grow by just over 6% this year. However, the consensus estimates call for earnings growth to increase significantly beyond this year, as current R&D efforts begin to pay off. The median estimates are $3.00 and $3.27 per share for 2014 and 2015, respectively, for annual earnings growth of 11.1% and 9%.
Also worthy of consideration is the company's relatively low debt load, which has been reduced by 25% since 2008. In fact, Sensient's debt-to-capital ratio is just 23.9%, far below the industry average of 38.3%, which is one of my favorite indicators of financial strength. In contrast, International Flavors & Fragrances has a far less attractive ratio of 43.7% and trades at a more expensive P/E of 19.2 times last year's earnings with similar growth projections as Sensient.
The largest name in the space is McCormick (MKC) which produces spices, seasonings, and flavorings under several well-known brand names. McCormick is about four times the size of Sensient in terms of both market cap and sales. While McCormick trades at a much higher valuation of 21.8 times earnings, it is growing more rapidly due to the higher pricing power and brand marketing ability that comes with being a sector leader.
Risks
The most obvious risk would be a slowdown or reversal in the U.S. economic recovery. Companies like Sensient tend to perform in line with the overall economy, as can be seen in the chart above.
Other risks include increased competition and increased pricing pressure from larger companies. In my opinion, one of the worst things that could happen for Sensient would be for one of its rivals to get taken over by a large food company with deep pockets such as General Mills or Kellogg. On the other hand, if Sensient continues to grow at such a consistent and attractive rate, it could very well become a takeover target itself.
Conclusion
Sometimes in a business like this, the best way to find bargains is to look at the smaller, less well-known names like Sensient. With better financial strength and cheaper valuation than its competition, as well as solid growth and increased investment in evolving its product line, Sensient is by far the most attractive name in the flavorings and fragrances business. Over the next few years I would like to see the company try to grow the retail size of its business. Just think of how much of a household name McCormick is. Sensient needs to strive to become this kind of brand name in order to jump to the next level.
So where do I think Sensient could go? Assuming that the current P/E doesn't change, which is a conservative assumption based on the valuation of its peers, shares could easily reach $50 next year if the company performs to expectations, an upside of about 20% over current levels.
<<<
International Flavors & Fragrances - profile -
>>> International Flavors & Fragrances Inc. (IFF), together with its subsidiaries, creates, manufactures, and supplies flavor and fragrance products worldwide. The company operates in two segments, Flavors and Fragrances. The Flavors segment offers flavor compounds primarily to the food and beverage industries for use in consumer products, such as prepared foods, beverages, dairy, food, and sweet products. The Fragrances segment provides functional fragrances, including fragrance compounds for personal care and household products; fine fragrance and beauty care comprising perfumes, colognes, and toiletries; and fragrance ingredients consisting of synthetic and natural ingredients that could be combined with other materials to create functional and fine fragrance compounds. This segments? customer include perfume and toiletries manufacturers in the cosmetics industry; and manufacturers of soaps, detergents, fabric care, household cleaners, and air fresheners in the household products industry. International Flavors & Fragrances Inc. was founded in 1909 and is headquartered in New York, New York. <<<
Plum Creek Timber -- >>> Plum Creek Timber profit nearly doubles on margins
April 29, 2013
By Debbie Cai
http://www.marketwatch.com/story/plum-creek-timber-profit-nearly-doubles-on-margins-2013-04-29?siteid=bigcharts&dist=bigcharts
Plum Creek Timber Co.'s /quotes/zigman/206602/quotes/nls/pcl PCL +1.64% first-quarter earnings almost doubled as the real-estate investment trust posted wider margins.
For the current quarter, Plum Creek predicts per-share earnings of 20 cents to 25 cents, below the 34 cents projected by analysts polled by Thomson Reuters. The company said it expects higher demand for lumber and structural panels to keep pressure on sawlog prices in the foreseeable future.
Plum Creek is one of the largest private timberland owners in the U.S., holding about 6.4 million acres. The company is expected to benefit from a gradual housing recovery, along with higher demand from Asian markets and the rise of biomass for alternative energy. It has reported strong top- and bottom-line growth in recent quarters.
Plum Creek reported a profit of $56 million, or 35 cents a share, up from $29 million, or 18 cents a share, a year earlier. In January, the company estimated per-share earnings between 28 cents and 33 cents.
Revenue improved 0.9% to $340 million. Analysts polled by Thomson Reuters had projected revenue of $335 million.
Operating margin widened to 22.9% from 14.8% as costs and expenses declined.
The timber segment, which contributes the largest share of revenue, grew 9.7%. At the company's real-estate business, revenue was 22% lower, while the manufacturing segment's revenue increased 13%.
Shares of the company, which backed its full-year per-share income view, closed at $53.30 and were unchanged after hours. Through Monday's close, the stock is up 27% over the past 12 months.
<<<
Sensient, Quaker Chemical, HB Fuller -- >>> Three Specialty Chemicals Stocks to Consider
By Damon Churchwell
February 28, 2013
Tickers: FUL, HUN, KWR, RPM, SXT
http://beta.fool.com/dchurchwell/2013/02/28/three-specialty-chemicals-stocks-consider/25711/
Companies that focus on a particular sector or two as suppliers of chemical manufacturing additives seem to be attractive investments at this time. Examine each stock on an individual basis, according to the end markets and market share. I would like to highlight three such stocks that hold appeal now for near- or long-term price improvements.
Quaker Chemical Corp. (NYSE: KWR)
I have always been interested in this producer of chemicals for the automotive, aerospace and other heavy industries. A volatile stock with low trading volume, as indicated by its inflated beta (2.59), KWR is a selection for total-return investors. Its price upturn has brought the dividend yield to only about 1.7%. Still, it offers a good combination of growth and yield.
About 93% of revenues are delivered by the Metalworking Process Chemicals segment. Sales have historically climbed during periods of expansion in the automotive industry. Of late, product volumes have been on the rise across most regions, with the exception of Europe. Plus, price increases are providing a lift to gross profitability. In all, earnings probably jumped about $0.18, to $3.41 for the full year 2012.
Looking to this year, ongoing positive momentum ought to spur further profit gains. Stronger euro and Brazilian real currencies would assist the bottom line, as most of the impact of volume gains are being offset by weak currencies. In addition to auto, higher demand in sectors like aerospace and mining, aluminum, tube and pipe, and cans could be catalysts.
Sensient Technologies (NYSE: SXT)
This company’s December-quarter share-net result missed expectations by $0.05, inciting a modest selloff. The $0.55 tally was $0.02 lower year over year. Earnings fell despite a revenue increase of about 5%. Therefore, I think the company can bounce back with a margin improvement. And, the shares might now have enhanced upside potential following the price decline.
Sensient is a provider of fragrances and ingredients to the food industry. Excess costs in its Flavors & Fragrances unit was the cause of margin deterioration last year. Management has initiated a restructuring plan for 2013 to reduce expenses, the primary aspect being a relocation of its Flavors & Fragrances Group headquarters to Chicago from Indianapolis. The goal is $10 million in operating expense pruning annually. About 200 employees will be cut as Sensient consolidates facilities. The result ought to be a resumption of bottom-line gains this year.
H.B. Fuller (NYSE: FUL)
H.B. Fuller produces adhesives and construction related products. An acquisition, Forbo Holding’s adhesives business, was a source of growth in the second half of 2012 and should continue to bolster earnings through 2013, as the integration is completed. Fuller closed on that purchase in March, 2012.
For this fiscal year (ends in November), management is guiding toward revenue growth of around 10%, and operating income expansion of 20%. The core adhesives units look to be in good shape. Also, the North American construction unit, though only a modest portion of revenues, should contribute to earnings increases. Fuller’s construction unit mostly serves the residential market.
This company, too, is taking actions to consolidate and close facilities. It foresees pressure on the operating margin in the second half of this year, due to raw material cost hikes, and is aiming to offset the impact.
Of the three companies illustrated here, Fuller has the greatest near-term profit growth outlook. Along with acquisition benefits, it might well see gains from international markets, including Europe and China, where it is building a presence. Finally, Fuller is also gearing up for the long term.
FUL stock holds appeal based on the company’s growth strategy. They are worth considering at their current price.
Conclusion
Specialty Chemicals remains an industry to select from in my view. Take a look at my previous blogs, where I wrote about Hunstman Corp. and RPM International.
<<<
Plum Creek Timber -
Dew's comments -
http://investorshub.advfn.com/boards/replies.aspx?msg=87517575
>>> Even after the large run-up in price, PCL remains a core long-term holding, IMO. Despite its US focus, PCL is a bona fide play on The Global Demographic Tailwind via the increasing importance of wood exports to China and the use of biomass “waste” for power generation. I no longer have a specific price target because I think PCL is the kind of stock you hold forever.
If inflation ever returns in a big way (all that easy money has to have some effect eventually), timberlands are a fine inflation hedge. In the meantime, you get an ample tax-advantaged dividend with plenty of opportunity for one or more dividend hikes in the next few years.
The drop in the share price on Tuesday following the quarterly earnings report is something that happens with regularity because many analysts and investors don’t understand the company well enough to know what’s important and what’s not. In this instance, PCL sold fewer acres of real estate in 1Q13 than analysts were expecting, which lowered the “cash flow from operations” in the analysts’ models. Of course, land has a long shelf life, so any acres not sold in a given quarter are available for sale later, but the analysts don’t seem to comprehend this point. <<<
>>> Pipe Dreams: Can These Marijuana Stocks Make You Rich?
Mar 6 2013
by: Panoplos
http://seekingalpha.com/article/1250571-pipe-dreams-can-these-marijuana-stocks-make-you-rich?source=yahoo
3D printing systems? Online casinos? Wearable tech? Investors and non-investors alike are without a doubt fumbling over themselves, eager for a glimpse of what next revolution may take the world by storm.
3D Printing (or Additive Manufacturing)--though the concept has been around since the late '70s--has of late come of age as a technology and is expected to turn the current manufacturing paradigm on its head. 3D printing is estimated by Forbes to become a $3.1 billion dollar worldwide industry by 2016. It is no wonder early participants like 3D Systems Corporation (DDD) were selected by the investment gurus early on to skyrocket in value. Indeed, the company has more than doubled since its IPO in mid-2011.
396 people received this article by email alert
Add your email to get alerts on ERBB.PK too:
Get email alerts on ERBB.PK »This article was sent to people who get the newsletter. Get the newsletter »
Online gambling, according to The New York times, already generates $32 billion in annual revenues overseas and, with the advent of mobile betting platforms, has the potential to reach $100 billion worldwide by 2017. Early entrants such as Boss Media and Playtika were quickly swooped up by the big boys (Lottomatica Group, SpA (LTTOY.PK) and Ceasers Entertainment (CZR), respectively), bringing to the founders and their investors immense wealth; and things are just getting rolling!
Spectators were blown away when Google (GOOG) unveiled "How It Feels through [Google] Glass" to the world through a YouTube promotional video that achieved 14 million views in less than a week. According to an ABI research report, "wearable computing devices, like Apple's iWatch, will exceed 485 million annual shipments by 2018." It is no secret that devices like Google Glass and the predicted Apple (AAPL) iWatch stand to revolutionize the way we live and interact with each other and our environment, bringing huge profits to the companies that manage to capture these markets early.
So, what do these have to do with Marijuana?
In my previous article, Weeding Through The Growth: An In-Depth Analysis of Marijuana Stocks, I provided an outline of the Marijuana industry and initiated coverage of the most publicized of the publicly traded cannabis-related stocks. Of course, this article is but one of hundreds, and the pace of PR newswires, the nearly daily onslaught of breaking stories covering yet another state deliberating new legalization measures, and the mounting pressure in Washington to reconsider cannabis's current legal status all serve as an ever stronger indicator of an oncoming tsunami, one that will doubtlessly carry with it disruption and opportunity analogous in economic terms with the three industry-generating breakthroughs listed above.
In fact, The Economist recently published an article that highlights one Silicon Valley VC who values the cannabis market at $50 billion, and CNBC published a headline that conservatively figured the market was worth between $35 and $45 billion in 2010, long before the elections that made marijuana legal for recreational use in two states. However, reiterating the message of my previous article, the numbers are tricky due to lack of transparency in the industry and tend to focus only on cannabis in flower form, itself.
In referencing the above, I hope the parallel drawn will serve to hit home the sheer scale and potential of this industry for those who are not as familiar with the marijuana subculture. For those in the know, it goes without saying.
Recognizing this enormous scale, the reality is many early investors are approaching the cannabis industry with starry eyes, hoping against hope that this just might be the proverbial pot of gold at the end of their hazy rainbow, and that the little leprechaun of green would ne'er lead them astray. Other, more pessimistic types fear these folks are simply seeing the world through rainbow tinted glasses, staring down the barrel of their pipe to a life gone up in smoke. Only time will tell if riches are to be had by investing in the early marijuana market participants, or even if the current motley crew of frontrunner companies represent more than pipe dreams.
With this as the backdrop, in this article I will expand the previous analysis to cover two of the other smaller or less-publicized of the group. Namely:
(click to enlarge)
Please note that I originally intended to cover two additional participants in Terra Tech Corp. (TRTC.OB) and GW Pharmaceuticals Plc. (GWPRF.PK), but due to time constraints and in light of recent activity and further availability of information since initiating coverage of the sector, I decided it would be better to instead use the time to revisit a couple of the companies discussed in the first article of this series. To all those that were hoping to see analyses of these two entries, please accept my sincerest apologies and rest assured I will follow up with expanded coverage within the next couple weeks.
Now, without further interruptions, let's get started.
Medical Marijuana, Inc. (MJNA.PK)
Right on the heels of the Michael Llamas scandal instigated by the infamous Infitialis article, a hot debate has formed around MJNA's recently announced divestiture of its PhytoSPHERE holdings to CannaVEST in the form of an asset sell-off. The company has not made any official public statements regarding the deal beyond a reiteration of what is found in its recent Annual Report and press release. This has left investors and analysts perplexed and hopeful more information will be forthcoming.
To fill the gap left by the company, voices in the community have been raised both in defence of the deal structure, claiming it an ingenious move on MJNA's part that enables them to distance themselves from the legal barbs of cultivating marijuana and hemp until legislation change is achieved, and in questioning the legitimacy and efficacy of the deal to ultimately increase shareholder value.
Those who are cautious about the transaction, myself included, believe MJNA owes its investors a more thorough explanation and would do well to address the more invective criticisms of the deal. For instance,
How was the appraisal value of $39.5 million for Foreclosure Solutions, Inc. (FCLS.OB) determined? On Nov. 16, 6,979,900 shares of FCLS (representing 99.7% of the company) were purchased by an acquiring group for $375,000 total.
In a typical share-based acquisition scenario, the acquiring party issues X number of shares to the target company's shareholders in proportion to the then-current market value of those shares. Keep in mind FCLS traded with literally next to nil turnover at a share price under $2 just weeks before FCLS's 8-K filing, and an even lower PPS not too long before that. The sudden jump in value to $5 was obviously achieved by colluding on the open market to set the share price of the shell company at the desired target.
Moreover, there is something very atypical about this reverse merger: in a standard reverse takeover, the proprietor of the merged entity retains full ownership of the resultant company, especially if the parent organization is public. This is to insure owners of the parent company--public investors in the case of MJNA--retain the full value of their investment. However, in the case of the CannaVEST deal, MJNA and its investors are not guaranteed ownership. (More on this to come.)
No mention was made as to how MJNA reached a valuation of $35 million for the PhytoSPHERE assets. According to the Q4 report, the Cannabidiol "inventory" alone was appraised at this value. The Annual Report repaints the picture entirely, however, by divulging the complete emptying of PhytoSPHERE into CannaVEST in return for an initial installment of 900K shares (or 11.4%) of the company and a promissory note for the remaining balance. Why was the "audited" financial report in conflict with the truth about the deal?
Additionally, the Q3 report establishes that PhytoSPHERE contributed $1 million in revenues for the quarter on G&A expenses of a mere $356K specific to the subsidiary. Rough estimates would give PhytoSPHERE a net profit margin of ~60-70%. Absurdities aside, if we were to take the $15 million purchase price for the 460 kg of CBD oil that MJNA is expected to pay CannaVEST over the year, this would mean PhytoSPHERE was capable of turning $10 million in profits from the production of the oil.
The quandary for shareholders is that they are getting a total of $35 million for a portfolio company that is apparently capable of generating at least $10 million in annual profits with significant assets, IP and a demonstrated potential for growth that would make many companies envious.
Recall, CannaVEST has the option to pay the remaining balance in cash, which would result in only minority ownership for MJNA, leaving shareholders in the lurch. This, of course, is predicated on the assumption MJNA will not liquidate its small stake; however, it is easily deduced from the fact the company is declaring these shares as "cash flows" that this is exactly what it intends to do. Which brings us to our next question:
What if PhytoSPHERE is not worth $35 million? The assumptions outlined above for determining intrinsic value of the subsidiary are admittedly fanciful. Without the MJNA repurchase program, FCLS may be worth far less than anticipated. My guess is MJNA is banking on the fact that investors are pushing marijuana stock prices so high, it will have no trouble dumping its holdings on the market to hit its "cash flow" projections.
However, if this plan backfires and the market refuses to pile in, MJNA could be on the hook for misleading investors as to its business outlook for the year.
Moreover, according to one securities law firm, Hamilton & Associates, this practice could result in a DTC chill (sound familiar?) and global lock on the shares, which would make it "impossible for [MJNA] to establish liquidity in its securities."
Be this as it may, MJNA investors are faced with a glaring issue in the company having sold off shareholder assets--paid for by market capitalization--to a company it then intends to float under a new ticker on the open market. If the investors push the new company's market cap. above $39.5 million, holders of MJNA shares will have been robbed of significant potential value. This begs the question:
Why is MJNA disposing of its golden goose (PhytoSPHERE) at a discount, only to buy the golden eggs (CBD oil) back later at inflated prices?
According to those lauding the move, the transaction was undertaken in order to shield MJNA from potential legal action by the Feds. The argument goes that since no board members are shared across the companies, MJNA is not legally bound to CannaVEST, so it is now no longer exposed to the risk of federal prosecution. However, one has to question this line of reasoning when in fact a major shareholder of MJNA in Michael Mona, Jr. is the company's sole member on the Board of Directors. A rose by any other name...
Of course, there are still strong aspects of the company's portfolio that make it very attractive. For instance, the Annual Shareholders Report highlighted the fact that all of its subsidiaries are experiencing healthy growth and will contribute to stronger revenues for the current year. The company's unaudited financials showed a net income of around $7 million on revenues of $12.38 million, clocking its net profit margin for the year of 2012 at 57% with an EPS of 0.8 cents. MJNA shares are currently trading around 0.30 a share, so the TTM P/E registers at 34.11. For a company experiencing such explosive growth, this ratio indicates the market is not willing to pay for the risks.
This is why it is so critical that MJNA come forward to address the concerns raised by the Infitialis article and those listed above.
As an official response has not been forthcoming, and with these issues still hanging overhead, my sentiment regarding the company remains negative due only to the large uncertainty factor involved. However, if MJNA management reaches out with a voice of reason that leaves no doubt regarding the relationship with Michael Llamas and gives answers as to its intentions and the propriety of the CannaVEST transaction, I would most likely turn bullish towards the stock and recommend buying at an appropriate entry point--fully comprehending, of course, the systemic risks involved.
MediSwipe, Inc. (MWIP.OB)
Since initiating coverage of MediSwipe, significantly more information--mainly through press releases--has come to my attention about the company that I believe sheds better light on its operations and business model.
As mentioned in my last article, the company's website leaves much to be desired and has unfortunately proven a misleading indicator as to its level of business activity. MediSwipe appears to rely solely on press releases for dissemination of information pertaining to current operations of the company; a practice that, given the lack of updated financials, undoubtedly raises a few eyebrows.
Over the past couple of months, particularly, MediSwipe has released a flurry of craftily worded PR announcements that many an unsuspecting reader may construe to mean huge improvements in cash flows. The headlines are particularly tricky. For instance,
On January 11, the company announced "$500,000 for Month of December in Elective Medical Procedure Consumer-Related Financing."
On February 21, MediSwipe released another very similarly worded announcement that headlined "Revenues on Over $1,000,000 for Months of January and February in Elective Medical Procedure Consumer-Related Financings."
The issue here is rather obvious: MediSwipe is declaring revenues through these rather sensational pieces without giving any clear indications as to what the revenues actually were. Readers who managed to interpret these headlines correctly are left scratching their heads.
So, what exactly does a personal loan broker make? If mortgage brokerages are any indicator, and taking into consideration a) the higher risk demographic they are pursuing and b) the assumption that, unlike a mortgage, no real collateral is available to the financing terms, we shouldn't expect MWIP's take-away to exceed 0.5% of loan values.
OK, this just sounds too low, right? I mean, the company is emphasizing the millions in financing deals for a reason, so--for argument's sake--let's assume its commission rate is even as high as 5%. In this scenario, MediSwipe is generating $25,000 a month on the top line from a business that hasn't managed to grow over the stated period. Nothing to call home about, for sure, but certainly better than what we witnessed in Q3.
Perhaps we are being too cynical. The twin announcements do go on to explain that MediSwipe considers itself positioned to become "the 'LendingTree' for the elective surgery industry," and that the company's banking and financing network enables it to approve virtually anyone for financing applicable to a number of elective procedures with "an 80% approval rate or better from [sic] more traditional lending sources." The release also notes MediSwipe currently has 3,000 doctors throughout the country participating in the program.
This is great news and all, but I would like to know what this has to do with secure merchant transaction and patient identification systems--you know, the stated core competencies of the company. It may be the case the company is hoping to up-sell its other solutions, or perhaps it is simply in need of cash and is going after some low-hanging fruit. Whichever it turns out, there is no obvious moat here for MediSwipe, so I am inclined to evaluate this aspect of the business with far more skepticism than its core operations.
With that out of the way, let's turn our attention to the next bit of news more germane to the MediSwipe story of more interest to us.
On Feb. 5, the company announced "new orders of 5,000 plus digital patient cards for Michigan medical dispensaries in conjunction with (3) MediPayment Kiosks." Now this is more like it.
The importance of MediSwipe's role in this particular segment is understood better when we take into consideration two key factors.
First, on Feb. 19, Michigan introduced proposed legislation in the form of House Bill 4271 that outlines new requirements for the state's medical marijuana program. The bill suggests "a secure patient identification system" that apparently falls right in line with the HIPAA compliant solutions MediSwipe has exclusive distribution rights to. If MediSwipe positions itself correctly, it stands to benefit greatly from the new legislation in that it will be the only solution tailored to the dispensary market that meets the strict patient identification and data security requirements of the bill.
Second, Michigan's bill is said to embody conventions other state governmental bodies may take into serious consideration when codifying their own new medical marijuana laws. Given the nature of the industry and its history of operating in the shadows, governments will demand high levels of visibility into all aspects of product distribution. Cloud-based patient identity systems like those offered by MediSwipe could help streamline medical marijuana dispensary compliance and lower the barrier of entry for those looking to set up shop.
It does appear that MediSwipe is very active and has started to gain some traction in the MMJ market, but for the time being I reiterate my negative sentiment on the company for the following reasons:
Owners are disposing of shares. Recent filings have revealed that in the past two months alone, 2 million shares were issued to Venture Equity LLC, who immediately sold 400K, and the CEO parted with 2,575,000 shares at the height of the market price for the stock. This is abnormal behavior for a startup of this size and typically points to deficiencies in cash flow. This may also prove the driving factor behind the company's frequent and overzealous IR releases.
The stark reality remains that cannabis dispensary credit and debit transactions are impossible at present, which has proven a poison pill to a core component of the MWIP business model. Until this is settled, the company will continue to scramble for other sources of operating cash.
It may be that things improve with their exposure to the HIPAA compliant patient identification market, however, so I will keep a watchful eye on their progress here.
Without access to MediSwipe's Q4 results, it is impossible to determine fair value for the company. Even with the latest drop, MWIP's market cap. sits at $32 million--a significantly high number for black box financials.
Now for our expanded coverage of the industry.
Tranzbyte Corporation (ERBB.PK)
According to Tranzbyte's corporate profile, the company "attracts established and early growth businesses seeking to take advantage of resources not generally available to private companies through the public capital markets." The concept behind its business is to acquire these entities with the purpose of transforming them into "fully-reporting, publicly-traded, bulletin board companies," in a sense acting as an OTC reverse merger mill--only, it doesn't appear it has actually done this beyond its own company.
Business Analysis
Though not mentioned on the site, Tranzbyte evidently started out 10 years ago as a developer of audio and video disc digital-enhancement technologies. Something extremely important to note here is that Tranzbyte declares the IP associated with these outdated technologies on the balance sheet valued at a post-amortization $500K, or more than half of total "assets." (More on this later.)
What follows is a breakdown of the subsidiaries and business ventures listed in the company's most recent filings.
Altitude Organic Medicine
In February of 2011, the company acquired Altitude Organic Licensing Corporation and its subsidiaries (namely Altitude Organic Medicine) for $80,000. Altitude Organic Medicine is a medical marijuana dispensary "franchise" founded out of Denver, CO in 2009, and though the Tranzbyte website states "the company has operated in California, Colorado, and Arizona," it apparently has only one location in Denver.
Proxima RF Technologies
In addition to the Altitude Organic holdings, in January of last year, Tranzbyte acquired a company by the name of Proxima RF Technology Corp. for 6,500,000 Preferred Series C shares of the company at a par value of $1 per share, which the company has agreed to "use [their] best efforts to repurchase and retire ... during 2012," however no shares have been retired to date.
Proxima RF Technologies specializes in the development of RFID readers and reader modules for 13.56 MHz passive and RFID enabled sensor tags. These technologies have a wide range of applications, with the more relevant being inventory tracking systems. It is not clear if Proxima RF has engineered the core silicon in its readers, or if it is simply creating modules with OTS RFID components, such as those from Sony Corporation (SNE).
The company's December 2012 Quarterly Information and Disclosure Statement discloses that Proxima RF products "are currently being tested and deployed in several national grocery retail stores and restaurants, as well as state utility commissions," and goes on to explain the subsidiary is "engaged with a Value Added Reseller in providing RFID reader, sensor tags and data loggers to the United States Army Blood Services Program in a demonstration project." The disclosure also states that the company is holding "promising early discussion[s] with Panasonic regarding use of ProximaRF's mobile data logging solutions in its medical supply division."
More related to our industry of interest, the company mentions ongoing developing of what it terms "The Integrity Tag," an RFID-based tracking system for cannabis inventory that will give law enforcement better visibility into the distribution of the regulated substance; promising, given the measures states may take to monitor cannabis distribution, as outlined in the MWIP section above.
Interestingly enough, I am very familiar with RFID technologies and the market in general and can share with authority that the space is crowded, to say the least. With nothing particularly unique on offer, it is not easy to conclude to what degree the subsidiary represents long-term value for ERBB shareholders. It should be noted, however, that product development of this nature is both time and cash intensive.
In fact, it appears the subsidiary is facing operating cash deficiencies. Per the disclosure statement, "The company is seeking additional resources to finance the delivery of existing contracts, to continue new product design and development activities such as work on The Integrity Tag, and to focus on aggressive marketing and sales activities." This should be interpreted as a forewarning of further dilution.
Hurricane MRI
Tranzbyte has (recently?) obtained the rights to market Cirrus Open MRI medical imaging devices throughout North and South America for Hurricane Enterprises Ltd., a company that possesses exclusive world-wide distribution rights for the MRI devices. It is not clear why the company has engaged in this industry, and it remains to be seen how it intends to fund the sales organization to realize any benefits therefrom.
Reselling MRI technology is a capital intensive business that requires a highly qualified and well connected sales force. The company currently has no cash on the books, so retaining key personnel is going to be nigh on impossible. This makes it difficult to believe Tranzbyte will be capable of generating significant shareholder value from these efforts.
Panpacific International
Lastly, Tranzbyte entered into a joint venture production agreement in May of 2010 with a company by the name of Panpacific Business Limited, whereby it was to receive "50% of the profits in three scheduled concerts with internationally known artists to be performed in Hong Kong, and other agreed-upon joint enterprises, for 60 million restricted common shares valued at $2,400,000." The narrative found in Tranzbyte's annual report explaining this joint venture weaves through a complex set of transactions related to the deal that results in the company owning only 5% of a jointly formed entity on a cost basis of $480,000 (this is an important number, so keep it in mind).
I couldn't be bothered to untangle the mess to determine how much actual value was created for the company out of this deal, so I will leave it up to the reader if you are so inclined. I do suspect, however, due to the very convoluted manner in which the deal was presented without any concrete revenue numbers, it lost money on the investment. Anyway, with no cash flows from the JV mentioned in the financial report, it has at least proven immaterial to the company's current profitability.
On the whole, the company appears all over the chart, and one would be hard-pressed to come away with the impression that it has a business model that is built to last. I also feel its lack of success speaks for itself.
Financial Analysis
Out of all the businesses so far covered, I have to share that Tranzbyte gets the trophy for keeping an insolvent company trading on the open market.
The company has reported zero, yes zero, revenue for the last six months and only $21,023 for the six months prior. Losses for the same period tallied in at $378K.
Frankly speaking, Tranzbyte is blatantly ripping shareholders and investors off. The company has a long laundry list of debentures and stock issues that anyone with a right mind would know to steer clear of. As of its recent filing, the company holds liabilities in excess of $3.5 million and claims to have assets of $1 million; however, the stated assets are non-existent. The IP mentioned above is worthless, and it continues to account for the $480K from the Panpacific deal on the balance sheet; good luck laying claim to that in court.
Recommended Investment Strategy (Avoid; Strong Sell)
ERBB is a ticking time-bomb with an insanely high market cap. of $15 million. Unless circumstances drastically change, I fear anyone currently holding this company's shares will more than likely lose their entire investment. It is truly a miracle that OTC Markets Group has allowed this insolvent company to continue stealing money from the public.
(I really hate having to report things of this nature, but the truth is there for everyone to see. I just wonder why nobody has bothered to pay attention.)
Rapid Fire Marketing, Inc. (RFMK.PK)
Rapid Fire Marketing, Inc. is a holding company engaged in the development, marketing and distribution of portable vaporizers of smaller, discrete form-factors for "smokeless" consumption of tobacco, cannabis and other herb-derived oils. At the core of the holding company, RFMK develops the Vapor Inhaler, which is the base technology used in its subsidiaries' products, like the CANNAcig and Cumulus vaporizers.
For those who are not familiar with the concept, vaporization is the process of inducing a phase transition of a substance (i.e., from liquid to gas) through evaporation, sublimation or boiling. In the context of cannabis, vaporizers utilize conduction or convection to achieve evaporation of the active compounds (THC, CBD, etc.) in the cannabis plant material, releasing them for smokeless inhalation.
Vaporization is a great alternative to the traditional means of consuming marijuana; it is both more efficient at extracting the active compounds from buds or infused oils and healthier for users, as the method avoids most of the toxic or even carcinogenic byproducts of plant matter combustion during smoking. Early iterations of vaporizer products were bulky, required access to an electrical outlet and tended to run hotter as a result of the vaporization methods used.
With the advent of more compact and efficient battery technologies and sophisticated vaporization techniques, vaporizer manufacturers have been able to create pen-sized units that vaporize cannibinoid-infused oils (concentrates) or waxes, allowing for more discrete usage of the product. This is possible because the units also do not release any of the odors or second-hand smoke associated with traditional consumption methods.[1]
Interestingly, in addition to the core vaporizer business, RFMK, through its fully-owned subsidiary Medical Cannabis Management (MCM), is putting resources towards developing a media and public relations engine focused on heightening general awareness of the entrepreneurial spirit behind cannabis companies. It seems to be at a very early stage, but, the company has managed to sign on the flamboyant and outspoken marijuana activist Cheryl Shuman as its general spokesperson and has given her oversight of MCM development. It will be very interesting to see where this goes.
Business Analysis
At the present time, RFMK relies on a 3rd party outsource firm by the name of HexCorp, Inc. for the development and manufacturing of Vapor Inhaler based products. On August 28, 2012 it announced a non-compete with HexCorp, insuring protection of the technologies proprietary to RFMK and staving off the threat of any potential knock-off products entering the market. However, it is not readily apparent whether or not the technology behind Vapor Inhaler is included in what is defined proprietary, and to date no known patents have been filed or are owned by the company.
With this being said, there is some debate as to what exactly the Vapor Inhaler is and if it really delivers on the company's promises. Some argue that RMFK, like many companies with similar products, has simply repurposed the common 510 model e-cig for use with THC concentrates, and that such repurposing without truly redesigning the heating element and chamber for such use negatively impacts product lifespan and user experience. Others have given rather positive reviews, rebutting naysayers claims with detailed accounts of confirmative personal experiences with the devices.
Perhaps lackluster uptake of the device is why the CEO, Tom Allinder, indicated in the company's most recent press release that due to "huge" market demand for dry herb (as opposed to concentrates) vaporization products, in lieu of its next shipment of Cumulus and CANNAcig vapor inhalers from HexCorp, RFMK is in the process of readying a next generation product that will address the niche. It was also mentioned in the release that the new unit (yet to be named) "will be made from scratch which [RFMK] will file a patent for." This marks a new phase for the company, where it will embark on a journey to create its own line of products, possibly securing a better competitive position in the market.
It should be noted here that the market is saturated with many competing devices. Vaporization technologies can literally be traced back to ancient history, so gaining an edge on competitors would require quite a bit of ingenuity. At this point, it may be too early in the race to tell if RFMK have the winning horse. With that said, we can look to another factor that will most likely serve as an appropriate indicator as to the popularity of RFMK's products: revenue. Let's have a peek inside the books.
Financial Analysis
The most recent (unaudited) Quarterly Report for Rapid Fire Marketing, Inc. was filed for Q3 on Nov. 7th. The company managed turnover of $25K on a cost basis of $14K, giving it a gross margin of 44%. RFMK managed to burn (or um...vaporize) $170K in the same period, reducing cash on hand to $24K, and this after significant increases to paid-in capital. Net losses for the past three quarters have amounted to $431K, and the company lists total assets at $324K against current liabilities of zero.
The company, like most of the others in the group, has relied heavily on share issues for operating capital. In the nine months leading up to the filing, the company issued no less than 439 million shares (almost doubling total outstanding) of common stock and 8 million of Series A preferreds.
In June of last year, the CEO provided an update to shareholders regarding the company's sudden plunge in share price, wherein he explained RFMK's need to replenish working capital for the purpose of getting it to "fully reporting status." At that time, it was shared the process would take 3~6 months and that the company was undergoing an audit for the filing in order to gain access to "better funding." In fact, it was announced on September 25 that the company managed to secure $2.2 million from Ironridge Consumer Co. for an undisclosed percentage. It is believed this cash injection should give the company much needed tailwinds to carry it into the next phase of its growth.
On February 28, the company released another update in which the CEO informed investors the 10-K would be further delayed due to the need to recenter the audited financials around the two-year period of 2011 and 2012. This was due to the fact that "2010 was too much of a challenge to complete due to changes in previous management." However, the CEO reassured investors the process would be completed "within 60 days."
Recommended Investment Strategy (Watch : Hold)
Even though competition in the market is strong, done properly, RFMK could possibly brand itself as the go-to source for high-end, quality vaporizers. In that vein, and going on the company's rapid fire press releases, it does seem to be garnering some traction of late for its products, having announced various distribution contracts and increased orders.
Additionally, with the help of its spokesperson, Cheryl Shuman, the company has managed significant press coverage, and having a segment with Tomy Chong puffing away at its CANNAcig is definitely cause for confidence the brand will get stronger recognition amongst the diehard cannabis crowd.
However, it is just not possible at this time to determine fair value without updated financials or any verifiable indication of top-line growth. Having said this, one important difference between this company and most others in the sector is it has a relatively small market cap at $3 million. With the backing of venture capital--though this does mean dilution to a currently unknown degree-- if the company were to evidence any amount of solid income growth over the next few quarters, the upside potential of this stock could be significant.
Conclusion
We are without a doubt in the midst of a socioeconomic revolution of epic proportions, and it is no secret those looking to jump in early face significant risks of loss due to immaturity of the participating companies, general lack of transparency and, once legalized at the federal level, the possible threat of well-moneyed corporations swooping in to steal what little slice of pie these smaller players currently enjoy.
This being said, I truly believe that many a millionaire will be minted from the group of individuals who approach the sector with a proper level of sagacity and unwavering patience.
Until next time, happy Seeking Alpha!
Article Notes:
For those interested in reading more about the process and benefits, check out this overview provided by HIGH TIMES.
Additional disclosure: I trade in and out of these stocks on any given day. I am not committed to any position with either a long or short sentiment.
<<<
Cereplast -- >>> Cereplast Announces Algaeplast(TM), Inc
Cereplast to Channel All Its Breakthrough Algae Activity in a New Subsidiary
Press Release: Cereplast, Inc.
Feb 20, 2013
http://finance.yahoo.com/news/cereplast-announces-algaeplast-tm-inc-130000504.html
EL SEGUNDO, Calif., Feb. 20, 2013 (GLOBE NEWSWIRE) -- Cereplast, Inc. (CERP) (the "Company"), a leading manufacturer of proprietary biobased, compostable and sustainable bioplastics, today announced the incorporation of a new wholly owned subsidiary, Algaeplast(TM), Inc. Algaeplast' s focus will be the development and manufacture of algae-based bioplastics. Cereplast has been a pioneer in algae-based plastics, helping to bring the first products made from Cereplast Algae Bioplastics(TM) grades to market in 2011, and with the recent commercialization of Biopropylene(R) 109D in December of 2012.
Cereplast introduced the concept in late 2009, with a target of reaching a bioplastic made from 50% algae bio-content. Algaeplast's ultimate goal is to bring to market new polymers made from 100% algae content. Recently, the Company commercialized small quantities of Biopropylene 109D, a compound with 20% post-industrial algae biomatter. The research and development team is currently developing a grade with a higher percentage of algae bio-content. Based on customer interest, the Company has determined that the demand for bioplastics made from algae is significant, and therefore has created Algaeplast, which will focus on this new sector. Algaeplast has been created to develop a new monomer and polymers made from algae.
Mr. Frederic Scheer, Chairman and CEO of Cereplast, stated, "With recent developments made in the algae-to-oil process, the company believes it will reach its goal within less than 5 years, either solely or in partnership with other significant players in the field."
Recently, Cereplast announced that it uses a post-industrial process that significantly reduces the odor that is normally inherent to algae biomatter, eliminating customer concerns about working with the material. Additionally, the Company uses algae biomass byproducts from algae biofuels and nutritionals that do not rely on the commercialization of biofuel production. These advancements fostered the commercialization of the Cereplast Algae Bioplastics product line earlier than expected.
Mr. Scheer added, "We began developing algae-based bioplastics in 2008, have made several breakthroughs since, and are very close to reaching our original goal of 50% algae bio-content. We continue to receive a lot of interest in this material for a variety of applications and are committed to further developing this new category of plastic. We foresee significant revenue potential. The next frontier for Algaeplast is to generate new polymers that are made with 100% algae bio-content, and based on our current level of knowledge, we anticipate reaching that goal within the next five years. The first milestone will be to increase the level of algae bio-content from 20% post-industrial algae biomatter to 50%, and this next step is imminent. Achieving these goals will require additional research, development and partnerships, and we have a very clear understanding of what needs to be done to reach this goal. As such, we felt that it was important to segregate this activity from the development of our starch-based bioplastic grades, and create Algaeplast."
About Cereplast, Inc.
Cereplast, Inc. (CERP) designs and manufactures proprietary biobased, sustainable bioplastics which are used as substitutes for traditional plastics in all major converting processes - such as injection molding, thermoforming, blow molding and extrusions - at a pricing structure that is competitive with traditional plastics. On the cutting-edge of biobased plastic material development, Cereplast now offers resins to meet a variety of customer demands. Cereplast Compostables(R) resins are ideally suited for single-use applications where high biobased content and compostability are advantageous, especially in the food service industry. Cereplast Sustainables(R) resins combine high biobased content with the durability and endurance of traditional plastic, making them ideal for applications in industries such as automotive, consumer electronics and packaging. Learn more at www.cereplast.com. You may also visit the Cereplast social networking pages at Facebook.com/Cereplast, Twitter.com/Cereplast and Youtube.com/Cereplastinc.
<<<
>>> Why 3 Marijuana Sympathy Plays Could Follow In The Footsteps Of Medical Marijuana, Inc. And Drop By 28%
February 6, 2013
by: Fraud Research Institute
http://seekingalpha.com/article/1159931-why-3-marijuana-sympathy-plays-could-follow-in-the-footsteps-of-medical-marijuana-inc-and-drop-by-28?source=yahoo
Influential economist Benjamin Graham once said, "Most of the time common stocks are subject to irrational and excessive price fluctuations in both directions as the consequence of the ingrained tendency of most people to speculate or gamble ... to give way to hope, fear and greed."
The Fraud Research Institute believes that Wall Street's best example of this irrational behavior at the moment is a basket of small cap public companies doing business in the marijuana sector. Specifically, our research into the 4 most actively traded marijuana stocks in the OTC markets leads us to believe that Medical Marijuana, Inc. (MJNA.PK) is the leader of the peer group and that most price fluctuations among the other 3 stocks mimic the recent behavior of MJNA.PK because they are merely sympathy plays.
The purpose of this research report is to determine (1) whether these marijuana stocks are just beginning to heat up or perhaps it is a case of dumb money chasing wildly overvalued stocks and (2) whether these recent fluctuations are a result of fundamental changes from within the actual companies or perhaps these high-flying marijuana stocks are indeed a great spectacle of the irrational and excessive price fluctuations described in the Benjamin Graham quote.
Peer Group Comparison - The Companies
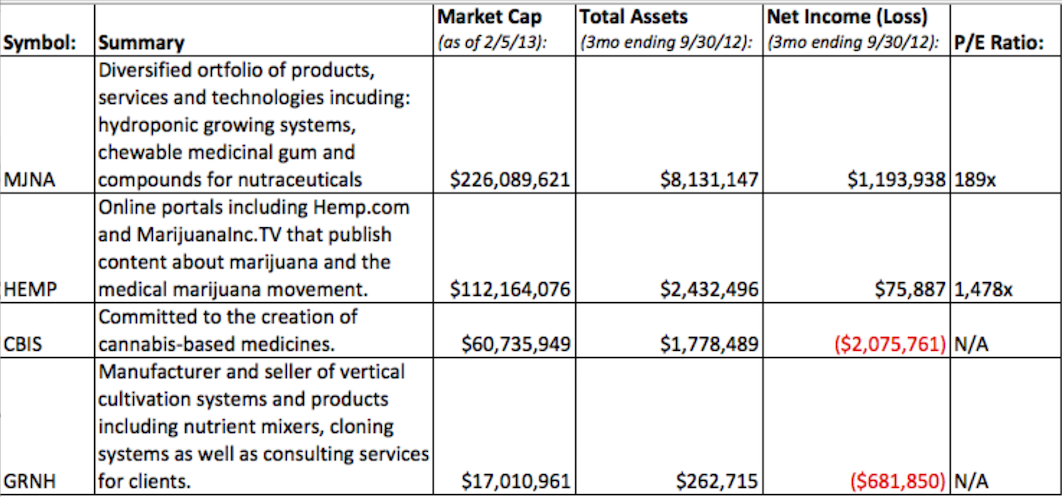
Our peer group of small cap marijuana stocks consists of:
Medical Marijuana, Inc.
Hemp, Inc. (HEMP.PK)
Cannabis Science, Inc. (CBIS.OB)
GreenGro Technologies, Inc. (GRNH.PK)
All four of these marijuana stocks are very different. Perhaps the most significant difference is the fact that all four marijuana stocks operate very different business models that range everywhere from a diversified portfolio of wholly-owned products and services to a startup online portal focusing on the publication of marijuana-related content through sites such as Hemp.com. Only two of the four public companies are profitable with market caps exceeding $100,000,000 dollars.
Perhaps the only similarity among all four stocks is that they all trade at outrageously high valuations. Setting aside all speculation about the rapidly changing external business environments for medical marijuana companies, there have been zero material developments related to any of these companies' internal operations that are expected to have a material impact on fundamentals.
It is our opinion that any arguments made by proponents of marijuana stocks that attempt to rationalize a 100% or 200% increase in a company's market capitalization solely based on the rapidly changing external business environment are sheer nonsense.
Although these four companies are technically in the same sector, they are all completely different businesses and have very different intrinsic values. Despite the fact that these four companies have very different operations and long-term objectives, it is astounding to compare the short-term price fluctuations for these four stocks.
The Fundamentals
By now we have established the unusually direct correlation between each stock's trading activity despite how different each of these companies are. It is our opinion that this is a result of the Peer Leader / Sympathy Stock dynamic whereby the fluctuations of MJNA's stock have an effect on the trading patterns of the other stocks.
Despite all of our findings, the most important question has not been answered - are there any lucrative opportunities to profit from this irrational and inefficient volatility among small cap marijuana stocks?
In our opinion a very lucrative opportunity exists if MJNA continues to show weakness: short selling shares of Hemp, Inc.
First, we believe that HEMP has the weakest balance sheet among the marijuana stocks with market caps exceeding $100,000,000. Of the $2,421,496 total assets listed on the balance sheet over 90% of all assets consist of software. The largest asset on HEMP's balance sheet is LPO Software. We have been unable to determine how the company arrived at the $1.8M valuation for their Legal Processing Software and because the stock trades on the pink sheets that question may never be answered. Regardless, Legal Process Outsourcing ("LPO") software is increasingly common with a growing number of competitors and until we are able to learn from the management team how this LPO software is valued we will remain skeptical.
HEMP has less than $300 cash on hand and hard, tangible assets make up a very small percentage of total assets.
Regarding the income statement for Hemp, Inc., the primary source of over 95% of revenues come from Stock Sales. Again, because HEMP trades on the pink sheets it is very difficult to get a definitive answer on what this entails but it raises some big question marks from members of our research team.
After digging into the financial statements of all four marijuana stocks we hold a very strong opinion that HEMP has the weakest balance sheet and operational results relative to the lofty $112,000,000 dollar market cap and it is for this reason we believe that HEMP is by far the most overvalued marijuana stock of the peer group and therefore may be a lucrative opportunity for short-biased traders.
Conclusion
Small cap marijuana stocks have been some of the most volatile and actively traded stocks in the OTC markets. While they have made triple-digit gains over the course of the last few trading sessions, MJNA.PK fell by 28% on Tuesday, February 5, 2013 and we believe this could mark the beginning of the end for all four marijuana stocks discussed in this research report.
Our belief that MJNA.PK's 28% drop marks the beginning of the end is based largely on the actual reason why these stocks are moving - irrational fluctuations driven by greed as traders chase the marijuana sympathy stocks to hyper inflated prices. The three sympathy stocks will follow the movements of the peer group leader, including yesterday's 28% drop by MJNA.PK.
It is difficult to explain the current movements in the small cap marijuana sector better than Benjamin Graham did with his quote at the very beginning of this research report. Recent price fluctuations can be completely attributed to people's ingrained tendency to gamble and therefore investors considering any of these small cap marijuana stocks should exercise extreme caution.
<<<
Cereplast -- >>> Cereplast Provides Shareholder Update on Italian Application Decree & Announces $300,000 in New Revenue
Feb 5, 2013
Press Release: Cereplast
http://finance.yahoo.com/news/cereplast-provides-shareholder-italian-application-130000122.html
EL SEGUNDO, Calif., Feb. 5, 2013 (GLOBE NEWSWIRE) -- Cereplast, Inc. (CERP) (the "Company"), a leading manufacturer of proprietary biobased, compostable and sustainable bioplastics, generated approximately $300,000 in new revenue during the last two weeks of January 2013. These orders received are in addition to the $500,000 of new revenue that was announced on January 23, 2013.
The Italian Application Decree, which mandates that companies discontinue the use of traditional plastic bags in favor of bioplastic bags or other alternatives, continues to drive demand for the Cereplast Compostables(R) blown film grades. The new orders were fulfilled utilizing existing inventory and were paid in advance of shipment or within conservative credit terms.
The next important milestone will be the formal publication of the Italian Application Decree, which is expected to increase the demand for bioplastic film. Cereplast blown film resins are part of a very limited, proprietary and select type of resin that are able to serve the Italian market for bioplastic blown film. According to European Plastics News, the European market volume for flexible packaging is approximately 3.6 million tons, which is worth approximately EURO20 billion. Italy represents 25% of this market volume at approximately 900,000 tons per year. Although all applications will not be transferred to bioplastic, Italy could become the largest market for bioplastic film applications in 2013 with potential industry revenues of several hundred million euros.
"The Italian market for bioplastic blown film is once again gaining momentum," stated Cereplast Chairman and CEO, Mr. Frederic Scheer. "As a result of government legislation and mandates being passed down by the Italian parliament, the sales trend is continuing. We anticipate demand from this key region to approach similar sales volumes that we experienced in 2011. We are encouraged by the sales data we are analyzing, which is pointing to a strong 2013."
About Cereplast, Inc.
Cereplast, Inc. (CERP) designs and manufactures proprietary biobased, sustainable bioplastics which are used as substitutes for traditional plastics in all major converting processes - such as injection molding, thermoforming, blow molding and extrusions - at a pricing structure that is competitive with traditional plastics. On the cutting-edge of biobased plastic material development, Cereplast now offers resins to meet a variety of customer demands. Cereplast Compostables(R) resins are ideally suited for single-use applications where high biobased content and compostability are advantageous, especially in the food service industry. Cereplast Sustainables(R) resins combine high biobased content with the durability and endurance of traditional plastic, making them ideal for applications in industries such as automotive, consumer electronics and packaging. Learn more at www.cereplast.com. You may also visit the Cereplast social networking pages at Facebook.com/Cereplast, Twitter.com/Cereplast and Youtube.com/Cereplastinc.
<<<
Pot Sector -- >>> Marijuana May Be The Next Big Growth Sector In The U.S. Stock Market
December 17, 2012
by: Elite E Services
includes: CBIS.OB, MDBX.PK, MJNA.PK, PM, RAI
http://seekingalpha.com/article/1067361-marijuana-may-be-the-next-big-growth-sector-in-the-u-s-stock-market?source=yahoo
We've all seen in the news US states such as Colorado legalizing and making marijuana smoking legal.
Public support for further legalization is building. There is also talk that more states could soon legalize. Since this is a new growth industry, we can only speculate in what direction it will grow. But what's clear, plans to keep Marijuana illegal have gone up in smoke.
Marijuana History in the United States
Cannabis was made illegal in the US in 1937 with the passing of the Marihuana Tax Act of 1937. Before the 20th century, Cannabis was widely used both for industrial and recreational purpose with little social stigmas.
Pot smokers have widely referenced that our founding fathers, such as Thomas Jefferson and George Washintgon were active growers and smokers, and that the constitution of the United States was originally written on hemp paper. In Virginia in the 18th century, hemp was promoted as a Tobacco alternative for farmers who worried about Tobacco's soil depletion and less industrial use than hemp.
Some parties have argued that the aim of the Act was to reduce the size of the hemp industry[7][8][9] largely as an effort of businessmen Andrew Mellon, Randolph Hearst, and the Du Pont family.[7][9] The same parties have argued that with the invention of the decorticator, hemp had became a very cheap substitute for the paper pulp that was used in the newspaper industry.[7][10] These parties argue that Hearst felt that this was a threat to his extensive timber holdings. Mellon, Secretary of the Treasury and the wealthiest man in America, had invested heavily in the Du Pont family's new synthetic fiber, nylon, a fiber that was competing with hemp.[7]
That fits the irrationality of such an act, where it was growing in popularity both socially and industrially. A long time has passed and recently, there is growing social pressure to legalize and regulate this wonderful plant.
What legalization means for businesses
So far state regulations have varied, each with different rules how to regulate Cannabis. Colorado's is the most interesting, with components such as requiring a certain amount of the plant sold to be grown in licensed facilities in the state. This differs from California's rule which doesn't specify where it should be grown.
A series of new business in this niche are emerging from the cultivation and growing of the plant, the sale and distribution such as dispenseries, and niche businesses such as Cannabis restaurants.
Publicly traded companies
Medbox (MDBX.PK) - Medbox Inc. (Medbox) offers a machine that dispenses medication to individuals based on biometric identification (fingerprint sample). The machine allows pharmacies, hospitals, doctors' offices, and alternative medicine clinics to manage employee possession of sensitive drugs. The system also allows these clinics to demonstrate that the user visiting the machine is a registered patient and that the patient has a valid and unexpired authorization from a physician to possess and use the medicine dispensed. It has national and international presence with offices in Los Angeles, New York, Toronto, London and Tokyo. Medbox, through its subsidiaries, offers consulting services to the alternative medicine industry, as well as to the mini self-storage market. It provides consulting services primarily to individuals and groups seeking to establish new clinics and facilities, often in jurisdictions that have recently passed legislation concerning the availability of alternative medicines.
Medical Marijuana Inc. (MJNA.PK) - Medical Marijuana Inc. ("MJNA") is the first publicly held company vested in the medical marijuana and industrial hemp markets. The company is comprised of a diversified portfolio of products, services, technology and businesses solely focused on the cannabis and hemp industries. These products range from patented and proprietary based cannabinoid products, to whole plant or isolated high value extracts specifically manufactured and formulated for the pharmaceutical, nutraceutical and cosmeceutical industries.
Cannabis Science, Inc. (CBIS.OB) - Cannabis Science, Inc., is a development-stage company. The Company is engaged in the creation of cannabis-based medicines, both with and without psychoactive properties, to treat disease and the symptoms of disease, as well as for general health maintenance. The Company is engaged in medical marijuana research and development. On February 9, 2012, the Company acquired GGECO University, Inc. (GGECO). On March 21, 2012, the Company acquired Cannabis Consulting Inc. (CCI Group).
These are some of the industry upstarts - there are others. However, the play here may be with more traditional names.
Industry figures
CNBC estimates that the Marijuana industry is a $40 Billion dollar a year business, which is slightly less than American's spend on their pets. However some estimates say that it's over $120 Billion a year, making it larger potentially than the Beer market. But is it possible it's even larger?
Although Marijuana is recently being legalized, the science behind it isn't revolutionary or new. Research and Development will not likely yield ground breaking results, as it would in Nanotech or other industries. For this reason, our best is on big Tobacco.
Big Tobacco
RJ Reynolds (RAI) had product designs in previous times when they believed Marijuana to possibly be legalized, in the 70's and 80's. They denied these claims for years, although there were reports of people actually seeing these test products.
The idea that Big Tobacco may become Big Marijuana is being considered by other industry analysts as well.
The problem that the drug industry would have, however, is that marijuana would, at its core, be a commodity item. While this could lead the real benefit to fall to generic drug companies like Israel's Teva Pharmaceuticals (NYSE: TEVA), that may not be as realistic an outcome. For starters, even generics focused companies have been migrating to branded drugs. Secondly, and perhaps more importantly, marijuana is a plant. It needs to be farmed, not created in a lab. The one industry that has a history of dealing with a commodity plant is the tobacco industry.
Companies such as Phillip Morris (PM) and RJ Reynolds may be in a better position to capitalize on this growth industry than startups or big Pharma. Although they do have the problem of continual lawsuits from smokers since the landmark ruling, they may be able to create entire new business models in the new industry. Of course a lot of this is undocumented and is pure speculation. So a good portfolio betting on this new growth industry might combine PM and RAI, with MJNA and CBIS.
Risks involved
Of course, the risk is that there is a trend-reversal, that states considering legalization do not. And there is the possibility of a Federal crackdown, as Marijuana is still illegal on a Federal level. However indications from President Obama imply this is a low risk. He recently said that it shouldn't be the priority of the Federal government to prosecute recreational smokers. Also there are unknown risks, because it's a new industry we don't know what types of backlash might exist. But these are all risks common in any new growth industry, similar risks were seen before the .com boom. Many .com companies failed, but the ones who succeeded such as Amazon (AMZN) and Google (GOOG) have seen eye-popping returns.
Unlike other high growth new industries, the problem the Marijuana industry faces is simply legalization and regulation. It's not questionable if people will use it or not. So the difference between this and other potential high-growth industries is while there are types of risks, the risks are not in the product. Also, we have case studies like Holland showing how legalization can reduce crime, and attract tourists. So the opportunity here may be more viable than with comparable industries such as advanced tech.
<<<
Cereplast - Magna Group paying CERP's interest payments to avoid default -
http://biz.yahoo.com/e/130122/cerp8-k.html
>>> Form 8-K for CEREPLAST INC
22-Jan-2013
Entry into a Material Definitive Agreement
Item 1.01 Entry into a Material Definitive Agreement
Effective January 18, 2013, Cereplast, Inc. (the "Company") entered into a payment agreement dated January 15, 2013 with Magna Group, LLC ("Magna") and the holders of the Company's 7% Convertible Senior Subordinated Notes (the "Notes") issued by the Company in the aggregate principal face amount of $12,500,000 pursuant to the Indenture dated as of May 24, 2011 (the "Indenture") to provide for payment of interest on the Notes which was due on June 1, 2012 and December 1, 2012. The payment agreement also provides for payment of interest which will be due on June 1, 2013. Payments in the agreement will be made by Magna to the Holders in tranches. In connection with the execution of the payment agreement, the holders waived the event of default and agreed to forbear from exercising their rights and remedies under the Indenture with respect to the Company's failure to make interest payments that were due on June 1, 2012 and December 1, 2012.
<<<
Cereplast -- >>> Cereplast Announces $500,000 in New Revenue and Provides 2013 Outlook
http://finance.yahoo.com/news/cereplast-announces-500-000-revenue-130000067.html
EL SEGUNDO, Calif., Jan. 23, 2013 (GLOBE NEWSWIRE) -- Cereplast, Inc. (CERP) (the "Company"), a leading manufacturer of proprietary biobased, compostable and sustainable bioplastics, today is providing a shareholder update and an outlook for 2013. Cereplast has created additional liquidity through the generation of approximately $500,000 in revenue over the last six weeks while continuing to focus on restructuring its operations to further position the Company for growth throughout 2013.
Revenue Generation in Europe, the United States and Asia
In Europe, specifically in Italy, the Italian parliament made a critical vote on December 13, 2012, which confirms the proposed sanctions on companies using traditional plastic bags and mandates a switch to bioplastic or other alternatives 60 days from the publication of the Application Decree. In anticipation of the final Application Decree to be signed, Cereplast has received several orders for blown film resin, which were fulfilled utilizing its existing inventory. All customer payments were received in advance of shipment or within conservative credit terms. The Company expects continued growth in demand for blown film as a result of the anticipated legislation in Italy.
In the United States, Cereplast received several orders for compostable resins that will be used for food service applications. Multiple large food chains have started to embrace the use of compostable material for food service ware items including straws, cups and cutlery, for which Cereplast's resins are in demand. Cereplast has fulfilled these orders and all payments have been received.
Cereplast received several purchase orders from existing clients in India. Management is encouraged by the progress made in India and anticipates their investments in this new market will translate into additional purchase orders and future revenue growth in 2013.
Debt and Indenture
Management announced that our debt holders have waived the event of default, and have agreed to forbear from exercising their rights and remedies under the Indenture with respect to the Company's failure to make interest payments due on June 1, 2012 and December 1, 2012. The Company was successful in arranging a structured investment from an institutional investor, offering a repayment plan to settle both the past due interest balance as well as the coupon due in June 2013. The restructuring provides the Company relief until December 2013.
With respect to the Compass Horizon term loan, an arrangement was completed by which an institutional investor will repay the remaining principal and interest owed under the Term Loan.
Working Capital and Liquidity
To provide the Company with the required working capital to continue operations, approximately $1 million in short term convertible debt and equity financing was completed. In order to maximize these new investments, the Company has enacted an operational restructuring strategy which includes a reduction in operating costs. Additionally, the Company has taken aggressive cost cutting measures, which include a furlough for production employees and a reduction in its worldwide headcount to 17 employees.
In order to improve cash flow, the Company adjusted their sales and shipment policy, requiring payment in advance of shipment and reducing terms to less than 30 days for large domestic companies.
Inventory Recovery from Delinquent Accounts Receivable
Cereplast initiated a systematic strategy to recover their customers' unsold inventories associated with their delinquent Accounts Receivable balances. In September 2012, 22 containers of the Company's Compostable resins were successfully recovered, valued at approximately $2 million. The same strategy will be used to recover available remaining assets across Europe, Italy, Germany and Malta.
Intellectual Property
Management believes that there is tremendous unlocked value within the intellectual property portfolio of the Company. As the industry continues to evolve, management believes that large conglomerates will begin to make further investments. It is therefore critical to continue to protect the Company's intellectual property while continuing key Research and Development projects. In 2012, Cereplast was granted two patents and is prepared to file an additional five patents in the next few weeks covering both families of resins: Cereplast Compostables(R) resins and Cereplast Sustainables(R) resins, including Cereplast Algae Bioplastics(TM).
About Cereplast, Inc.
Cereplast, Inc. (CERP) designs and manufactures proprietary biobased, sustainable bioplastics which are used as substitutes for traditional plastics in all major converting processes - such as injection molding, thermoforming, blow molding and extrusions - at a pricing structure that is competitive with traditional plastics. On the cutting-edge of biobased plastic material development, Cereplast now offers resins to meet a variety of customer demands. Cereplast Compostables(R) resins are ideally suited for single-use applications where high biobased content and compostability are advantageous, especially in the food service industry. Cereplast Sustainables(R) resins combine high biobased content with the durability and endurance of traditional plastic, making them ideal for applications in industries such as automotive, consumer electronics and packaging. Learn more at www.cereplast.com. You may also visit the Cereplast social networking pages at Facebook.com/Cereplast, Twitter.com/Cereplast and Youtube.com/Cereplastinc.
<<<
Ecolab -- >>> Ecolab's Case For Financial Re-engineering
By Bob Chandler
January 7, 2013
http://beta.fool.com/grahamsway/2013/01/07/ecolabs-case-financial-re-engineering/18984/?source=eogyholnk0000001
Ecolab (NYSE: ECL) is a chemical company that historically specialized in cleaning and sanitizing products and services. The company is probably not very well known but could offer an interesting investment opportunity because of a current business transformation via financial re-engineering.
Ecolab, based on mainly its cleaning & sanitizing business, had core 2011 annual revenues of around $6.6 billion. In December 2011 it started its transformation with the highly levered acquisition of Nalco Holding Company.
Nalco, a chemical company specializing in water treatment applications in the manufacturing, energy and hospitality industries, had annual sales of roughly $4.8 billion. Ecolab spent about $6.0 billion for the company using $1.6 billion in cash and issuing 68.3 million shares. The purchase also increased Ecolab's balance sheet leverage substantially by taking on an additional $5.5 billion or so of debt.
Anticipating a tougher environment for its core revenue growth, Ecolab saw that Nalco offered better opportunities. Though adding a significant debt load, the purchase did allow the company to report increased revenues on a current basis by about 76%.
The most important aspect of the acquisition's growth potential seems to be in the operations of the Global Energy Services business segment. This business segment concentrates on oilfield, well service and downstream chemicals. While other business segments showed minimal growth, Ecolab's purchased Global Energy business grew pro forma revenues at close to 20% in the last quarter.
Thanks to the widespread expansion of North American oilfield exploration using hydraulic fracturing, or "fracking," there has been stunning growth throughout the oilfield service industry.
Baker Hughes (NYSE: BHI), an industry leader, has shown revenues increase from $14.4 billion in 2010 to an expected $21.1 billion for 2012. An impressive gain of roughly 47%.
Smaller players like RPC Inc. (NYSE: RES) and C&J Energy Services (NYSE: CJES) have shown even better growth. RPC grew 2010 revenues of $1.1 billion more than 72% to an estimated $1.9 billion in 2012. C&J Energy Services more than quadrupled their sales from $244 million in 2010 to around $1.1 billion in 2012.
Ecolab took full notice of the oil service industry sales boom and furthered their business reorganization with the October 2012 announcement for the acquisition of privately held oil & gas service company Champion Technologies for $2.2 billion, recently reduced to $2.16 billion reflecting the exclusion of some downstream business. This acquisition is expected to add sales of around $1.2 billion, but is also expected to add another $1.7 billion in debt to Ecolab's balance sheet.
The company is clearly putting its growth hopes on becoming a leader in the oil service chemicals industry.
Ecolab's business transformation is a bold but risky move. The leveraged nature of the change could offer significant upside to shareholder value, but history also seems to indicate that the odds of success for these debt-laden acquisition based reorganizations aren't great over the longer term.
Over the near term, Ecolab should continue to advertise the good revenue growth provided by acquisition and management does believe that these purchases will provide financial accretion. However, some of these benefits might already be priced into the stock. The market has recently approached the high end of my somewhat generous fair value estimate, exclusive of the Champion purchase, of $66 to $75 per share.
I'm anticipating that sometime in 2013, Ecolab's case for financial re-engineering may offer an interesting investment opportunity. I'd say that right now the jury is still out on whether the company can beat the odds and build significant shareholder value from this radical transformation. But enough evidence should be disclosed over the next year to make a reasonable judgment on the merits of Ecolab's strategy.
Investors may want to check in with Ecolab periodically. If there is a successful integration with increased growth opportunities in the Energy Services business, the highly levered nature of the acquisition strategy could pay off big. The company would be able to reap the benefits of growing cash flow to fund new ventures as well as pay down the high debt level in a timely manner.
On the other hand, the company could be stuck with a lot of debt, stagnant profitability and limited revenue growth if the expected benefits from the business transformation aren't realized.
Either way, be it on the short or long side, there's a good chance that Ecolab will provide a very interesting investment opportunity over the coming months.
<<<
Ecolab -- >>> Ecolab Closes Quimiproductos Buyout
By Zacks Equity Research
Jan 3, 2013
http://finance.yahoo.com/news/ecolab-closes-quimiproductos-buyout-134855768.html
Ecolab Inc. (ECL), a leading manufacturer of cleaning and sanitation products, has completed its previously announced acquisition of Mexico-based Quimiproductos S.A. de C.V., a wholly-owned subsidiary of leading consumer goods company, Fomento Econ (FMX).
In September last year, Ecolab had announced a definitive agreement to acquire the aforementioned entity. However, the company did not provide any financial details of the transaction.
Quimiproductos produces and supplies cleaning, sanitizing and water treatment goods and services to breweries and beverage companies located in Mexico. It also operates in the Central and South America. In 2012, the company’s revenues are estimated to be $43.4 million.
Ecolab has a significant presence in international markets, with Asia-Pacific and Latin America representing the key growth areas for its overseas operations. Ecolab’s Food and Beverage business in Latin America is growing at a double-digit rate on the back of solid demand in the beverage and brewing markets along with new accounts and investments in strategic sales areas. The company’s Latin American sales jumped 20% in the last reported quarter. We believe that the acquisition of Quimiproductos should further boost the business in the near-term.
St. Paul, Minnesota-based Ecolab serves the foodservice, food and beverage processing, healthcare, and hospitality markets in the U.S. and abroad. We are encouraged by the company’s consistent performance of delivering double-digit earnings growth despite the challenging business environment.
Ecolab is currently involved in the acquisition of a leading specialty chemical company, Champion Technologies and its related company Corsicana Technologies. The deal worth $2.16 billion would be the company’s largest acquisition since the Nalco buyout. The proposed acquisition will beef up Ecolab’s Global Energy Services franchise and expand its foothold in the North American energy market.
The transaction was expected to close by the end of 2012 but due to certain antitrust-related issues with the U.S. Department of Justice (“DOJ”), the company has extended its agreement till February 28.
Despite the impressive international exposure, we remain cautious on Ecolab owing to aggressive competition from the likes of Clorox (CLX) and Church & Dwight (CHD). We currently have a Neutral recommendation on Ecolab, which carries a short-term Zacks #4 Rank (Sell).
<<<
Danaher -- >>> The 10 best stocks in the world
Nov 21, 2012
Kiplinger
http://money.msn.com/investment-advice/the-10-best-stocks-in-the-world-1
Stock symbol: DHR
Danaher was an industrial conglomerate made up of disparate cyclical businesses. In 1990, management decided to restructure the company to make it less sensitive to changes in the economy.
The company turned to designing, manufacturing and marketing professional, medical, industrial and commercial products and services. The wisdom of the strategy proved itself in 2009 as the nation struggled with the recession precipitated by the financial crisis, says Morningstar analyst Daniel Holland. Although revenues of many of its rivals were cut in half that year, Danaher saw its sales drop only about 12% and bounce back nicely in 2010. Revenues and profits have continued to rise by double-digit percentages. Second-quarter profits and sales jumped 31% and 28%, respectively, from the year-earlier period.
Danaher's corporate culture is dedicated to being both innovative and efficient, Holland says. He notes that growth in the Washington, D.C., company is fueled primarily by acquisitions, adding that this is something Danaher does unusually well. Danaher's latest purchase, of Beckman Coulter last year, has not only proved profitable, it has put 40% of the company's sales in the rapidly growing health care sector.
But Holland is most impressed by how well the company has diversified, both geographically and within industries. Cyclical companies usually have a weak spot -- but not Danaher, he says. "There's no one single bullet that can take them down."
About 60% of the company's revenues come from outside the United States, including about 25% from emerging markets.
At about $52 recently, Danaher sells for 16 times estimated 2012 earnings of $3.24 per share. That's a reasonable price for a company that's expected to grow by about 15% per year for many years, Holland says. Besides, he says, Danaher's price-to-earnings ratio always tends to be higher than that of its peers. "When you've got a rare item, it's often expensive."
<<<
Pot Sector -- >>> The 'green rush' is on for marijuana companies
Changes in state pot laws are encouraging some cannabis-related companies to go public.
By Bruce Kennedy
Nov 14, 2012
http://money.msn.com/investment-advice/article.aspx?post=55419f1f-b43b-4c51-847f-0242c46b2a7d
These are heady times for supporters of legalized marijuana as well as those looking to cash in on pot's growing national acceptance. This month, voters in Washington state and Colorado agreed to legalize the recreational use of marijuana for adults. And medical marijuana is currently legal in 18 states and Washington D.C.
Of course, marijuana remains illegal by federal law. But people involved in what some are calling the "green rush" are still looking at business and investment opportunities in cannabis and its production.
And as with nearly all markets, some people are willing to take the risk.
"Think of it as another dot.com explosion," said Bruce Perlowin, CEO of Hemp Inc. (HEMP -6.43%), in a recent press release.
And according to an investor fact sheet for Medical Marijuana Inc. (MJNA +27.78%), the current U.S. medical marijuana industry is estimated at $17 billion, with expectations it could grow up to about $29 billion by 2016.
"It was almost unthinkable 10 years ago that you would have legitimate, fully reporting to the SEC companies that were in the nature of pure plays, with positions in the medical marijuana industry," says Sterling Scott, CEO of Los Angeles-based GrowLife Inc. (PHOT 0.00%), a consortium of companies that sells products for indoor growing.
Scott, a former federal regulatory attorney, estimates there are about 10 cannabis-related companies currently being traded as over-the-counter stocks. Most OTCs are relatively small and often new companies that don't yet meet the requirements to be listed or traded on exchanges like Nasdaq or the New York Stock Exchange.
He breaks down these marijuana sector firms into four groups:
•Established companies, like GrowLife, that sell equipment and expendables for the cannabis industry.
•Companies like Medical Marijuana, whose mission, according to its website, is to become the industry's "premier cannabis and hemp industry innovators."
•Groups like Hemp Inc. that are looking to develop a legal market for the industrial and commercial use of hemp (which contains only trace amounts of marijuana's active ingredient) in products such as paper, oils and cloth.
•Companies focused on the clinical, medical use of cannabis in areas such as cancer, inflammation and pain treatment.
"The safest position during the Gold Rush in California in the 1800s was to sell (miners) the equipment they needed to go out and explore for gold," explains Scott. "Our company has taken a fairly conservative position, as to the kind of things that we can engage in, because of the federal law position. And we intend, until there's a great deal more clarity on the federal side, to continue to be fairly conservative. But that's not true of all these companies."
So are these small stocks worth an investor's time? It depends on how the future plays out for the sector.
"If the new marijuana laws in Colorado and Washington… are a sign of things to come, if you're a firm that can benefit by this industry being created into a legal and viable industry, then if you can get in early enough, then those stocks may go up in value," says Mac Clouse, professor of finance at the University of Denver's Daniels College of Business.
<<<
Rayonier, Plum Creek Timber -- >>> A Fine Time for Timber
By CHRISTOPHER C. WILLIAMS
8-25-12
Barrons
http://online.barrons.com/article/SB50001424053111904881404577601231399336716.html?ru=yahoo&mod=yahoobarrons#articleTabs_article%3D1
A recovery in housing could boost Weyerhaeuser's sales and earnings, and unlock the value of its high-quality timberland and real-estate assets. A REIT with rising payouts.
Money doesn't grow on trees, but a recovery in America's depressed housing market could produce lots of it for timber giant Weyerhaeuser .
Suddenly, signs of a nascent pickup in housing are everywhere, from rising building permits and housing starts to improved sentiment among builders. Add higher lumber prices to the list, along with a powerful liftoff in the shares of home builders such as Toll Brothers (ticker: TOL) and PulteGroup (PHM).
Weyerhaeuser owns some of the best timberland in the U.S., in the Pacific Northwest and the South. The Mount St. Helens Tree Farm is in Washington.
Weyerhaeuser's stock (WY) has been no slouch, either. It shot up 50% in the past year, to a 52-week high of $24.62, and the rally could be in the early innings. The shares, which topped $85 in 2007, look rich at 29 times next year's expected earnings of 85 cents a share, but the P/E ratio is misleading, as it is based on trough earnings.
Headquartered in Federal Way, Wash., Weyerhaeuser is best viewed as an asset play, and its assets are sorely undervalued. The company owns six million acres of timberland, including some of the best properties in the U.S., chiefly old-growth forests in the Pacific Northwest and the South. It also makes wood products and cellulose fibers—Weyerhaeuser is one of the biggest producers of absorbent pulp used in diapers and feminine-hygiene products—and operates a real-estate development company. Some analysts and investors calculate its net asset value at more than $30 a share, or about 30% above the current stock price.
"Weyerhaeuser is a terrific asset play," says Todd Lowenstein of HighMark Capital Management, which owns shares. "You are buying attractive timber and other housing assets that are under-earning and have been mispriced at the bottom of the cycle, for around 70 cents on the dollar."
Moreover, as a timber real-estate investment trust, Weyerhaeser pays a 60-cent dividend and yields 2.4%, with the promise of higher payouts to come. Converting the company to REIT status in 2010 was one of management's savviest financial moves, as earnings from REIT timber harvests are taxed at 15% instead of the 35% tax rate applied to C-corporations. Weyerhaeuser is one of four publicly traded timber REITs, a group that also includes Plum Creek Timber (PCL), Rayonier (RYN), and Potlatch (PCH).
REITs are required to distribute at least 90% of their taxable income to shareholders, and Weyerhaeuser intends to pay out 75% of its funds available for distribution in dividends. Anthony Pettinari, an analyst at Citi Research, thinks the company can raise its dividend 50% by 2014. "The long-term potential to increase the dividend is unmatched in the sector," he wrote in a July 9 report to clients, in which he upgraded his Weyerhaeuser rating to Buy from Neutral.
Although 84% of Weyerhaeuser's revenue is tied to housing, the company is more diversified than its closest rival, Seattle-based Plum Creek. In the second quarter, all four of its operating units turned a profit for the first time in six years, and most improved sequentially from the first quarter, suggesting that Weyerhaeuser is building momentum as housing turns, and could meet analysts' estimates for a double-digit increase in earnings this year, to 38 cents a share.
Close.No one expects Weyerhaeuser to earn, any time soon, the $5.43 a share it reported back in 2004. But Heather McPherson, an associate portfolio manager of T. Rowe Price Mid-Cap Value Fund, says that in a normalized housing market, with housing starts above one million units, the company could net closer to $1.75 a share. Baltimore-based T. Rowe Price Associates is Weyerhaeuser's second-largest institutional investor, behind Capital World Investors, with 36 million, or almost 7% of the outstanding shares.
THE MAJOR RISK FOR WEYERHAEUSER is that the housing recovery stalls. Indeed, some housing skeptics cite a "shadow inventory" of foreclosed homes waiting to come on the market that will keep prices depressed. But Weyerhaeuser officials think the foundation is being laid for a multiyear recovery. "The housing market has bottomed," says Chief Financial Officer Patricia Bedient. "We are seeing signs of a recovery, although it's not V-shaped" in nature.
Citi sees annual housing starts ramping up to one million units by 2014 from an estimated 730,000 this year, although that is below an annual rate of 1.44 million units before the crash. Recent data have been encouraging, with the Commerce Department reporting that building permits rose in July to the highest level in four years, and the National Association of Home Builders citing an uptick in its index of builders' sentiment. Housing starts slipped last month from June's level, to a 746,000 annualized rate, but are up 20% from 2011.
Pettinari sees lumber prices rising further, too, noting his channel checks have revealed that dealers haven't built adequate inventories to meet housing-construction demand. The annualized average price for lumber, he says, could increase to $315 per thousand board feet in 2013 from $300 this year and $272 in 2011.
Driven by higher lumber prices and a double-digit uptick in wood products, Weyerhaeuser could earn 42 cents this year and 95 cents in 2013, Pettinari calculates. He expects revenue to jump to $7.3 billion next year from an estimated $6.7 billion this year.
A HOUSING RECOVERY could help close the gap between Weyerhaeuser's net asset value and its current share price. Peter Shawn, a portfolio manager and director of research at New York-based Tocqueville Asset Management, owner of two million Weyerhaeuser shares, figures Weyerhaeuser could be worth between $28 and $31 a share.
He calculates the company's timberland assets at between $13 billion and $14 billion, based on recent transactions that valued timberland at $2,000 to $2,200 an acre, equal to a 5% yield. Timberland sales generated 23% of the latest quarter's $1.8 billion of revenue, and 47% of its $164 million in earnings from operations.
Shawn estimates that the wood-products business, including non-U.S. timberlands, is worth $2.1 billion, on the assumption that it would trade for six times normalized earnings before interest, taxes, depreciation, and amortization of $350 million. The segment contributes 44% of revenue.
The cellulose-fibers segment, at 26% of revenue, is worth $2 billion, he says, with real estate valued at between $2 billion and $2.5 billion, or 1.2 to 1.6 times book value, a sharp discount to other home builders' price-to-book multiples. Weyerhaeuser Real Estate Company, or Wreco, builds mostly single-family homes and residential lots.
All told, Shawn pegs Weyerhaeuser's net asset value at $16.4 billion, above its current market value of $13 billion. Subtracting corporate expenses of $300 million and net debt of $3.6 billion, and dividing the result by 540 million shares outstanding would yield the aforementioned per-share value of $28 to $31.
GROWING AND HARVESTING timber is a relatively stable business that generates substantial cash. In part, this has made timberland a favorite holding in recent years of endowments, pension funds, and other institutional investors. But many of Weyerhaeuser's end markets are cyclical, and the company has ridden numerous economic cycles in its 112 years. Sales and profits both fell sharply amid the latest downturn in housing.
The Bottom Line
Converting Weyerhaeuser to a real-estate investment trust was a savvy management move. The REIT yields less than competitors, but its dividend could rise by 50%.
After an earlier acquisition spree, Weyerhaeuser sold or otherwise divested underperforming assets, to gain efficiencies and sharpen its focus. The company spun out its fine-papers business in a deal with Canada's Domtar (UFS) in 2006, and later sold its packaging business to International Paper (IP) for $6 billion.
Management, led by company veteran Daniel Fulton, has tried to cut costs, and aims to slice total debt to $3.9 billion by the end of next year, from $4.5 billion now. The company reported cash of $861 million as of June 30.
After the pruning and trimming, Weyerhaeuser is tied even more closely to housing. But that could be a good thing now.
<<<
>>> Our Outlook for Consumer Defensive Stocks
By Erin Lash
Morningstar
Jun 28, 2012
http://finance.yahoo.com/news/outlook-consumer-defensive-stocks-110000043.html
Emerging-markets hype appears likely to persist over the near term, but competition is mounting. Consumer product firms put cash to use for emerging-markets land grab. While further price increases from sin stocks could prop up margins, packaged food firms may be more challenged, as low- to middle-income consumers prove they aren't afraid to hunt for value.
Emerging-Markets Hype Likely to Persist Near-Term, Competition Mounting
Deteriorating economic conditions in Europe, combined with sluggish growth in North America, are challenging consumer product firms. Our expectation is that the competitive landscape in more mature, developed markets, including Europe, will remain intense for the foreseeable future, as consumer product firms battle to garner a larger slice of consumers' reduced discretionary spending. As a result, we think that emerging markets will remain a top growth prospect for consumer staple companies for an extended period, particularly due to their consumers' added wealth and spending power, which is propelling per capita consumption.
Within the global beverage arena, firms such as Coca-Cola(KO), PepsiCo(PEP), Diageo(DEO), SABMiller(SAB), and Heineken(HEIA) are steadily adding capacity and distribution scale in emerging markets such as Asia, Africa, South America, and Eastern Europe. This trend should plant the seeds for future earnings growth. More specifically, we believe that Asia and Africa present the greatest future growth opportunity for Coca-Cola. Whereas the average American consumes over 400 eight-ounce servings of Coca-Cola products (including carbonated soft drinks and still beverages) per year, the average Chinese citizen consumes less than 40 servings, the average Indian just over 10 servings, and the average Nigerian about 30 servings. Globally, the average person consumes about 90 Coca-Cola beverages per year. We believe that Coca-Cola's global volumes are bound to increase, as consumer purchasing power in emerging economies increases over the coming decade.
Even though we expect the growth trajectory of these faster-growing regions to remain head-and-shoulders above developed markets, some softening may be in store. For instance, Estee Lauder's(EL) management took a cautious stance toward macroeconomic conditions in China during its fiscal third-quarter conference call in May, which could indicate that sales growth in one of the firm's fastest-growing regions is likely to slow. We contend that emerging markets will face increased competition as consumer product manufacturers seek the same pockets of opportunity in regions where product categories are growing. As a result, it's possible for growth rates to trend down slightly from the lofty levels of the past few years.
Consumer Product Firms Put Cash to Use for Emerging-Markets Land Grab
With a greater share of the spending shifting to premium brands in emerging markets, consumer product firms have also looked to acquisitions to build out their presence. From our perspective, gaining entry into these regions by acquiring local firms that are familiar with local tastes and preferences is a wise investment. We expect that consumer product firms will continue efforts to further expand in these regions through bolt-on deals. However, with several companies looking to developing markets for expansion opportunities, we caution that valuation multiples could spike to nosebleed levels, making such deals less beneficial.
One of the more notable deals this past quarter was Nestle's (NSRGY) decision to acquire Pfizer's (PFE)infant nutrition business for $11.85 billion in an all-cash deal, which was valued at 5 times fiscal 2012 sales and 19.8 times fiscal 2012 EBITDA. Although the deal makes strategic sense, in our view, the price seems rich, likely reflecting the fact that Nestle wanted to keep this valuable asset out of the hands of competitors such as Danone(BN) and Mead Johnson(MJN).
Nestle's appetite for Pfizer's baby food business makes sense to us. The infant nutrition business is high growth (with Pfizer's unit generating about 85% of sales from faster-growing emerging markets like China) and high margin (with EBITDA margins in the mid-20s). This comes on the heels of Nestle's purchase of a 60% stake in Chinese confectionery manufacturer Hsu Fu Chi, the producer of the popular breakfast bar Sachima, last summer. China--along with other growing Asian economies--is an attractive market for Western manufacturers, whose domestic markets offer very few growth opportunities. This particular growth opportunity is reflected in the rich multiple Nestle is paying. When Nestle sold its stake in Alcon to Novartis(NVS) for $28 billion pretax, we argued that it should invest the cash in extending its footprint in emerging markets.
In addition, General Mills(GIS) is to acquire Yoki Alimentos, a privately held Brazilian food maker whose portfolio of products spans the snack, seasoning, and convenient-meal aisles. The packaged food firm is paying around $850 million for the deal (about 1.6 times sales). That said, because General Mills' business in Brazil only includes the sale of Haagen-Dazs ice cream and Nature Valley snacks currently, we think this deal provides a platform over which it should be able to extend the distribution of its existing brands. Beyond enhancing shareholders' return (through increased dividends and share repurchases), we expect that acquisitions will remain a top priority use of cash for General Mills.
In May, Diageo agreed to purchase Brazil's leading premium cachaca, Ypioca, from Ypioca Agroindustrial Limitada for GBP 300 million. We believe that the deal is a smart move, providing Diageo with a foothold in the premium segment of a local premium spirit and increasing the size of its distribution system in Brazil. Additionally, premium spirit companies such as Beam(BEAM) and Brown-Forman(BF.B) have ample opportunity to continue growing their businesses in emerging markets, as consumers increasingly choose to imbibe premium international spirits.
Price Hikes Could Prop Up Sin-Stock Margins, but Value-Conscious Consumers May Pose Challenges for Packaged Food Firms.
During 2011, many consumer product companies experienced margin compression as pricing failed to keep up with input cost inflation. However, we're now noticing a dichotomy among consumer defensive firms with regard to pricing and profitability. For one, we think that tobacco and alcoholic beverage firms will realize margin expansion as additional price increases should outpace input cost inflation. Conversely, it is likely--in our view--that margins at packaged food and household and personal care firms will remain under pressure, given that consumers have shown a willingness to trade down or out of categories in order to garner the best value for their constrained spending dollars.
For example, Brown-Formanis about to roll out a price increase on its various spirits, including Jack Daniel's, which should help the company expand gross margins and grow earnings per share over the next several quarters. We doubt volumes will be negatively impacted. Spirits companies also benefit from the shift in consumer tastes toward premium brands. Firms such as Diageo, Pernod-Ricard(RI),and Beamare rolling out premium brand extensions carrying higher price points, and heftier margins.
During 2012, we believe tobacco companies will continue to benefit from the pricing power they enjoy, which admittedly stems from a potent mix of powerful brands and an addictive product. However, international tobacco firms Philip Morris International(PM)and British American Tobacco(BTI) have better opportunities for long-term growth, in our view--versus Altria(MO), which markets cigarettes only in the United States--given their substantial exposure to emerging markets. Consequently, we believe that Philip Morris and British American should be able to steadily grow margins and EPS over the medium term, as they continue to gain scale in emerging markets and sell a richer mix of premium tobacco products. For example, during 2011, Philip Morris' cigarette volumes in Asia grew by 11%. This was partially bolstered by increased Japanese demand following the earthquake and tsunami, which negatively impacted Japan Tobacco's capabilities. A 12% increase in average revenue per pack and an improving mix of premium products--combined with a weakening U.S. dollar--contributed to improving the company's top line.
That said, consumers have responded differently to the higher prices that packaged food and household product firms are charging in the grocery store aisle. For instance, similar to other firms throughout the industry, Ralcorp(RAH) has increased prices in order to offset elevated raw-material prices (such as durum wheat and snack nuts), but volume in the most recent quarter was negatively affected, as private-label price increases exceeded branded pricing (particularly in the peanut butter and snack nut categories). In addition, management commented that price realization lagged its expectations, as retailers were reluctant to raise prices on the shelf in light of their view that raw material costs are trending lower.
Additionally, while J.M. Smucker(SJM) has taken significant pricing over the past year to offset commodity costs, it recently announced a 6% reduction in its coffee prices in May. We think this is the right move. Coffee commodities have receded from their highs, and competitive pricing from branded rivals and private labels has challenged Smucker's brands in recent quarters. Still, Smucker's announced price decrease was quickly followed by Kraft's (KFT) decision to lower the price for its Maxwell House coffee brands. The operating environment remains difficult, and competition remains fierce. This will make innovation, acquisitions, and international expansion important growth drivers for firms throughout the space over the short and long term. Even if these costs subside, we further question how well these firms will be able to maintain the significant price increases that they implemented as raw material prices skyrocketed.
We could not deny the importance of brand investments (related to both advertising as well as product innovation) following L'Oreal's (OR) recent analyst day. New products represent 15% to 20% of U.S. revenue annually, and 80% of the productslaunched in North America are specifically developed for the local consumer. Twice a year, L'Oreal's CEO, Jean-Paul Agon, allocates the latest technology to specific brands for use in its products, enabling the firm to differentiate its offerings from competitors while also enhancing the value of its products in the eyes of consumers. In our view, the success of these investments is evident in that L'Oreal has moved away from deep discounting, but has not realized a subsequent decline in sales, as North American revenue increased a healthy 5.5% in fiscal 2011 and 6.6% on a like-for-like basis during the first quarter of 2012. In addition, L'Oreal is realizing measurable share gains, as Maybelline New York now controls 20.5% of the domestic cosmetics market (which is up from 18.1% in 2009), exceeding Cover Girl's 16.8% share.
Our Top Consumer Defensive Picks
Following the recent market volatility, we peg the average price to fair value for our consumer defensive universe at 0.99 (implying the category is essentially fairly valued). There are few outright bargains, though we continue to focus on later-cycle categories such as home improvement, which may strengthen as the recession cycles through. We would become more interested if the market were to trade down another 5% or so, but we are quick to gravitate toward firms with established economic moats, which may be in a better relative position to withstand near-term revenue and operating margin volatility.
In general, we like companies possessing a combination of scale, pricing power in categories where perceived differentiation matters, exposure to emerging markets (particularly China), resources to extend brand reach, and strong dividend growth potential.
Top Consumer Defensive Sector Picks
Data as of 06-18-12.
Kroger(KR)
Star Rating: 4 Stars
Fair Value Estimate: $30.00
Economic Moat: None
Fair Value Uncertainty: Medium
Price/Fair Value: 0.76
Despite trading at higher valuations on a P/E basis than Safeway(SWY) and Supervalu(SVU), we believe Kroger offers investors the best risk/reward profile in the grocery store category, because we see the least relative downside risk to sales, earnings, and cash flows. Kroger continues to not only defend but gain market share, while Supervalu and Safeway have not posted positive identical-store sales (excluding fuel) since 2008. Because of the ability to consistently drive share, Kroger has the best chance among its peers to be left standing to reap the rewards of margin expansion inherent after the industry moves beyond the consolidation phase.
Sysco(SYY)
Star Rating: 4 Stars
Fair Value Estimate: $36.00
Economic Moat: Wide
Fair Value Uncertainty: Medium
Price/Fair Value: 0.81
In our view, the market's concerns regarding sluggish restaurant traffic and food cost inflation are overdone and are unjustly weighing on Sysco's shares. We continue to believe that Sysco's expansive distribution network will enable it to remain the dominant player in the North American foodservice distribution space, generating strong cash flows and outsize returns for shareholders longer-term. In addition, we think the firm's business transformation offers the potential for higher customer retention, the ability to better serve customers, and improved reporting, the combination of which should sustain revenue and limit unnecessary expenses.
Heineken(HEIA)
Star Rating: 4 Stars
Fair Value Estimate: EUR 44.00
Economic Moat: Narrow
Fair Value Uncertainty: Medium
Price/Fair Value: 0.87
Over the past five years, Heineken has been expanding its exposure--both organically, and via acquisitions--in the faster-growing emerging markets of Latin America, Africa, and India. The company's acquisitions typically include strong local brands and solid distribution systems that help to drive increased sales for the company's iconic Heineken beer. Additionally, the company’s TCM 2 cost efficiency program should generate EUR 500 million of savings through 2014. Given the company's emerging-markets potential and narrow economic moat, we believe the shares are currently undervalued.
Campbell Soup(CPB)
Star Rating: 4 Stars
Fair Value Estimate: $36.00
Economic Moat: Wide
Fair Value Uncertainty: Low
Price/Fair Value: 0.89
Although Campbell Soup has been challenged by rampant cost inflation and intense competitive pressures, we contend that the firm is appropriately investing behind its brand. We don't anticipate that these efforts will yield measurable improvements overnight, but overall we believe that the unrivaled scale in its business enables the firm to generate operating margins in the domestic soup segment that far exceed other areas of the consumer products space. While the shares are modestly undervalued, we believe there is limited downside risk for this wide-moat packaged food firm, even with more aggressive competition and rising input costs.
Kraft Foods(KFT)
Star Rating: 4 Stars
Fair Value Estimate: $44.00
Economic Moat: Narrow
Fair Value Uncertainty: Medium
Price/Fair Value: 0.89
We believe that a move to break up Kraft is a value-enhancer, motivated by management's desire to realize a higher multiple for the faster-growing snack business that was being unappreciated when combined with the more mature North American grocery brands. Following the spin-off, investors with an appetite for growth in the packaged-food sector may be interested in the global snack business, while income-seeking investors may want to consider the North American grocery business, as management has said that dividend payments would be a priority for cash. Overall, we contend that the firm's dual focus of 1) investing in its brands, and 2) introducing products that resonate with consumers should ensure that Kraft continues to win at the shelf.
<<<
Donaldson, McCormick, Sigma Aldrich -
>>> 5 up-and-coming blue-chip stars
Kiplinger
6-6-12
http://money.msn.com/investment-advice/5-up-and-coming-blue-chip-stars-kiplinger.aspx
Smaller than the big names you're used to hearing, these midsize companies dominate their industries nonetheless.
When you think of blue-chip stocks, big, brand-name companies such as Coca-Cola (KO 0.00%, news), McDonalds (MCD 0.00%, news) and Johnson & Johnson (JNJ 0.00%, news) come to mind. But John Fox, co-manager of the FAM Value (FAMVX +0.34%, news) fund and director of research at Fenimore Asset Management, the fund's sponsor, unearths what he calls "rising blue chips" -- midsize companies that dominate their industries and have a global reach.
"They're smaller than IBM and Proctor & Gamble, but they're blue chips in a lot of ways," Fox says.
These midsize dynamos share other characteristics with the best blue chips: a proven business, exceptional free cash flow (earnings and depreciation, minus capital expenditures) and skilled managers who use their company's capital to enrich shareholders.
Following are five Fox favorites worth watching. He holds all of them in FAM Value, but he is not adding to his positions at current prices. They're quality companies, but he'd buy on pullbacks.
Donaldson
Market capitalization: $5.5 billion
Percentage of sales from outside the U.S.: 60%
When it comes to air filters, the trucking industry turns to Donaldson (DCI 0.00%, news). The Minneapolis company makes air filters primarily for trucks and industrial equipment, such as tractors and bulldozers, for big-name customers such as Caterpillar (CAT 0.00%, news) and Deere (DE 0.00%, news). The filters, which reduce the pollution released by these vehicles, are also used in mining equipment and gas turbines. Donaldson has a lock on this business, which produces a steady stream of income because filters wear out and need to be replaced regularly.
International expansion is likely to drive Donaldson's growth in the future. The company is building a new manufacturing plant in Mexico, which will help it meet strong demand in Latin America, and it has a number of gas-turbine projects under way in the Middle East and China, not to mention the United States.
Donaldson's earnings increased at a nearly 12% annualized clip over the past five years. They are projected to rise nearly 13% per year over the next three to five years, thanks to strong demand for trucks (many of which use Donaldson filters) in emerging markets. (Company data calculated as of the May 29 close.)
McCormick
Market capitalization: $7.6 billion
Percentage of sales from outside the U.S.: 40%
Open your cabinet and check out the brand name on your spice jars. Chances are good they say McCormick (MKC 0.00%, news).
The Sparks, Md., company controls the largest share of the market for spices and food flavorings, and with anticipated earnings growth of 9% annually, its shares make a tasty investment. For busy families, McCormick sells recipes coupled with spices pre-mixed in the right quantities. All you have to do is buy the meat, mix in the spices and cook.
Meanwhile, the company's recent acquisition of a Polish mustard company and a joint venture with a rice company in India should keep sales growing at a nice clip. McCormick also pays a $1.24 per share annual dividend, up 51% from five years ago. The stock yields 2.2%.
Sigma Aldrich -
Market capitalization: $8.8 billion
Percentage of sales from outside the U.S.: 67%
With more than 176,000 products and next-day delivery anywhere in the world, Sigma-Aldrich (SIAL 0.00%, news) is the premier go-to chemical company for the drug and technology industries.
Its chemicals are used in biotechnology and pharmaceutical development, diagnosis of diseases and high-tech manufacturing. Sigma recently bought biological-testing company BioReliance, which serves about 90% of top biotech firms and 75% of leading pharmaceutical companies, in a deal that's supposed to boost earnings immediately, to the tune of about 5 cents per share this year.
The St. Louis company sports a strong balance sheet. Earnings are expected to grow at a rate of 9% a year over the next three to five years.
Waters
Market capitalization: $7.5 billion
Percentage of sales from outside the U.S.: 70%
Waters (WAT 0.00%, news) makes scientific instruments that are used in food-safety analysis and pharmaceutical research, including clinical trials. Based in Milford, Mass., Waters has $1.3 billion in cash and just $700 million in debt on its balance sheet. The company has been using its cash to buy back stock and has reduced the number of shares outstanding by nearly 12% over the past five years.
When it comes to turning sales into profits, few research companies do it better. For every dollar of sales the company generates, it brings about 23 cents to the bottom line. Analysts expect earnings to grow at an annualized clip of 12% for the next three to five years.
Xilinx
Market capitalization: $8.6 billion
Percentage of sales from outside the U.S.: 67%
Xilinx (XLNX 0.00%, news) makes programmable semiconductor chips that can be customized for new products. That saves inventors of everything from phones to tablets the time and expense of designing a special chip for a newly launched gizmo until they have the sales volume to know it will fly.
Xilinx and rival Altera (ALTR 0.00%, news) control more than 70% of the programmable chip market. What's more, Xilinx is a cash machine, generating more than $500 million in cash annually. That has helped the San Jose, Calif., company build a $2 billion cash hoard (it has $900 million in outstanding debt).
The cherry on top: Xilinx sports a 2.7% dividend yield -- unusually high for a technology company.
<<<
Church & Dwight -- >>> Here's How Church & Dwight Is Making You So Much Cash
By Seth Jayson
March 21, 2012
http://www.fool.com/investing/general/2012/03/21/heres-how-church--dwight-is-making-you-so-much-ca.aspx?source=idesitit10000001
Although business headlines still tout earnings numbers, many investors have moved past net earnings as a measure of a company's economic output. That's because earnings are very often less trustworthy than cash flow, since earnings are more open to manipulation based on dubious judgment calls.
Earnings' unreliability is one of the reasons Foolish investors often flip straight past the income statement to check the cash flow statement. In general, by taking a close look at the cash moving in and out of the business, you can better understand whether the last batch of earnings brought money into the company, or merely disguised a cash gusher with a pretty headline.
Calling all cash flows
When you are trying to buy the market's best stocks, it's worth checking up on your companies' free cash flow once a quarter or so, to see whether it bears any relationship to the net income in the headlines. That's what we do with this series. Today, we're checking in on Church & Dwight (NYSE: CHD ) , whose recent revenue and earnings are plotted below.

Source: S&P Capital IQ. Data is current as of last fully reported fiscal quarter. Dollar values in millions. FCF = free cash flow. FY = fiscal year. TTM = trailing 12 months.
Over the past 12 months, Church & Dwight generated $361.2 million cash while it booked net income of $309.6 million. That means it turned 13.1% of its revenue into FCF. That sounds pretty impressive.
All cash is not equal
Unfortunately, the cash flow statement isn't immune from nonsense, either. That's why it pays to take a close look at the components of cash flow from operations, to make sure that the cash flows are of high quality. What does that mean? To me, it means they need to be real and replicable in the upcoming quarters, rather than being offset by continual cash outflows that don't appear on the income statement (such as major capital expenditures).
For instance, cash flow based on cash net income and adjustments for non-cash income-statement expenses (like depreciation) is generally favorable. An increase in cash flow based on stiffing your suppliers (by increasing accounts payable for the short term) or shortchanging Uncle Sam on taxes will come back to bite investors later. The same goes for decreasing accounts receivable; this is good to see, but it's ordinary in recessionary times, and you can only increase collections so much. Finally, adding stock-based compensation expense back to cash flows is questionable when a company hands out a lot of equity to employees and uses cash in later periods to buy back those shares.
So how does the cash flow at Church & Dwight look? Take a peek at the chart below, which flags questionable cash flow sources with a red bar.

Source: S&P Capital IQ. Data is current as of last fully reported fiscal quarter. Dollar values in millions. TTM = trailing 12 months.
When I say "questionable cash flow sources," I mean items such as changes in taxes payable, tax benefits from stock options, and asset sales, among others. That's not to say that companies booking these as sources of cash flow are weak, or are engaging in any sort of wrongdoing, or that everything that comes up questionable in my graph is automatically bad news. But whenever a company is getting more than, say, 10% of its cash from operations from these dubious sources, investors ought to make sure to refer to the filings and dig in.
With 17.5% of operating cash flow coming from questionable sources, Church & Dwight investors should take a closer look at the underlying numbers. Within the questionable cash flow figure plotted in the TTM period above, other operating activities (which can include deferred income taxes, pension charges, and other one-off items) provided the biggest boost, at 13.6% of cash flow from operations. Overall, the biggest drag on FCF came from capital expenditures, which consumed 17.5% of cash from operations. Church & Dwight investors may also want to keep an eye on accounts receivable, because the TTM change is 2.7 times greater than the average swing over the past 5 fiscal years.
<<<
Ecolab -- >>> 1 Dividend Stock That Cleans Up Nicely
By Arjun Sreekumar
March 28, 2012
http://www.fool.com/investing/general/2012/03/28/1-dividend-stock-that-cleans-up-nicely.aspx
Often, the best-performing stocks are those in seemingly uninteresting industries. I'll take a well-managed market leader in a boring sector over a mediocre company in an overhyped sector any day. In the arena of cleaning, sanitizing, food safety, and infection-control products and services, one company fits this bill perfectly.
Sanitize this
Ecolab (NYSE: ECL ) develops and markets services to the food-service, energy, health-care, industrial, and hospitality markets in more than 160 countries. The St. Paul, Minn.-based company is the global leader in a diverse array of products and services ranging from food safety and industrial cleaning to pest elimination and infection control. It's an important and highly global $57 billion industry, of which Ecolab commands a 10% market share. While its line of work may sound boring, foodborne illnesses and hospital-based infections are certainly no yawning matter.
According to the FDA, foodborne illness outbreaks are on the rise, with an increasing number attributed to imported foods. Each year, tainted food causes 325,000 hospitalizations and 5,000 deaths. And hospital-acquired infections are the fourth leading cause of deaths in the U.S., resulting in 100,000 deaths per year and costing more than $33 billion annually. These are worrying trends with far-reaching consequences.
To combat these issues, Ecolab is working hard at providing hospitals with comprehensive, industry-leading solutions to decrease the risk of infections. And its SANOVA program -- commended by Food Safety Magazine -- has delivered strong results in consistently and drastically reducing E. coli and Salmonella counts in a number of food-processing environments.
Profitable AND ethical -- a winning combo
Along with an important social purpose, the company has an impressive sales record. Net sales rose 17% to a record $1.85 billion in the fourth quarter of 2011, the ninth year of double-digit, adjusted-sales growth out of the last 10 years. However, margins contracted across the board and net income fell 32%, hit by charges related to the $8 billion acquisition of water treatment company Nalco Holding. Still, the company's gross profit margins have consistently been higher than similar consumer-oriented companies such as Church & Dwight (NYSE: CHD ) and Clorox (NYSE: CLX ) . Despite constant concerns regarding the effect of Ecolab's several acquisitions over the years, the company continues to deliver.
To penetrate more effectively the quick-service restaurant market, Ecolab acquired Kay Chemical, a leading supplier of cleaning and sanitizing products for fast-food powerhouses such as McDonald's (NYSE: MCD ) , for whom it has since developed several customized cleaning products. The company's acquisition of O.R. Solutions, a leading developer of surgical fluid warming and cooling systems, boosted fourth-quarter health-care sales by 35%. And investors who were apprehensive about the Nalco merger back in December can now breathe a collective sigh of relief, as Nalco's Q4 sales rose 13% and first-quarter trends suggest that operating income is improving sharply over last year's. Through smart acquisitions like these, Ecolab continues to make valuable investments in key growth businesses and positions itself better for additional high-growth markets.
Beside a solid performance record, the company also boasts a spotless ethical record. Last week, the Ethisphere Institute, a leading international think-tank dedicated to the advancement of corporate ethics and social responsibility, recognized Ecolab as one of the world's most ethical companies. This makes it the sixth consecutive year Ecolab has received this honor. The company has also consistently placed in Corporate Responsibility Magazine's list of "100 Best Corporate Citizens" list for nine years in a row. If you buy the argument that corporations are people, Ecolab would be a friendly neighbor who shovels your driveway and waters your plants while you're out of town.
Who's scooping up the shares?
Ecolab insiders seem to share Ethisphere's and Corporate Responsibility Magazine's high opinions of their company. In the past six months or so, board members and upper management were net buyers of Ecolab shares. Company insiders purchased nearly 7 million shares, representing more than 3% of the company's $210 million share float, a strong indicator that management is bullish about the company's prospects.
One of Ecolab's largest shareholders is Bill Gates of Microsoft fame. A longtime shareholder, Gates upped his ante in August of last year by purchasing an additional 3.9 million shares through his investment management firm, Cascade Investment. The tech tycoon is now the largest shareholder if you combine his investments in the company through Cascade and through the Bill & Melinda Gates Foundation. Gates' investment advisor Michael Larson, who also serves as Cascade's business manager, was recently appointed to Ecolab's Board of Directors. Looks like Gates and company are going all-in.
Final thoughts
While I admit that the company faces headwinds in the form of rising raw material costs, I like the fact that it continues to expand into emerging high-growth markets, while remaining an ethical oasis in a desert of corporate corruption. For investors seeking some steady cash, the company recently declared a regular quarterly cash dividend of $0.20 per share. For 2012, Ecolab projects another year of double-digit sales growth in the range of 16%-20%. Trading toward the higher end of its 52-week range and at a P/E of around 31, the stock isn't exactly cheap. But I think a company as well-managed and well-positioned as Ecolab commands a premium and presents a solid long-term investment opportunity.
<<<
Church & Dwight -- >>> A Recession Proof Stock Set to Clean Up
By Lee Samaha
April 4, 2012
Tickers: CHD, CL, CLX, PG, UN
http://beta.fool.com/saintgermain/2012/04/04/recession-proof-stock-set-clean/3332/?ticker=CHD&source=eogyholnk0000001
Church & Dwight (NYSE: CHD) is a great stock for a balanced portfolio because it is recession resistant. It trades on a good evaluation and offers the prospect of some upside from a fall in commodity input costs.
Furthermore, the company is a small player in a market dominated by large acquisitive companies like Colgate (NYSE: CL), Procter & Gamble (NYSE: PG) and, London listed Reckitt Benckiser. In fact, Reckitt took over another British company SSL whose Durex condom brand competes with Church and Dwight’s Trojan.
Church and Dwight competes successfully with the likes of Procter & Gamble because it aggressively defends its niche markets from competition. As such, it is able to defend its positions and generate growth in a way that Procter & Gamble's management has failed to do. Furthermore, Church & Dwight offers value brands which already compete on price. A company like Procter & Gamble tends to be reticent to cut prices because consumers tends to want them to stick.
A classic example of this, would be with the company's Arm & Hammer toothpaste with Colgate's. Arm & Hammer is the value brand and moreover, Church & Dwight's management are nimble enough to leverage the brand by releasing products such as electrical toothbrushes.
The company is little discussed but has an excellent track record of generating earnings through the cycle. I think they can generate at least double digit returns for a stock investor from here and, are a genuine takeover target.
Church & Dwight Brands
The company’s brands can be categorized as a diversified collection of personal and homecare goods. Much of it’s brands are value propositions which offer upside in a stagnant economy, as consumers trade down to cheaper options. In terms of profits and sales, 80% of them come from the eight leading ‘power’ brands…
•Arm & Hammer (toothpaste, baking soda, detergent, cat litter)
•Trojan Condoms and Vibrators
•OxiClean Laundry Additive
•Spinbrush Battery Powered Toothbrush
•First Response Pregnancy Kit
•Nair Hair Removal
•Orajel Pain Relief
•Xtra Extreme Value Laundry Detergent
The list reads like a roll call of US value brands commonly found in the home. However, Church & Dwight is far smaller than its major competitors and, its business model is tailored towards grabbing leadership in niche markets. This means that it can protect its market share without resorting to margin erosion via price cuts.
What makes this company really special is the quality of its execution.
Church & Dwight Earnings
The management has demonstrated a tremendous ability to grow earnings and revenues over the years, even in the face of rising commodity costs and, the great recession. This can easily be summarized below
Revenue
2006 - 1,955
2007 - 2,221
2008 - 2,422
2009 - 2,520
2010 - 2,589
2011 - 2,749
Gross Profit
761
877
972
1,101
1,157
1,215
Adjusted EPS ($)
1.04
1.23
1.43
1.74
1.98
2.21
EPS Growth (%)
18.3
16.3
21.6
13.8
12
At the final results in February, management guided towards 3-4% revenue growth in 2012 with EPS growth of 14-15%
All of which paints a picture of a recession proof company. However, 2011 has proved challenging. End demand was lower than initially expected and, rising commodity costs put pressure on margin expansion. No matter, the outlook for 2012 presents upside potential as the US economy generates employment gains and, commodity costs may abate with slowing emerging market growth.
It is also worth noting that gross margins jumped in 2009 with the fall in commodity prices and, Church & Dwight has managed to hold onto them despite rising costs. Similarly, with such a well run business, working capital management is excellent and, the company always generates large amounts of free cash flow.
Church & Dwight Target Price
The stock currently trades at a price of $49.59 with a market cap of $7.09bn. There is $251m in cash on the balance sheet with $249m in outstanding debt. Free cash flow has grown from $200m to $365m from 2007-2011 with a compound annual growth rate of 16%
Obviously, on a current PE ratio of 22.4, it looks expensive but investors should focus on free cash flow. Church and Dwight trades on a current free cash flow yield of 5.1% and, that is attractive for a recession resistant company which is growing earnings in the teens. In addition, management states that they expect to generate $1.1bn in free cash flow over the next three years. This represents over 15% of the current market cap. Having increased the dividend by 41% at the last earnings, I think we should take them seriously!
For a relatively secure double digit growth over the next couple of years, this stock could trade on an evaluation closer to $55. There is upside potential from reducing commodity costs and, a potential value outer from an acquisition bid for the company. A $55 target represents 11% upside with plenty of room to grow, should a slowing Chinese economy reduce commodity input costs. Similarly, a strong return to US consumer spending will see upside to revenue growth at all the leading consumer goods companies.
Church & Dwight is a nice recession resistant stock which is good for balancing any portfolio.
<<<
BP Prudhoe Bay Royalty Trust: Why Worry About This High Yielder?
January 25, 2012
by: StreetAuthority
about: BPT, includes: CVX, RDS.A, XOM
By Nathan Slaughter
http://seekingalpha.com/article/322088-bp-prudhoe-bay-royalty-trust-why-worry-about-this-high-yielder?source=yahoo
Last week, I told you about Chesapeake Granite Wash Trust (NYSE: CHKR) -- a royalty trust paying a double-digit yield.
Royalty trusts boast some of the highest yields on the market -- typically 6% to 8%, but payouts north of 10% aren't uncommon. And aside from writing generous paychecks every quarter, many of these securities have also delivered triple-digit share price appreciation.
One of the best examples of what these securities can do is BP Prudhoe Bay Royalty Trust (NYSE: BPT).
This trust operates in the Prudhoe Bay oil field located on the North Slope in Alaska -- the largest oil field in North America. The field covers 213,543 acres and is responsible for about 10% of the United States' total oil output.
If you owned BPT, you'd own royalty interests in 150,000 acres of the Prudhoe Bay oil field. And you'd be getting paid a royalty on thousands of barrels of crude pulled from this reserve.
As you would expect, that's been pretty profitable. In the past 10 years, BPT has earned a total return of 2,248%. A $5,000 investment just 10 years ago would be worth $117,400 right now.
To give you an idea of how strong a return that is, integrated oil giant Chevron (NYSE: CVX) returned 231% over the same period. That would have turned $5,000 into $16,550. Not bad, but nowhere near what BP Prudhoe Bay Royalty Trust did.
Chevron digs up about 2.8 million barrels of black gold every day and is one of the industry's biggest producers. But Chevron also has to shoulder the enormous expenses and risks that come with being a big oil company.
In a recent quarter, it generated $64 billion in revenue... BUT $52 billion of that went toward employee salaries, marketing campaigns, administrative overhead and other operating expenses. And then Uncle Sam took $5.5 billion in corporate taxes.
That still left a respectable $7.7 billion in pure profit. But the vast majority of that was pumped right back into the business to find and develop new sources of oil.
In the end, only $0.78 per share was set aside for stockholder dividends. Today the dividend has risen slightly to $0.81 per share. That's a yield of 3.0% at today's prices.
Compare that with the $9.40 per unit BPT paid out in 2011, giving a yield of 8.1%. What's the secret behind BPT's success? Well, like clockwork, the trust pays royalties every 90 days.
Since January of 2004 the royalty checks have averaged $2.03 per unit each quarter. That's an average of $8.12 per unit each year -- turning every 1,000 units you own into an extra $8,000 in your pocket. (These royalty trusts can yield up to 17.1%.)
And those royalties are on top of capital gains. BPT's share price gained 667% during the past 10 years thanks to rising oil prices, while Chevron's stock price went up only 137%.
The thing is, BPT not only beat Chevron... it beat out just about every major oil company over the same period.
And that's only part of the equation. Go back a few more years, and the major oil and gas companies aren't even in BPT's league.
BPT has generated total returns of 5,089% since 1990 -- beating the "big" names in the oil and gas industry. Chevron... Exxon (XOM) ... Shell (RDS.A)... you name it.
So am I saying you need to load up on BPT? No. In fact, I'd steer clear of the investment.
Royalty trusts are born with a fixed amount of land that can be milked for hydrocarbons. And since there's a finite amount of oil and gas that can be economically extracted from any given acre, all trusts will eventually deplete their resources and run dry. When that happens, the trust is essentially closed down.
Generally speaking, I tend to favor newer trusts over those that were created decades ago. BPT went public back in 1989. It's been paying royalties for more than 20 years. Newer trusts allow us to get in earlier to the production life.
That's not to say investors can't or won't make money in BPT. But I'd much prefer to put my money to work in trusts formed more recently, like Chesapeake Granite Wash Trust, which I shared last week.
<<<
>>> Recent Performance Review Of 7 Oil And Gas MLPs And Royalty Trusts Yielding Over 8%
January 20, 2012
by: Zvi Bar
includes: BBEP, BPT, CLMT, FGP, MMLP, MVO, SJT
http://seekingalpha.com/article/320867-recent-performance-review-of-7-oil-and-gas-mlps-and-royalty-trusts-yielding-over-8?source=yahoo
When it comes to getting an extremely high yield out of an equity, those equities are often not standard corporations, but instead another class of entity that is designed to provide a significant payout to investors. Within the world of oil and gas, there are two common forms of such high-income entities: the Master Limited Partnership and the Royalty Trust.
A Master Limited Partnership, or MLP, is a type of partnership that is publicly traded on a securities exchange, and most MLPs are publicly traded oil and gas pipeline businesses that earn stable income from the transport of oil, gasoline and/or natural gas. MLPs combine the tax structure of limited partnerships with the liquidity of publicly traded securities.
A royalty trust is a type of corporation that is also usually involved in oil and gas production or some type of natural resource mining. Royalty trust profits are not taxed at the corporate level so long as the bulk of the trust's profits (at least 90%) are distributed to shareholders as dividends.
Royalty trusts often own multiple individual claims, but in the U.S., trusts are not allowed to acquire additional properties once they are formed. This is very different from the MLP model, where new assets are often dropped into an already existing MLP. Another primary difference is that MLPs are usually involved in the distribution, while royalty trusts are usually involved in the extraction of the resources from a proven source. Therefore, most MLP yields should be consistent and based upon demand for oil and/or gas, while royalty trusts are usually more affected by commodity pricing and the ability of the actual entity to extract the resources.
In this now highly volatile environment, many may consider these high yield oil & gas options as a sensible long-term income producing investment. Below are the equity performance rates and current yields for four MLPs, Breitburn Energy Partners L.P. (BBEP), Calumet Specialty Products Partners LP (CLMT), Ferrellgas Partners LP (FGP), Martin Midstream Partners LP (MMLP), and three royalty trusts BP Prudhoe Bay Royalty Trust (BPT), MV Oil Trust (MVO) and San Juan Basin Royalty Trust (SJT). All of these equities are publicly traded in the United States and currently yield at least eight percent.
See the chart, indicating their five-day, 2012-to-date, three-month and six-month performance rates, as well as their current yields (click to enlarge):
Several of these high-yield options performed poorly in 2011, and all of the listed MLPs and trusts have depreciated over the last six months, with an average six-month equity depreciation of 10.33 percent. Within 2012 SJT has performed remarkably poorly compared with the broader group, dropping nearly 20 percent. As a consequence, its yield increased from the mid 6s up to the mid 8s. Though a distant second, the FGP has also depreciated by a significant 8.42 percent so far in 2012.
Some of the SJT and FGP depreciation seems caused by the continuing price weakness of natural gas, but their decline also appears linked to the cancellation of the Keystone pipeline extension. In the last week, SJT has dropping over 17 percent, on no other news. Many investors may also be speculating that a distribution cut is forthcoming based upon weakening natural gas prices. It is also conceivable that a significant holder is liquidating the position.
The royalty trusts have considerably more direct exposure to oil and gas prices, while the MLPs are more directly connected to demand for them. MLPs have developed a great deal of popularity over the last few years, and it is likely that the asset class will continue to grow over the next few years, as a growing segment of pension and retirement investments are allocated into the industry. Royalty trusts cannot grow individually, but it is likely that new trusts will be developed as property owners continue to develop more tax-efficient methods of monetizing oil and gas production.
<<<
>>> 5 Energy Stocks Yielding 4%+ A Year
January 30, 2012
by: Vatalyst
includes: BPT, CHK, CHKM, ECA, FGP, MMLP
http://seekingalpha.com/article/325212-5-energy-stocks-yielding-4-a-year?source=yahoo
The energy sector is fertile hunting ground for investors looking for high yield stocks. The sector includes some of the world's largest stocks with large amounts of cash flow to pay out as dividends to a range of master limited partnership - MLP - and limited partner - LP - companies designed to throw off distributions from producing oil and gas wells, pipelines or retail energy distribution.
To cover the large number of big dividend energy stocks, this discussion will be broken up into a series of articles, each covering five or so energy stocks. Get ready to take some notes or bookmark the articles with the stock which are a fit for your portfolio. What makes each of these stocks (and partnership units) unique is their above average yields. The companies in this analysis yield 4-11% per year.
Ferrellgas Partners, L.P. (FGP) Ferrellgas sells propane and propane equipment to retail and commercial customers under the Ferrellgas and Blue Rhino brands. The company has a current market cap of $1.3 billion and the stock yield is almost 11.5 percent. FGP has paid 50 cent distribution since the first quarter after going public in 1995, reaching almost 70 consecutive distribution payments to date. Investors should not expect a dividend increase in the near or any future. Still 11 percent is 11 percent if the company maintains the distribution level.
Chesapeake Midstream Partners, L.P. (CHKM) This company was spun off by large cap energy company Chesapeake Energy (CHK) in 2008 to hold the company's midstream natural gas gathering, compression and transmission assets. The midstream sector of the natural gas business tends to be the most stable revenue-wise and Chesapeake Midstream Partners can expand its gathering network as Chesapeake Energy and other companies complete new gas wells. This $4.2 billion company paid its first distribution of 21.65 cents in November of 2010. The payout has increased for five straight quarters with the most recent declared in November 2011 at a rate of 37.5 cents. CHKM current yields right at 5 percent based on the most recent distribution rate.
EnCana Corporation (ECA) Encana is a natural gas exploration and production company organized as a corporation and not as a MLP or L.P. The company drills for and produces natural gas in British Columbia, Canada and the southwestern U.S. The current 20 cents per share quarterly dividend gives this $13.8 billion market cap a current yield of 4.3 percent. Encana was paying a 40 cent quarterly dividend in 2007 and 2008. Then lower gas prices resulted in the halving of the distribution. The current 20 cents quarterly was paid for both 2010 and 2011. The current low market price for natural gas makes dividend increases in the near term unlikely.
BP Prudhoe Bay Royalty Trust (BPT) As its name implies, the BP Prudhoe Bay Royalty Trust has an overriding royalty interest to receive 16.4 percent of the value of the first 90,000 barrels of daily production from the Prudhoe Bay oilfield worked by BP Alaska. During 2010, the oilfield produced over 200,000 barrels per day. With these shares the quarterly distribution amount varies with the value of crude oil over the quarter. Over the last 5 years, the quarterly payout has ranged from about $1.00 ot $3.00 per share. Using the most recent four distributions, BPT has a yield of 8.2 percent. The share value of BPT also tends to move up and down with the spot price of crude oil.
Martin Midstream Partners L.P. (MMLP) Martin Midstream Partners is a small cap - $780 million - natural gas terminal and storage services company with facilities along the U.S. gulf coast. The current 76.25 cents quarterly distribution gives the shares an 8.4 percent yield. The company's history of moderate annual distribution increases slowed starting in mid 2008 when the distribution reached 74 cents per share. The payout remained at 75 cents for nine consecutive quarters, then it increased by a penny for the first quarter of 2011 and then by a quarter-cent for the 2011 second quarter.
Investors should be aware that the limited partnership type companies issue a form K-1 each year for investors to use with their tax returns. Partnership earnings require extra tax reporting paperwork, but a portion of the annual distributions may be classified as non-taxable return of capital. Most L.P. companies provide information on the tax nature of recent distributions in the investor relations pages of their websites.
<<<
BP Prudhoe Bay Royalty Trust, Sunoco Logistics Partners L.P
>>> 5 Great Plays With Yields As High As 9.4%
February 9, 2012
by: Sol Palha
includes: BPT, HAS, MSB, SCG, SXL
http://seekingalpha.com/article/353191-5-great-plays-with-yields-as-high-as-9-4?source=yahoo
Market volatility and economic uncertainty are driving more individuals into stocks that pay dividends. Investors who are new to the concept of dividend investing should take the time to understand the following ratios as they could prove to be very useful in spotting future champions.
Levered free cash flow is the amount of cash available to stock holders after interest payments on debt are made. A company with a small amount of debt will only have to spend a modest amount of money on interest payments, which in turn means that there is more money to send to shareholders in the form of dividends and vice versa.
Operating cash flow is generally a better metric than earnings per share because a company can show positive net earnings and still not be able to properly service its debt; the cash flow is what pays the bills.
The payout ratio tells us what portion of the profit is being returned to investors. A payout ratio over 100% indicates that the company is paying out more money to shareholders, then they are making; this situation cannot last forever. In general if the company has a high operating cash flow and access to capital markets, they can keep this going on for a while. As companies usually only pay the portion of the debt that is coming due and not the whole debt, this technique/trick can technically be employed to maintain the dividend for sometime. If the payout ratio continues to increase, the situation warrants close monitoring as this cannot last forever; if your tolerance for risk is a low, look for similar companies with the same or higher yields, but with lower payout ratios. Individuals searching for other ideas might find this article to be of interest 5 Interesting Plays With Yields As High As 11.50%.
Interest coverage is usually calculated by dividing the earnings before interest and taxes for a period of 1 year by the interest expenses for the same time period. This ratio informs you of a company's ability to make its interest payments on its outstanding debt. Lower interest coverage ratios indicate that there is a larger debt burden on the company and vice versa.
Debt to equity ratio is found by dividing the company's total amount of long-term debt (debts with interest rates that have a maturity longer than one year) by the total amount of equity. A debt to equity ratio of 0.5 tells us that the company is using 50 cents of liabilities in addition to each $1 dollar of shareholders equity in the business. There is no fixed ideal number as it depends on the industry the company is in. However, in general a ratio under 1 is acceptable and ideally it should be in the 0.5-0.6 ranges.
Current ratio is obtained by dividing the current assets by current liabilities. This ratio allows you to see if the company can pay its current debts without potentially jeopardizing their future earnings. Ideally the company should have a ratio of 1 or higher.
ROE is obtained by dividing the net income by share holder's equity. It measures how much profit a company generates with the money shareholders have invested in it.
Price to tangible book is obtained by dividing share price by tangible book value per share. The ratio gives investors some idea of whether they are paying too much for what would be left over if the company were to declare bankruptcy immediately. In general stocks that trade at higher price to tangible book value could leave investors facing a great percentage per share loss than those that trade at lower ratios. The price to tangible book value is theoretically the lowest possible price the stock would trade to
Quick ratio or acid -test is obtained by adding cash and cash equivalents plus marketable securities and accounts receivable dividing them by current liabilities. It is a measure of a company's ability to use its quick assets (assets that can be sold of immediately at close to book value) to pay off its current liabilities immediately. A company with a quick ratio of less than 1 cannot pay back its current liabilities. Additional key metrics are addressed in this article The Highest Paying REITs With Yields As High As 13%.
With so many good plays to choose from it was hard to narrow it down to one so what we did was selected two. From a conservative perspective Sunoco Logistics Partners L.P. (NYSE: SXL) would be our first choice for the following reasons:
It has a five dividend average of 6.5%
A five dividend growth rate of 9.74%
A free cash flow rate of $284 million
Has consecutively increased its dividend for 9 years in a row
Has an ROE of 28%
A decent quarterly earnings growth rate of 28%
A good interest coverage ratio of 9.3
A strong 3 year total return of 134%
It recently increased its dividend from 41.3 cents to 42 cents.
From a more aggressive perspective Mesabi Trust (NYSE: MSB) would our first choice for the following reasons:
5 year dividend average of 11.2%
5 year dividend growth rate of 8.76%
A strong 3 year total return of 323%
A ROE of 720%
A quarterly earnings growth rate of 20.7%
Net income and total cash flow from operating activities have been trending upwards for the past few years
Finally 10K invested for 10 years in MSB would have grown to a whopping $122K for annualized rate of return in excess of 25%
Investors should pay attention to the following risks associated with trusts:
Cash flow is dependent on the price of the underlying commodity and production levels and thus could be subject to swings. If the swings are wide, the dividends paid out could vary widely from year to year.
While investing in royalty trust can yield steady and hefty returns, there is one potential drawback: depletion. These trusts own royalties on a finite amount of resources, and once those resources are gone; the trust is also gone. Investors need to understand that the distributions will eventually decline and disappear. It is essential that you do your due diligence before opening a position in the trusts that are discussed in this article.
Stock
Dividend Yield (%)
Market Cap
Forward P/E
EBITDA
Quarterly Revenue Growth
Beta
Revenue
Operating Cash flow
BPT
8.60
2.53B
N/A
202.4M
24.80%
0.63
203.56M
N/A
MSB
9.40
413.5M
11.5
32.2M
20.70%
1.73
33.12M
16.73M
SXL
4.40
4.08B
15.35
546.33M
51.90%
0.17
10.90B
N/A
HAS
3.9
4.6B
11.83
745.84M
4.80%
0.96
4.23B
363.26M
SCG
4.30
5.93B
14.26
1.20B
0.40%
0.54
4.52B
841.00M
BP Prudhoe Bay Royalty Trust (NYSE: BPT)
Industry: Production & Extraction
Net income for the past three years
2008 = $250.54 million
2009 = $158.04 million
2010 = $184.42 million
20111= it stands at $159 and could top the $216 million mark.
Key Ratios
P/E Ratio = 12.3
P/E High - Last 5 Yrs = 13.9
P/E Low - Last 5 Yrs = 5
Price to Sales = 12.25
Price to Book = 3597.55
Price to Cash Flow = 12.3
Price to Free Cash Flow = N.A.
Quick Ratio = N.A.
Current Ratio = N.A.
LT Debt to Equity = 0
Total Debt to Equity = 0
Interest Coverage = N.A.
Inventory Turnover = N.A.
Asset Turnover = 162.7
ROE = 20225.77%
Return on Assets = 10110.82%
200 day moving average = 111.25
Current Ratio = 3.26
Total debt = 0
Book value = 0.03
Qtrly Earnings Growth = 25.9%
Dividend yield 5 year average = 10.2%
Dividend rate = $ 9.50
Payout ratio = 100%
Dividend growth rate 3 year avg = -1.41%
Dividend growth rate 5 year avg = 0.64%
Consecutive dividend increases = 0 years
Paying dividends since = 1990
Total return last 3 years = 96.67%
Total return last 5 years = 119.83%
Notes
Dividend was increased from $1.95 to $2.51. It also sports a decent quarterly earnings growth of 25%
Mesabi Trust
Industry: Non-Precious Metals
Levered Free Cash Flow: 6.96M
Net income
2008=$-3.6 million
2009 = $34.67 million
2010 = $12.43 million
2011 = $32.47 million
Total cash flow from operating activities
2009 = $32.95 million
2010 = $17.02 million
2011 = $30.36 million
Key Ratios
P/E Ratio = 13.2
P/E High - Last 5 Yrs = 23.5
P/E Low - Last 5 Yrs = 2.6
Price to Sales = 12.84
Price to Book = 90.14
Price to Tangible Book = 90.14
Price to Cash Flow = 13.2
Price to Free Cash Flow = -34.7
Quick Ratio = N.A.
Current Ratio = N.A.
LT Debt to Equity = 0
Total Debt to Equity = 0
Interest Coverage = N.A.
Inventory Turnover = N.A.
Asset Turnover = 1.8
ROE = 719.23%
Return on Assets = 111.37%
200 day moving average = 26.4
Current Ratio = 1.33
Total debt = 0
Book value = 0.36
Qtrly Earnings Growth = 20.7%
Dividend yield 5 year average = 11.2%
Dividend rate = $ 2.53
Payout ratio = 98%
Dividend growth rate 3 year avg = 21.42%
Dividend growth rate 5 year avg = 8.76%
Consecutive dividend increases = 5 years
Paying dividends since = 1990
Total return last 3 years = 323.44%
Total return last 5 years = 75.88%
Notes
MSB will pay out a distribution of 76 cents a share even though analysts were expecting 96 cents; the last payment was for $1.12. "Despite the shortfall, there is no reason to change our distribution and EPS estimates of $2.82/sh for FY'13," the analysts wrote in a Jan. 17 report.
Net income and total cash from operating activities have generally been trending upwards and it also sports a decent quarterly earning's growth rate of 20.7%. One needs to be ready to deal with volatility as the distribution is tied to the price of the underlying commodity; if you cannot deal with volatile moves in terms of the distribution, you will receive, then you are better of skipping this play. It has a superb three year gain of 323%, which would have more than made up for the erratic distribution history. 100K invested for 10 years would have grown to $1.2 million.
Sunoco Logistics Partners L.P.
Industry: Equipment & Services
It has a free cash flow rate of $284.7 million
Net income for the past three years
2008 = $214.48 million
2009 = $250 million
2010 = $346 million
2011= It stands at $237 million and it could top $337 million
Total cash flow from operating activities
2008 = $228.59 million
2009 = $176 million
2010 = $341 million
2011= It stands at $215 million and could come in as high as $400 million
Key Ratios
P/E Ratio = 15.8
P/E High - Last 5 Yrs = 19
P/E Low - Last 5 Yrs = 5.4
Price to Sales = 0.39
Price to Book = 3.52
Price to Tangible Book = 5.29
Price to Cash Flow = 9.2
Price to Free Cash Flow = -11.4
Quick Ratio = 0.9
Current Ratio = 1.1
LT Debt to Equity = 1.66
Total Debt to Equity = 1.66
Interest Coverage = 9.3
Inventory Turnover = 29
Asset Turnover = 2
ROE = 28.96%
Return on Assets = N/A
200 day moving average = 32.42
Current Ratio = N/A
Total debt = 1.80B
Book value = 10.16
Qtrly Earnings Growth = 28.5%
Dividend yield 5 year average = 6.5%
Dividend rate = $ 1.64
Payout ratio = 66%
Dividend growth rate 3 year avg = -14.12%
Dividend growth rate 5 year avg = 9.74%
Consecutive dividend increases = 9 years
Paying dividends since = 2002
Total return last 3 years = 134.1%
Total return last 5 years = 142.44%
Notes
Net income and total cash flow from operating activities have generally been trending upwards for the past several years. It sports a decent quarterly earnings growth rate of 28%, a decent 5 year dividend growth rate of 9.74%, has consecutively increased dividends for nine years, has a very nice 5 year dividend average of 6.7% and has a very decent interest coverage ratio of 9.3. The dividend has been increased from 41.3 cents to 42.00 cents.
Hasbro, Inc. (NYSE: HAS)
Industry: Leisure Equipment
Levered Free Cash Flow: 306.71M
Net income for the past three years
2009 = $374.93 million
2009 = $374.93 million
2010 = $397.76 million
2011= it stands at $246 and could come in as high as $416 million.
Total cash flow from operating activities
2009 = $265.63 million
2009 = $265.63 million
2010 = $367.99 million
2011= It stands at $1 million and could come in as low as $-120 million.
Key Ratios
P/E Ratio = 12.9
P/E High - Last 5 Yrs = 21.5
P/E Low - Last 5 Yrs = 8.5
Price to Sales = 1.09
Price to Book = 3.35
Price to Tangible Book = 10.85
Price to Cash Flow = 8.1
Price to Free Cash Flow = 49.3
Quick Ratio = 1.5
Current Ratio = 2.3
LT Debt to Equity = 1.02
Total Debt to Equity = 1.03
Interest Coverage = 6.3
Inventory Turnover = 4
Asset Turnover = 1
ROE = 26.93%
Return on Assets = 8.94%
200 day moving average = 35.6
Current Ratio = 2.34
Total debt = 1.42B
Book value = 10.67
Qtrly Earnings Growth = 10.2%
Dividend yield 5 year average = 2.8%
Dividend rate = $ 1.44
Payout ratio = 39%
Dividend growth rate 3 year avg = 15%
Dividend growth rate 5 year avg = 18.41%
Consecutive dividend increases = 8 years
Paying dividends since = 1981
Total return last 3 years = 74%
Total return last 5 years = 41.13%
Notes
While net income has been increasing for the past several years (it's on course to increase for four years in a row), total cash flow from operating activities has taken a big hit and could come in negative for 2011; cash flow is what the business uses to pay its bills and dividends. On the bright side, dividends have been raised for eight years in a row, and it does sport a strong five-year dividend growth rate of 15%. It only has a low payout ratio of 39% so while the negative operating cash flow is of concern the other factors more than make up for it.
We would keep an eye of cash flow going forward; if it continues to drop, then we would monitor other ratios such as payout ratios and net income. A company that has been increasing dividends for over eight years is not going to cut them, unless they are forced to. In a positive development Hasboro INC announced they were going to raise the dividend by 20% from 30 cents to 36 cents; shareholders of record as of May 1 will be paid the dividend on May 15.
SCANA Corp (NYSE: SCG)
Industry : Electric Utilities
Levered Free Cash Flow: -238.68M
Net income for the past three years
2008 = $346 million
2009 = $357 million
2010 = $376 million
2011= It stands at $289 and could top the $394 million mark.
Total cash flow from operating activities
2008 = $454 million
2009 = $679 million
2010 = $811 million
2011= It stands at $677 and could come in as high as $927 million.
Key Ratios
P/E Ratio = 15.2
P/E High - Last 5 Yrs = 16.6
P/E Low - Last 5 Yrs = 9.1
Price to Sales = 1.3
Price to Book = 1.53
Price to Tangible Book = 1.63
Price to Cash Flow = 7.6
Price to Free Cash Flow = -16.5
Quick Ratio = 0.4
Current Ratio = 0.8
LT Debt to Equity = 1.14
Total Debt to Equity = 1.37
Interest Coverage = 2.9
Inventory Turnover = 7.5
Asset Turnover = 0.4
ROE = 10.35%
Return on Assets = 3.93%
200 day moving average = 41.56
Current Ratio = 0.84
Total debt = 5.41B
Book value = 29.68
Qtrly Earnings Growth = 4%
Dividend yield 5 year average = 4.8%
Dividend rate = $ 1.94
Payout ratio = 65%
Dividend growth rate 3 year avg = 1.78%
Dividend growth rate 5 year avg = 3.23%
Consecutive dividend increases = 11 years
Paying dividends since = 1946
Total return last 3 years = 47.94%
Total return last 5 years = 31.82%
Conclusion
The markets have had a very strong run over the past few months. Long term players know from experience that the best time to buy is when there is fear in the air; the masses panic and dump everything. When there is blood on the streets one finds the best long term bargains. As the markets are extremely overbought in the short and intermediate time frames, long-term investors should be patient and wait for a strong pull back before committing large sums of money to this market.
The targets we issued in early December for the SPX were hit and surpassed. We issued two targets; the first fell in the 1300-1320 ranges and the second called for the SPX to spike to the 1340 ranges. The charts are clearly indicating that the markets are ready for a sharp correction which in our opinion will be followed by a strong counter rally that could last several months.
<<<
BP Prudhoe Bay Royalty Trust -
>>> Preparing Your Portfolio For Possible Mid-East Turmoil
March 12, 2012
by: Bill Gunderson
http://seekingalpha.com/article/426471-preparing-your-portfolio-for-possible-mid-east-turmoil?source=yahoo
The sabres are rattling so hard that I can feel my teeth chatter. A nuclear weapon armed Iran is an unacceptable situation to many countries around the world-most of all Israel.
The U.S. stock market is off to a robust start in 2012. The Nasdaq is now up about 14% year-to-date, the Dow is flirting with 3,000, and the Emerging Markets have been on fire lately.
In my newsletter last week, I included a table that shows that India is up 26.8%, Russia is up 26.3%, Brazil is up 22.5%, and China is up 15.5% so far in 2012. Even troubled Europe is up 10.6% YTD.
All seems to be well in the equities markets here at home and across the globe. As a professional money manager, I have to play the "what-if" game every day of my life. I am responsible for a lot of money that is very important to my clients.
Right now, I am fully invested and I am busy "making hay, while the sun is shining." I am having a great year for my clients. I have to ask myself however, what if I wake up tomorrow to the news of Israeli warplanes striking sites in Iran?
It seems that the likelihood of this happening is increasing by the day. Will Iran just roll over and cease their nuclear ambitions if a strike does occur, or will they turn to their friends to help in retaliation? I think we can look around and be able to determine who their friends are.
This is a very sobering thought. On the one hand, the market is going well right now, and folks are making good money once again. On the other hand, we all need to play the "what-if" game right now.
I have my own grading system wherein I rate and grade around 2,800 different stocks, ETFs, commodities, asset classes, inverse funds, etc. I watch daily for movement one way or another for some kind of clue to start to take cover.
The inverse funds, which are at the bottom of the heap would start rising, aggressive stocks would start falling, gold would start rising once again, and oil would more than likely start to really heat up.
I have a plan, and I stand ready to implement it if necessary. I obviously hope that it will not be necessary, however. One of the key parts of my plan would be to increase my exposure to oil stocks, especially dividend paying ones.
We learned in 2008 that dividend payers hold up a whole lot better during a market sell-off. In fact, the stock that I am going to talk about here was actually up 4.3% in 2008, while the S & P 500 was down 38.5% that year. Here is an example of a stock that should continue to flourish, come what may.
B P Prudhoe Bay Royalty Trust (BPT) is a $2.63 mid-cap stock that has cranked out almost unbelievable returns to its investor over the last 1, 3, 5, and 10 years. Here is what the performance looks like:
Data from Best Stocks Now App
As you can see, BPT has delivered average total returns of 40% per year (inclusive of dividends) over the last ten years. During this same period of time, the market has delivered just 1.6% per year.
Over the last 3 years, the stock has continued to crank out average annual returns of 46.5% per year, while the S & P has delivered 25.5% per year.
BPT is up another 16.6% over the last twelve months, and the stock has been very strong since last October as oil prices continue to rise.
My proprietary grading system loves performance, but it also takes into account value. There is currently not any analyst estimates that we can project target prices with, but the stock currently has a PE ratio of 13, which is cheaper than the market.
Data from Best Stocks Now App
Out of the 2,786 stocks that I follow, BPT currently comes in at #63 and gets an overall grade of A. I only buy A- rated stocks or better. I usually find them in my top 200.
There are a lot of ways that investors can be prepared for a possible shock to the market. A heavy cash position may be desirable at some point. Inverse ETFs may be a good way to hedge. Oil and oil stocks should continue strong.
In the meantime, keeping making hay while the sun shines in A graded stocks, see articles all over the web that I have written for ideas, and pray for a resolution to the current situation that is brewing in middle-east.
<<<
Omega Healthcare Investors (REIT) -
>>> Healthcare REITS : A Great Way To Play A Growing Sector
by: Justin Kuepper
February 9, 2012
http://seekingalpha.com/article/355691-healthcare-reits-a-great-way-to-play-a-growing-sector?source=yahoo
about: OHI, includes: CSA, HCN, HR, LTC, MPW, NHI, SNH, UHT
There's little question that the healthcare industry is destined to grow over the coming decades, as demand from the aging baby boomer population grows. And while regulatory uncertainty has weighed down some companies, the industry remains largely in tact in the U.S.
Investors looking to side step this uncertainty, but still capitalize on the industry's upside potential, may want to consider healthcare REITs. These stocks have the added benefit of dividend income, which is even more preferable in today's low rate environment.
Healthcare REITs have not only consistently outperformed the S&P 500 since 2008, but they also offer dividend income on top of those capital gains. Currently, the sector has an average price-earnings ratio of 42.2x and an average dividend yield of 5.7%, according to TickerSpy.
A Look at Some Popular Healthcare REITs
There are many different healthcare REITs in the market.
Here are some of the best 3-month performers:
Omega Healthcare Investors Inc. (OHI) +25.7%
Healthcare Realty Trust Inc. (HR) +20.3%
National Health Investors Inc. (NHI) +17.1%
LTC Properties Inc. (LTC) +15.5%
Health Care REIT Inc. (HCN) +15.3%
Here are the best dividend yields in the sector:
Cogdell Spencer Inc. (CSA) 9.4%
Medical Properties Trust Inc. (MPW) 8.1%
Omega Healthcare Investors Inc. 7.4%
Senior Housing Properties Trust (SNH) 6.6%
Universal Health Realty Income Trust (UHT) 6.1%
Omega Healthcare: The Preferred Play on the Sector
Omega Healthcare Investors Inc. , a healthcare REIT focused on long-term care facilities throughout the U.S., is perhaps the best-positioned company in the sector. With a beta co-efficient of less than 1.0, the stock has less volatility than the overall market, while it has risen some 13.59% since the beginning of this year.
A Look at the Fundamentals
From a fundamental standpoint, the company generates most of its revenues from skilled nursing facilities (SNFs) in the U.S. With the aging population, these facilities are not likely to disappear anytime soon in aggregate. And its own portfolio consists of high quality properties with strong operator coverage ratios relative to the industry.
Funds from operations (FFO) - one of the most useful indicators for REIT investors - jumped 4.7% to $44.5 million last quarter. Meanwhile, the company's quick ratio remains at a healthy 1.67x, which suggests that it could easily weather any modest downturn ahead from cuts to Medicare and Medicaid programs as a result of government budget cuts.
Some Risks and Justifications
The risks associated with this investment are two-fold. First, the aforementioned cuts to Medicare and Medicaid could hurt long-term care facilities (its clients) and depress lease and occupancy rates. And second, the sector has moved up sharply over the past few months and some investors believe it may be slightly overvalued.
That said, these companies offer strong dividend yields that can help offset a stagnant share price in the near-term, while maintaining long-term capital gains potential. And the low interest rate environment through 2014 should keep investors interested in these stocks for a long time to come. But investors looking for additional protection could use a covered call strategy.
<<<
Beverage stocks -- >>> 5 Stocks to Quench Your Portfolio's Thirst
Stock Quotes in this Article: CBOU, DEO, KO, SAM, MNST
By Scott Rothbort
Senior Contributor
02/27/12 - 06:14 PM EDT
http://stockpickr.com/5-stocks-quench-your-portfolios-thirst.html
MILLBURN, N.J. (Stockpickr) -- Everyone drinks some sort of beverage, and the huge beverage business continues to grow in the U.S. and internationally. The sector transcends a broad variety of drinks: hot and cold, alcoholic and non-alcoholic, caffeinated and non-caffeinated, carbonated and flat, flavored or just plain water.
With this in mind, let's take a closer look at my top five beverage stocks.
>>5 Rocket Stocks Worth Buying This Week
Diageo
Diageo (DEO) is a U.K. distiller, brewer, bottler and distributor of a multitude of alcoholic products sold under recognizable brands such as Johnnie Walker, Bailey’s, Smirnoff, Royal Crown, Tanqueray, Jose Cuervo, Seagram’s, Guinness and Red Stripe. For its fiscal year ended June 2011, earnings per share, in pound sterling rose 16%. Gross margins rose 70 basis points during that period. In the first half of fiscal 2012, earnings also grew by 16%.
Compare these results to that of Beam (BEAM), which grew earnings by 10% in 2011 and is expect to do so again in 2012. Brown Forman (BF.B), another distiller, is expected to have a more challenging year in 2012, as earnings are expected to decline.
On a valuation basis, Diageo is also the cheapest of all three competitors, selling at 15 times earnings vs. 22 for Brown Forman and 24 for Beam.
Caribou Coffee
Caribou Coffee (CBOU ) is the second-largest company-owned premium coffeehouse operator in the U.S. based on the number of coffeehouses. The company sells premium coffee and hand-crafted espresso-based beverages, as well as specialty teas, baked goods, whole bean coffee, branded merchandise and other coffee lifestyle items. In addition, Caribou Coffee supplies its products to grocery stores, mass merchandisers, club stores, office and foodservice providers, hotels, entertainment venues and e-commerce channels. Furthermore, Caribou Coffee licenses third parties to use the Caribou Coffee brand on quality food and merchandise items.
Caribou Blend coffee can be purchased across the country and can be brewed using the Keurig K-Cup system at home or at the workplace. Think of the Keurig system as the razor and the coffee cups as the razor blades. While Keurig is owned by the troubled Green Mountain Coffee Roasters (GMCR), the patent for the Keurig system is about to expire. This will mean that more companies can sell a version of the system, which will provide more channels of distribution for Caribou’s products.
>>5 Stocks Set to Soar Off Bullish Earnings
As of Jan. 1, Caribou had 581 coffeehouses, including 169 franchised locations, in 20 states, the District of Columbia and nine international markets. This compares with 407 company-owned coffeehouses and 147 franchised and licensed locations as of July 3, 2011. More domestic and international expansion is planned for 2012 and beyond.
The coffee market continues to grow domestically and internationally. Starbucks (SBUX) is all too saturated in the U.S. and is looking toward the Far East for growth. Dunkin Donuts (DNKN) is too concentrated in the Northeast. Caribou, on the other hand, is headquartered in Minnesota and is slowly spreading through the nation with significant opportunities for expansion in its future.
Coffee prices have been on the decline since peaking in the spring of 2011. I expect those prices to continue to decline in early 2012 and then moderate. With consumers now accustomed to higher coffee prices, this will result in increased margins for a company like Caribou.
Coca-Cola
Coca-Cola (KO) is the world’s largest diversified beverage company, dwarfing the market capitalization of its closest competitor PepsiCo (PEP) by about $60 billion or 60%.
Coca-Cola is best known for its Coca-Cola-branded carbonated soft drink popularly referred to as Coke and Diet Coke. However, the company has a portfolio of over 3,500 products which is sold in over 200 countries. In addition to Coke, the company has other flavored sodas, energy drinks, juices, sports drinks, tea, coffee and water. The company even produces Caribou Iced Coffee under an agreement with the above-mentioned Caribou Coffee.
While PepsiCo has struggled over the past year or more and expects to face some headwinds in 2012, Coca-Cola continues to forge ahead. Of the three major carbonated soft drink companies, Coca-Cola is expected to grow earning the most in 2012, by 6% vs. 4% for Dr Pepper Snapple (DPS) and an expected decline in earnings for PepsiCo in what management considers a “transition year.”
Coca-Cola, one of 10 Top Warren Bufett Dividend Stocks, was included recently in the "Ultimate Stock Pickers" Portfolio.
Boston Beer
Boston Beer (SAM) is a handcrafted beer brewer that manufactures its beer under the Sam Adams label. The U.S. craft beer market continues to expand in what is estimated in annual mid teen percentage rates. In the meantime, total domestic beer sales are flat to slightly lower. This is a trend which should continue for some time.
Boston Beer continues to expand across the country from its humble beginnings in Massachusetts. This expansion is not only in bottled form but also in draft form as craft beers are taking market share in all distribution channels. You might assume that beer giants such as Anheuser-Busch Ambev (BUD), Molson-Coors (TAP) and SABMiller would not be concerned by this smaller competition, which has a market cap of just about $1.4 billion.
Quite the opposite: Those suds makers are trying to develop their own handcrafted brands. It may come down to one of these larger companies making an unsolicited bid for Boston Beer one day. I would also not rule out an acquisition by a beverage or snack business such as Coca-Cola or PepsiCo.
Recently, Boston Beer acquired Angel City Brewing, a privately held Los Angeles-based craft brewer. This is a strategically important acquisition as Boston Beer now has a West Coast base of operations to further catalyze its growth.
The stock sports a premium multiple of nearly 24 time earnings when compared to more traditional beer companies. I believe that this is justified given the huge opportunity for growth that the company has, or the possibility of a takeover. I have a $120 price target on shares of Boston Beer for the end of 2012. However, as the stock tends to be quite volatile, I consider Boston Beer to be a high risk investment with excellent long term growth opportunities.
Monster Beverage
Monster Beverage (MNST), known as Hanson Natural until Jan. 9, markets and distributes popular brands of beverages such as Monster Energy Drinks and Hansen Natural. Hansen Natural produces soda, juice, lemonade, tea and flavored water.
Energy drinks are one of the fastest growing segments of the soft drink market, much as the handcrafted beer market is for the beer business. The most popular energy drink in the market place is Red Bull, which is owned by a privately held an Austrian company. Monster is second in market share behind Red Bull. Energy drinks sell for anywhere between $2 and $3 per can and hence have a much more robust profit margin that soda.
Monster Beverage increased earnings by 34% in 2011 and is expected to do so by 23% in 2012. The stock sells for 30 times 2012 earnings. The company carries no debt and as of the most recent quarter held nearly $800 million of cash and short-term investments. The company’s stock split 2-for-1 in the middle of February.
As of the most recently reported period, Monster Beverage is one of the top holdings of Renaissance Technologies.
<<<
Best High Dividend stocks -
5.5% -- Altria (MO) - Tobacco products
4.8% -- Lorillard (LO) - Tobacco products
5.5% -- National Health Investors (NHI) - Healthcare facilities REIT
7.8% -- Omega Healthcare (OHI) - Healthcare facilities REIT
3.7% -- WGL Holdings (WGL) - Natural gas utility
3.9% -- Ambev (ABV) - Beverages (Brazil)
4.2% -- TransCanada (TRP) - Oil and gas pipelines, electric power plants (Canada)
6.6% -- AmeriGas Partners LP - (APU) - Distributor of propane gas
8.1% -- BP Prudhoe Bay Royalty Trust (BPT) - Oil/gas royalty trust
5.1% -- Kinder Morgan Energy Partners LP (KMP) - Oil and gas pipelines
4.5% -- Magellan Midstream Partners LP (MMP) - Oil and gas pipelines
4.0% -- Sunoco Logistics Partners LP (SXL) - Oil and gas pipelines
>>> Church & Dwight On Fire
Dec 22, 2011
by Matt Cavallaro
http://stocks.investopedia.com/stock-analysis/2011/Church--Dwight-On-Fire-CHD-PG-CL-CLX-XLP-KMB1221.aspx?partner=YahooSA#axzz1hequ6gcU
It's not the sexiest name, but Church & Dwight (NYSE:CHD) is one of the best gifts investors have gotten during the persistently volatile season. Is it too late to clean up with Church & Dwight?
Rock Solid Performance
Up about 30% year-to-date, Church & Dwight's consistently strong operating performance is enviable. EPS growth has been consistently over 10% for the past three years, according to Church & Dwight's CEO James Craigie. Operating margins have been rising for a number of years as well. The New Jersey-based manufacturer of popular household items, such as Arm & Hammer, Pepsodent and Trojan Condoms, reported net income of $79.6 million during the third quarter. Net sales grew to $701 million. Of note, Arm & Hammer and XTRA sales rose 10% year-over-year in dollar terms. Management anticipates sturdy organic sales growth in the Q4, and synergies may come online soon due to new plant openings.
Years of dependable operating performance have resulted in an excellent balance sheet featuring great cash flow - enough to retire all of Church & Dwight's debt, in fact. Expect a boost in the dividend yield, and augmentation of the $300 million buyback that is in place, using some of that cash flow. Church & Dwight already doubled its dividend in February 2011, and another hike might be just around the corner as the company targets a 2% yield. On a relative basis, Church & Dwight's yield isn't competitive compared against Procter & Gamble (NYSE:PG), Colgate-Palmolive (NYSE:CL) or Clorox (NYSE:CLX). What Church & Dwight lacks in yield (1.5%), it more than makes up for with stable capital appreciation potential. (To learn more about yields, read Investment Valuation Ratios: Dividend Yield.)
Best of a Good Group?
On top of the stellar yearly gain, Church & Dwight's long-term price chart looks like a staircase. The trend should continue. Highly volatile markets are increasingly pushing investors to a defensive sector rotation strategy. The Consumer Staples Select Sector SPDR (ARCA:XLP) is the top-performing group over the past month. Furthermore, the sector trails only utilities for the year. If Europe continues to rattle markets, Staples' low-risk premium will keep drawing interest.
Church & Dwight's operating performance separates it from the pack. The sluggish pace of economic growth and rise in raw material prices seem to be impacting the competition to a slightly greater extent. Procter & Gamble's net income slipped 2% last quarter as price increases led to lower volumes and lost market share. Kleenex and Huggies diapers seller Kimberly Clark (NYSE:KMB) recently downgraded its sales growth target as consumers trade down. Colgate-Palmolive indicated that 2011 gross margins will be squeezed more than previously expected, although sales did climb 11% last quarter. Despite economic headwinds, these companies still boast outstanding brands and attractive yields that investors want.
The Bottom Line
Church & Dwight simply appears to be the best of the group right now. Of course, there are risks to be aware of. Stagnating global growth and higher input costs - oil in particular - pose serious threats. On the other hand, if the risk on trade re-emerges, the staples sector would be left in the dust.
Yet it seems like broad market volatility is one thing investors can count on for the foreseeable future. Church & Dwight can capture alpha from its position of stability. Currently trading around $45, Church & Dwight's stock is in a consolidation pattern at the top of a longer uptrend. If the stock breaks away from the current channel and surmounts the $45 resistance level, the next test will be the 52-week high of $46.29.
<<<
Consumer -
Altria -
Aptar -
Balchem -
Boston Beer -
Brown Forman -
Church + Dwight -
Diamond Foods -
Flowers Foods -
Hormel Foods -
J+J Snack Foods -
Lorillard -
McCormick -
McDonalds -
Mead Johnson Nutrition -
Nike -
Ralcorp -
Smucker -
Yum Brands -
I-Box list -
Link to Additional Stocks - http://investorshub.advfn.com/boards/board.aspx?board_id=22339
and Foreign Stock lists - http://investorshub.advfn.com/boards/board.aspx?board_id=22332
______________________________________________________________
CONSUMER -
******************
http://investorshub.advfn.com/boards/read_msg.aspx?message_id=66806564 (Charts)
http://investorshub.advfn.com/boards/read_msg.aspx?message_id=67589645 (Charts)
Altria (MO) - Tobacco products
Aptar Group (ATR) - Product dispensing systems
Balchem (BCPC) - Ingredients - food, nutritional, pharma, sterilization
Boston Beer (SAM) - Beer
Brown Forman (BF-B) - Distiller, Jack Daniels, many others
Church & Dwight (CHD) - Household + personal care products
Diamond Foods (DMND) - Snack foods, nuts
Flowers Foods (FLO) - Packaged bakery products
Hormel Foods (HRL) - Meat and food products
J+J Snack Foods (JJSF) - Snack foods
Lorrilard (LO) - Tobacco products
McCormick (MKC) - Food flavorings
McDonalds (MCD) - Fast food restaurants
Mead Johnson Nutrition (MJN) - Pediatric nutritional products
Nike (NIKE) - Footwear, apparel
Ralcorp (RAH) - Store brand food products
Smucker (SJM) - Food products
Yum Brands (YUM) - Fast food restaurants
______________________________________________________________
HEALTHCARE -
*********************
http://investorshub.advfn.com/boards/read_msg.aspx?message_id=67281541 (Charts)
Becton Dickinson (BDX) - Medical supplies, lab equipment
CR Bard (BCR) - Medical, surgical, diagnostic products
Express Scripts (ESRX) - Pharmacy benefit management services
Healthcare Services (HCSG) - Laundry and maintenance to healthcare facilities, dietary services
National Health Investors (NHI) - Healthcare facilities REIT
Neogen (NEOG) - Food safety testing, animal health
Omega Healthcare (OHI) - Healthcare facilities REIT
Owens & Minor (OMI) - Healthcare supply chain management services
Sigma Aldrich (SIAL) - Bio reagents, chemicals
Stericycle (SRCL) - Medical waste
Techne (TECH) - Research + clinical diagnostic products
______________________________________________________________
INDUSTRIAL -
******************
http://investorshub.advfn.com/boards/read_msg.aspx?message_id=67596441 (Charts)
Clarcor (CLC) - Filtration, packaging
Donaldson (DCI) - Filtration systems
Fastenal (FAST) - Industrial and construction supply distributor
Praxair (PX) - Industrial gases
WW Grainger (GWW) - Distributor of maintenance, repair, and operations supplies
______________________________________________________________
MISC -
*********
http://investorshub.advfn.com/boards/read_msg.aspx?message_id=67755353( Charts)
Clean Harbors (CLH) - Hazardous materials management
Danaher (DHR) - Conglomerate
Ecolab (ECL) - Cleaning + sanitizing products/programs
FMC Corp (FMC) - Chemicals for agro, industrial, consumer
Monroe Muffler Brake (MNRO) - Automotive maintenance services
Rayonier (RYN) - Cellulose fiber, timber, land, wood products
Sherwin Williams (SHW) - Paints and coatings
______________________________________________________________
OTHER SECTORS -
*************************
http://investorshub.advfn.com/boards/read_msg.aspx?message_id=67530014 (Charts)
Syngenta (SYT) - Agro chemicals (AGRO)
Goldcorp (GG) - Gold mining, other metals (MINING + METALS)
Buckle (BKE) - Retailer of apparel, footwear, accessories (RETAIL)
Raven Industries (RAVN) - Applied technologies (TECHNOLOGY)
CH Robinson Worldwide (CHRW) - Freight logistics (TRANSPORTATION)
______________________________________________________________
PACKAGING - CONTAINERS -
**************************************
http://investorshub.advfn.com/boards/read_msg.aspx?message_id=67530339 (Charts)
Ball Corp (BLL) - Packaging, aerospace
Crown Holdings (CCK) - Packaging, containers
Silgan Holdings (SLGN) - Packaging, containers
UFP Technologies (UFPT) - Packaging, component products
______________________________________________________________
SERVICES -
**************
http://investorshub.advfn.com/boards/read_msg.aspx?message_id=67530573 (Charts )
Exponent (EXPO) - Diverse consulting services
Rollins (ROL) - Pest control services
Waste Connections (WCN) - Waste services
______________________________________________________________
UTILITIES -
***************
http://investorshub.advfn.com/boards/read_msg.aspx?message_id=67281683 (Charts)
New Jersey Resources (NJR) - Gas utility
NSTAR (NST) - Electric utility
Piedmont Natural Gas (PNY) - Natural gas utility
South Jersey Industries (SJI) - Natural gas utility
WGL Holdings (WGL) - Natural gas utility
Wisconsin Energy (WEC) - Diversified utility
_______________________________________________________________
BEST FOREIGN -
**********************
http://investorshub.advfn.com/boards/read_msg.aspx?message_id=67398569 (Charts)
Ambev (ABV) - Beverages (Brazil)
Brazil Foods (BRFS) - Food products (Brazil)
British American Tobacco (BTI) - Tobacco products (UK)
Canadian National Railway (CNI) - Railroads (Canada)
Coca-Cola Femsa (KOF) - Coca-Cola beverages (Mexico)
Enbridge (ENB) - Oil and gas pipelines (Canada)
Fomex (FMX) - Beverages (Mexico)
Fortis (FRTSF.PK) - Electricity and natural gas utility (Canada)
Nestle (NSRGY.PK) - Food products (Switzerland)
Syngenta (SYT) - Agro chemicals (Switzerland)
TransCanada (TRP) - Oil and gas pipelines, electric power plants (Canada)
Misc -
Clean Harbors -
Danaher -
Ecolab -
FMC Corp -
Monroe Muffler Brake -
Rayonier -
Sherwin Williams -
Industrial -
Clarco -
Donaldson -
Fastenal -
Praxair -
WW Grainger -
Packaging - Containers -
Ball Corp -
Crown Holdings -
Silgan Holdings -
UFP Technologies -
Other Sectors -
Syngenta -
Goldcorp -
Buckle -
Raven Industries -
CH Robinson Worldwide -
BioPharma - more-
Aveo -
Bio-Rad -
Ligand -
Mid cap funds -
9.3
Scout Mid Cap Fund
UMBMX, Mid-Cap Blend
9.1
Nicholas Fund
NICSX, Mid-Cap Blend
8.4
Westport Select Cap Fund
WPSRX, Mid-Cap Blend
8.4
Principal MidCap Blend Fund
PEMGX, Mid-Cap Blend
8.4
Stewart Capital Mid Cap Fund
SCMFX, Mid-Cap Blend
8.3
Ave Maria Opportunity Fund
AVESX, Mid-Cap Blend
8.2
Ave Maria Catholic Values Fund
AVEMX, Mid-Cap Blend
8.2
FMI Common Stock Fund
FMIMX, Mid-Cap Blend
8.2
WHG Small MidCap Fund
WHGMX, Mid-Cap Blend
8.1
SIMT Tax-Managed Volatility Fund
TMMAX, Mid-Cap Blend
8.1
Fidelity Low Priced Stock Fund
FLPSX, Mid-Cap Blend
8.0
Paradigm Select Fund
PFSLX, Mid-Cap Blend
8.0
Tilson Dividend Fund
TILDX, Mid-Cap Blend
8.0
Invesco Endeavor Fund
ATDAX, Mid-Cap Blend
7.9
Lord Abbett Value Opportunities Fund
LVOAX, Mid-Cap Blend
7.8
Westport Fund
WPFRX, Mid-Cap Blend
7.8
Matthew 25 Fund
MXXVX, Mid-Cap Blend
7.8
California Investment Trust S&P Midcap Index Fund
SPMIX, Mid-Cap Blend
7.8
SEI Institutional Managed U.S. Managed Volatility Fund
SVOAX, Mid-Cap Blend
7.5
Vanguard Mid Cap Index Fund
VMCIX, Mid-Cap Blend
7.4
Vanguard Extended Market Index Fund
VEXMX, Mid-Cap Blend
7.4
Columbia Mid Cap Index Fund
NTIAX, Mid-Cap Blend
7.4
Dreyfus Mid Cap Index Fund
PESPX, Mid-Cap Blend
7.4
Kirr Marbach Partners Value Fund
KMVAX, Mid-Cap Blend
7.4
Managers Mid Cap Fund
MKPAX, Mid-Cap Blend
Consumer -
Colgate-Palmolive -
Dr Pepper Snapple -
General Mills -
Hansen Natural -
Mead Johnson Nutrition -
Panera Bread -
Pepsico -
Proctor & Gamble -
A board to discuss Basic Materials and Chemical Sector ideas -
___________________________________________________
Corteva (CTVA) - Seeds, agro chemicals (2018 merger of Dupont + Dow Agro) (45 Bil) - 1.0%
Linde PLC (LIN) - Industrial gases and engineering (164 Bil) (UK) ----------------------------- 1.4%
RPM International (RPM) - Coatings, sealants, building materials (11 Bil) ------------------- 1.9%
Sherwin Williams (SHW) - Paints and coatings (67 Bil) ------------------------------------------- 0.9%
UFP Industries (UFPI) - Wood and non-wood materials (6 Bil) ---------------------------------- 1.2%
___________________________________________________
BASIC MATERIALS -
Balchem (BCPC) - Chemicals, ingredients for food, nutritional, pharma, steriliz (1.6 Bil) - 0.5%
Berry Plastics Group (BERY) - Plastic packaging and engineered materials (3 Bil) -----
Chemtura (CHMT) - Specialty chemicals (1.8 Bil) ------------------------------------------------- 0%
Dupont (DD) - Chemicals (67 Bil) ----------------------------------------------------------------------- 2.5%
Lyondell Basell (LYB)-Chemicals, polymers, gasoline components(39 Bil)(Netherlands) 3.7%
PolyOne (POL) - Specialized polymer materials (4 Bil) ------------------------------------------- 0.8%
PPG Industries (PPG) - Coatings and specialty products (28 Bil) ----------------------------- 1.3%
Quaker Chemical (KWR) - Specialty chemicals (1.0 Bil) ----------------------------------------- 1.6%
RPM International (RPM) - Coatings, sealants, building materials (6 Bil) ------------------- 2.2%
Sherwin Williams (SHW) - Paints and coatings (20 Bil) ----------------------------------------- 1.0%
Valspar (VAL) - Coatings, paints (7 Bil) --------------------------------------------------------------- 1.3%
WD-40 Company (WDFC) - WD-40 and multi-purpose maintenance products (1.0 Bil) - 1.9%
WR Grace (GRA) - Specialty chemicals and materials (7 Bil) ----------------------------------- 0%
OTHER -
*************
AEP Industries (AEPI) - Plastic packaging films (412 mil)
Albermarle (ALB) - Diverse engineered specialty chemicals (6 Bil)
Hawkins (HWKN) - Chemicals for industrial and water treatment (420 mil)
HB Fuller (FUL) - Adhesives, sealants, and other specialty chemical products (2 Bil)
Oil-Dri Corp (ODC) - Sorbent products (200 mil)
Westlake Chemicals (WLK) - Chemicals, vinyls, polymers, fabricated building prods (6 Bil)
________________________________________________________________________
| Volume | |
| Day Range: | |
| Bid Price | |
| Ask Price | |
| Last Trade Time: |


