 News
News  Market Data
  Discover
Support: 888-992-3836
Copyright © 2023 InvestorsHub Inc.


Register for free to join our community of investors and share your ideas. You will also get access to streaming quotes, interactive charts, trades, portfolio, live options flow and more tools.
CHARTIST HOTLINE
Thursday, October 18, 2018
Stocks sold off sharply with the Dow giving up 327 points (-1.27%) while the Nasdaq fell -157.56 (-2.06%). The Actual Cash Account lost -1.38%. Declining stocks led by 3.25:1 on both the NYSE and Nasdaq.
There were 9 new highs and 245 new lows. One of the main worries has been the continuing slide in the Chinese stock market suggesting that its economy, which is slowing, will inevitably pull the global economy with it. Since Trump fired the first salvo of the potential trade war on January 26th, the Holler Chinese Index has fallen 33% while Shanghai has dropped 30%. The iShares China Large Cap (FXI) has fallen 28%, closing today at a 17-month low. The Benchmark S&P 500 is off 3.6% over the same period.
[color=red][/color]One consolation is the fact that all of the key indices of U.S. share prices are still holding above the recent October 11th lows, but in the majority of cases, just barely. The bears are holding the upper hand with the NYSE Composite, Russell 2000, S&P Midcap Index, Value Line Geometric and Nasdaq all below their respective 200 day moving averages.
In the Trader’s Portfolio, there were only 3 winners vs. 25 losers. Intuitive Surgical (ISRG) -3.8%, Take Two Software (TTWO) -3.9% and Activision Blizzard (ATVI) -8.3% were the hardest hit. None of the stocks in the Trader’s Portfolio closed below their mental stops in today’s session. It goes without saying that Traders should monitor mental stops closely in this environment.
Our advice for both long term investors and Traders is to continue to maintain all current positions.
Our next regular hotline is scheduled for Tuesday, October 23rd, 3:00 p.m., West Coast Time. However, we will have a hotline prior to that date if the Dow gains or loses 1% or more in a single session or if there are any changes in our models which remain positive at the present time.
Thank you for posting!
THE CHARTIST HOT LINE
Thursday, October 11, 2018
The averages were sharply lower again with the Dow losing 546 points -2.13%, S&P 500 -2.06% and Nasdaq -1.25%. The Actual Cash Account was -1.97%. Over the past three trading sessions the Dow has shed 1435 points.
Declining stocks outpaced advancing issues on the NYSE by a 3.7 to 1 margin and 2.7 to 1 on the Nasdaq.
With the S&P 500 down -7% since hitting an all-time high just three weeks ago and our Overbought/Oversold indicator at a heavily oversold reading of -5.64 we would expect a technical bounce to occur at any time.
Our long term models are still positive with our stop strategy in place.
In the Trader’s portfolio the Schwab MidCap (SCHM), Square (SQ), QQQ trust (QQQ) and the Consumer Discretionary Select (XLY) violated their mental stops and should now be sold. Also note that the Select Technology (XLK), Illumina (ILMN) and Netapp (NTAP) are close to their respective mental stops.
Our next regular hotline is scheduled for Tuesday, October 16th, 3:00 p.m., West Coast Time.
Thank you for posting the update.
CHARTIST HOTLINE
Wednesday, October 10, 2018
Whenever the Dow falls in excess of 1%, we update this hotline. Stocks were sharply lower all across the board in today’s session with the Dow dropping a resounding 831 points -3.15%. The S&P 500 fell 94.61 -3.28%, recording its worst single session loss since February 8th. The Actual Cash Account lost $38,911 -2.79%.
Declining stocks led by close to 8 to 1 on the NYSE and 7 to 1 on the Nasdaq. It’s not a pretty sight. In the Traders Portfolio there were two winners versus 31 losers. With Lululemon -5.71%, Align Technology, -5.78%, and Square -7.75% le leading on the downside. Traders should be aware that Align Technology (ALGN) and PayPal (PYPL) closed below their mental stops today and should now be sold. Several other traders’ recommendations are extremely close to their mental stops. So, in the absence of a sharp rally tomorrow, we can expect several violations of the respective mental stops.
Most indices close at their lows of the day with our overbought/oversold indicator hitting a heavily oversold -4.59%, which is the heaviest oversold reading since last February. We should be getting a technical bounce in the next day or two. Our models are still positive, and our advice for long term investors who are acting in sync with our Real Money Accounts is to continue to maintain all positions. Traders are advised to monitor the mental stops on a daily basis.
Our next regular hotline is scheduled for Thursday, October 11th, 3:00 p.m., West Coast Time
The 8 CHARTIST picks have the following.
1 PPO(50,200,0) POSITIVE
2 RSI(5) above 70
3 20 above 5 ema
4 50 above 20 ema
5 200 above 50 ema
6 52 WEEK HIGH
Tuesday, August 28, 2018
We remain in the bullish camp. Stocks finished virtually unchanged in today’s session with declining stocks holding an 11:10 advantage on the NYSE and decliners also led by about 28 issues on the Nasdaq. Today’s standstill comes on the heels of two strong sessions that saw most of the key indices completing yesterday’s session in record high territory.
We recommended the following 5 stocks and 3 ETF’s for traders with their mental stops over yesterday’s hotline:
Take Two Software (TTWO) 119.86
PayPal (PYPL) 79.40
Lululemon (LULU) 117.65
Humana (HUM) 293.03
Microsoft (MSFT) 97.26
iShares Russell 1000 (IWF) 140.56
Select Consumer Discretionary (XLY) 107.80
Select Healthcare (XLV) 82.29
   Start      Finish                % Change              Days
 12/4/1987  3/24/2000              582.15%               4,494
 3/9/2009   8/23/2018              322.30%               3,454
Tuesday, July 10, 2018
We now have eight recommendations for Traders -- five stocks and three ETFs. The following are the recommendations with their suggested mental stops.
Centene (CNC) 116.94
Illumina (ILMN) 256.52
Mastercard (MA) 180.36
Netapp (NTAP) 67.35
Sales Force (CRM) 124.58
iShares Russell 1000 Growth (IWF) 131.51
QQQ Trust (QQQ) 153.88
Select Technology (XLK) 63.15
Monday, June 11, 2018
We now have seven recommendations for Traders (with mental stops).
Align Tech (ALGN) 308.01
Autohome (ATHM) 99.13
Mastercard (MA) 170.65
Netflix (NFLX) 322.43
Red Hat (RHT) 150.45
Square (SQ) 52.43
Twitter (TWTR) 35.09.
5/10 New highs on the NYSE hit 152 yesterday, the
highest number since the end of January. On top
of this, the NYSE Advance/Decline Line (A/D) has
taken out its previous high set back on April 18th,
closing at all-time highs today. That’s a big plus
for the market. As you know, the A/D line in the
majority of instances has topped out well ahead of
the major averages at pivotal turning points
5/3 CHARTIST HOTLINE
Thursday, May 03, 2018
The Dow plunged almost 400 points in the early going, but reversed course to finish 5 points higher.
The S&P 500 also got hit hard early and it bounced back losing just -.23% on the day.
Both of these major indices successfully tested their downside support areas in today’s session.
The Dow found support again at approximately 23500 and the S&P 500 at 2580.
The S&P has held this support zone on five different occasions since February.
It remains locked in a trading range that has been in effect since early April.
The upper end is at 2785 and lower side at 2580.
4/24 CHARTIST HOTLINE
Tuesday, April 24, 2018
Stocks came under heavy selling pressure with Treasury Notes hitting 3% for the first time since January, 2014. The Dow lost 424.56 (-1.74%) while the Nasdaq gave up 121.25 (-1.70%). Declining stocks led by a ratio of 18:10 on the NYSE and 17:10 on the Nasdaq. Today marked the fourth consecutive trading session that had declining stocks in the lead.
There were 114 new lows on the NYSE, marking the third straight session above 100. There is no question that the surge in interest rates is impacting the market with an inverted yield curve becoming a distinct possibility. But remember what we said in the most recent edition of The Chartist: Negative yield curves are not useful for market timing but are an early warning indicator. On top of this, an inverted yield curve could still be months away.
All of the widely followed indices, with the exception of the Utilities, are still above their 200-day lines and, in the case of the Russell 2000, comfortably so. The S&P 500 and Dow are setting up for a test of 200-day lines in the next day or two. Once the 200-day lines are taken out, major support in evidence at the November lows could be in jeopardy.
The Actual Cash Account lost $14,847 (-1.13%) in today’s session. All 23 stocks in the Trader’s Portfolio finished lower led by Caterpillar (CAT), -6.20%. CAT finished 3.8% above its mental stop, while United Rentals (URI), -4.39%, is 2.2% away.
With our models in a positive mode, our advice for investors who are acting in sync with our real money accounts is to stay the course. Traders should be aware that LAM Research (LRCX) closed below its mental stop today and should now be sold.
Our next regular hotline is scheduled for Thursday, April 26th, 3:00 p.m., West Coast
from THE CHARTIST
The bottom line is that a negative yield curve is a
recession indicator and precedes the recession by
months. Negative yield curves are not useful for
market timing but are an early warning indicator.
On top of this, an inverted yield curve could still
be months away. In the meantime, it remains a
bull market until we see evidence to the contrary.
With our models in a positive mode, our advice for
investors who are acting in sync with our real
money accounts and traders is to stay the course
4/18/2018 $NYAD line made new higher high.
Bull market alive and well.
SPX peak at least 4 months away per THE CHARTIST.
CHARTIST HOTLINE
Thursday, April 12, 2018
Stocks finished higher buoyed by Trump’s toned down tweet that a military strike on Syria may not be imminent. The Dow +293 +1.2% led the way followed by the Nasdaq Composite +71.22 +1%. Advancing stocks led by 6 to 5 on the NYSE and 9 to 5 on the Nasdaq. The VIX closed at 18.54, its lowest level in 15 trading sessions.
Most of the widely followed indices are now comfortably above their 200 day lines and the S&P Midcaps and Russell 2000, are above their 50 day lines as well with the Value Line Geometric virtually on the line.
The high relative strength stocks gave a good account of themselves with 22 out of the 23 recommendations in the Traders Portfolio posting gains. All of the stocks in the Trader’s Portfolio are comfortably above their mental stops. They are all on the profit side of the ledger as well.
With our models in positive territory, our advice for both long term investors and traders is to continue to stay the course.
Our next regular hotline is scheduled for Tuesday, April 17th, 3:00 p.m., West Coast Time.
The next edition of The Chartist will be mailed on Friday, April 20th
The Chartist Overbought/Oversold indicator is the
19-day exponential moving average of the Value
Line Geometric. We use this index because it
tracks over 1,700 stocks and represents roughly
90% of the entire market.
Whenever the Value
Line Geometric falls 3% or more under its 19-day
exponential moving average, it reflects a heavily
oversold condition on an intermediate basis.
Conversely, a reading of +3.00 or greater suggests
an overbought market. A reading of -3% has
often caught the exact bottom of the selloff that
was in effect at the time.
While a reading of -3.00 weights the odds in favor
of a rally, there is no guarantee that the market
cannot fall to more extreme oversold levels. We
have used this indicator for decades and have
personally found it to be more helpful than the RSI
especially in oversold markets.
3/26 CHARTIST HOTLINE
Monday, March 26, 2018
The market posted its biggest gain since late August of 2015. The Nasdaq +227 points (+3.3%) led the way while the Dow picked up 669 points +2.8%. However, it was not a one way street. Between 9:40 and 11:20 East Coast Time, the market gave back a good portion of its earlier gains. From that point, it worked its way progressively higher into the close with all of the widely followed indices finishing the session at their highs of the day or just a tick away. Today’s rally was worldwide with China in the forefront. All of the International ETFs that we track, with the exception of Russia, were sharply higher.
For the time being, the key indices have successfully tested support. A snap back rally was certainly overdue with our overbought/oversold indicator in a heavily oversold condition on Friday at -3.41. When it hits -3.00 or more, it often marks a turning point, sometimes right to the day or within the next two to three trading sessions. As an example, the previous heavily overbought reading was on February 5th. The bottom was reached three days later. Going back still further, the previous heavily overbought reading on 6/27/16 marked the exact bottom of the pullback that was in effect at that time. The S&P 500 had lost over 5% over the previous two trading sessions.
The Actual Cash Account gained $30,346 (+2.39%) in today’s session. In the Trader’s Portfolio there were 27 winners and one loser. Adobe Systems +6.5% and Lam Research +6% led on the upside. On the downside, Shopify -3.1%. None of the stocks in the Trader’s Portfolio closed below their mental stops.
Whether we have turned the corner, given today’s sharp rally, remains to be seen, but it is certainly a step in the right direction. Bottom line, our models are positive. We remain in the bullish camp.
3/23 CHARTIST HOTLINE
Friday, March 23, 2018
Whenever the Dow rises or falls by more than one percent or we have new recommendations we automatically update this hotline.
The S&P 500 suffered its largest weekly loss in more than 2 years on concerns that a trade war and higher interest rates could substantially slow global growth.
Today, the Dow lost 425 points -1.77%, S&P 500 -2.10% and Nasdaq -2.43%. The Actual Cash Account dropped –1.87%.
Declining stocks outnumbered advancing issues by a 4 to 1 margin on the NYSE and 3.7 to 1 on the Nasdaq. The Chartist Overbought/Oversold indicator closed at an oversold reading of -3.41.
Short term support is in evidence at the market closing low on February 8th of this year at 2581.00 for the S&P 500.
None of the stocks in the Trader’s Portfolio violated their mental stops, but carefully monitor the stops over the coming days as some are getting close.
Our models are positive stay in a recommended 95% invested position.
Our next regular hotline is scheduled for Tuesday, March 27th, 3pm West Coast time.
2/26 With our models flashing a short term buy signal today, we are now recommending the following five stocks for Traders (with mental stops):
LAM Research (LRCX) 171.00
ServiceNow (NOW) 137.60
Shopify (SHOP) 122.17
Square (SQ) 40.72
Vale SA ADR (VALE) 12.34
CHARTIST on BITCOIN
Say It Ain’t So, Bitcoin As EWFF notes last month, one of the last things to happen in a mania is that investors, in hopes of earning outsized returns, become so sure the rise will continue that they borrow money to purchase the assets that are the object of their affection or they purchase assets that are levered up. In the stock market this conviction is now evident in the activity in leveraged ETFs. From late 2017 to mid-January, the ratio of assets in leveraged-long ETFs versus those in leveraged-short ETFs jumped from 2 times to nearly 4 times. This record is more than 34% higher than the prior extreme, set in early 2015. Bitcoin is another speculative juggernaut that demonstrates this principle.
As it registered its price peak on December 17 at $19,892, LendEDU, a consumer credit information website, completed a survey showing that 18% of buyers were funding their bitcoin purchases with credit card debt. Of those, 22% didTo say that bitcoin is not cooperating with these expectations is another understatement.
It is now down 54% from its December 17 top. Another very strong clue is how undaunted the body of bitcoin believers remains. In a recent article in the Daily Express (London), a bitcoin devotee calls the price decline into the middle of January “exciting.” The article is headlined, “Crytpocurrency will BOUNCE BACK.” Another widely followed “bitcoin bull” has repeatedly maintained that “the
$9,000 level marks a major Low.” His year-end 2018 price target is $25,000. Even retirement planners are jumping on the bandwagon. The bitcoin IRA also arrived in January, and its sponsors are super bullish.
According to the headline on the website bitcoinira.com, bitcoins price “Can Increase to $400,000.” An accompanying note cites the “billionaire” behind the forecast and adds, “major investors are predicting prices ranging from $28,000 in 12 Months to over $1 million by 2020.” In a Forbes magazine article, the bitcoin IRA founder says, “It’s time to look at saving for retirement as an exciting experience rather than a painstaking one.”
It may turn out to be “exciting, but for many operators it is recently become downright dangerous, as the post-peak scandal phase that EWFF discussed last month continues to use a wider and wider net. Among the latest discoveries is newly lost crypto coins valued at about $400 million at Coincheck, one of Japan’s biggest digital exchanges. As of last Saturday, the company was not sure how it lost the coins but it “has suspended most trading and withdrawals.”
The company is not alone. Bloomberg published this revealing expose on January 18: “Hackers Have Walked Off with About 14% of Big Digital Currencies.” The theft tally for all those initial coin offerings (ICOs) that EWFF discussed in September, October and December is not far behind. According to the consulting firm EY, more than 10% of ICO funds, worth roughly $400 million, have been stolen by hackers.
The farther bitcoin falls, the bigger the scandals will become. On Tuesday, the SEC froze the assets of a Texas-based initial coin offering that claimed to have raised more than $600 million. The SEC says, “AriseBank used celebrities to tout its fraudulent offering.” It was just three weeks ago that AriseBank announced the endorsement of former heavyweight boxing champ, Evander Holyfield. Among other things, it seems the firm’s president failed to mention in AriseBank’s offering statement that he served five years for felony robbery. Last month we maintained that for some, the journey from blockchain to chains and cell block will be a quick one.” Things are heading in that direction even faster than we thought.
Arista Networks (ANET) 206.60 worth following.
11/30 We now have eight recommendations (with mental stops) strictly for Traders cognizant of the risk:
Align Tech (ALGN) 223.56
Arista Networks (ANET) 206.60
Boeing (BA) 246.21
Caterpillar (CAT) 125.60
Intuitive Surgical (ISRG) 350.00
United Health Group (UNH) 202.70
United Rentals (URI) 141.36
Wynn Resorts (WYNN) 139.20
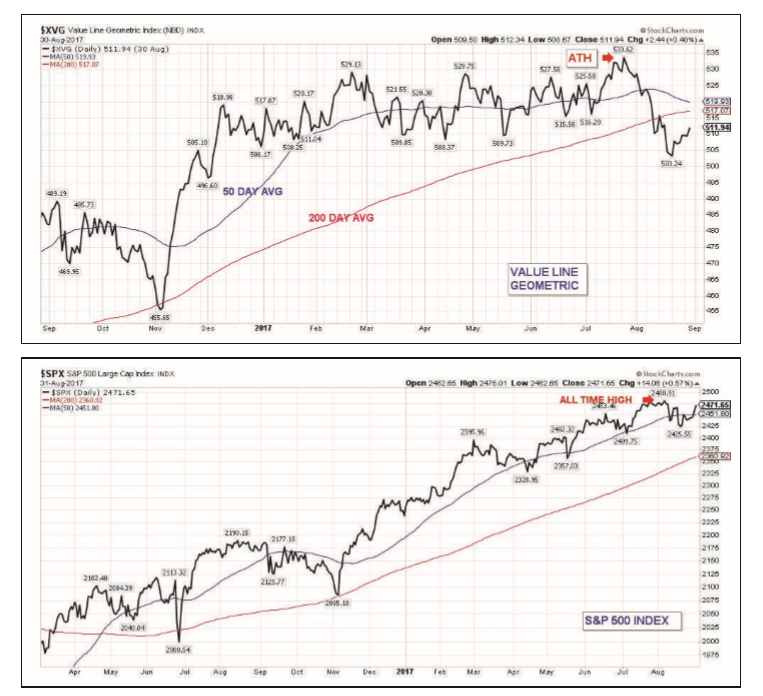
8/31/17 NYSE AD LINE
NYAD LINE PEAKS ABOUT 4 MONTHS BEFORE SP 500
8/31/17
Before the last bear market, the Value Line Geometric topped out on July 13, 2007, some 66 trading sessions ahead of the S&P 500.
The Russell 2000 also topped out on July 13th and failed to confirm the S&P 500 when it made its final sortie into record high territory in early October of 2007.
Note the all-important Advance/Decline Line was even earlier topping out on June 1, 2007, some 90 sessions ahead of the S&P 500.
The bottom line here is that it is still too early to draw any conclusions. It would be highly constructive for the stock market’s prospects to see all of its segments get
back in gear. We are not ruling this out. In fact, with our models in a highly positive mode, this is exactly what we expect to occur in the weeks ahead. As we said last time, we have yet to see the speculative excesses that historically take place during the final stages of bull markets. Our advice is to stay the course.
8/25/17 THE CHARTIST FIRST MENTAL STOP SELL OF 6/1/17 BUYS
CHARTIST LOSS OF - 13.8 % VS CCI 10 GAINS OF 7.9%
August 8th had all the elements of a key reversal day. The S&P 500 was at all-time highs in the early going, sporting a 10 point lead only to end up down six for the day.
There has been a dramatic shift in the price action of the large caps versus the small caps.
As of today’s close, the S&P 500 is 1.7% below its August 7th all-time highs,
while the Dow, which had previously set nine consecutive record highs, is 1.2% away from record high territory.
The small caps as measured by the Russell 2000 are telling a much different story. The Russell 2000 peaked on July 25th some nine trading sessions ahead of the S&P and Dow and has proceeded to lose 5.4% in the interim. It has not only taken out its 50 DMA, but is right on the verge of dropping below the 200 day line as well.
The small-caps’ recent weakness is not welcome news because they have a history of leading the market in both directions.
7/20 In fact, the lower the corrective activity in a given year, the less likely a bear market year will follow. This has been the case since 1988. The last two bear market years -- 2008 and 2001 -- had corrective activity of at least 10% the year before.
www.HilltopSecurities.com; Editor, Mark J. Grant We are the world's largest importer of oil and yet we are also, now, the biggest owner of oil reserves on the planet. There is something very wrong with this picture. We need to throw our domestic oil production into high gear so that we are not just oil self-dependent but so that we become the biggest exporter of oil to the world and replace the often hostile intentions of OPEC, and their producing nations. We can do this, and we should do this!
This is one aspect of the picture. It is not just cost, however, but increasing America's production that should be the key to our strategy. The United States can be the dominant oil exporter if we just put our minds and our taxes and our regulations in the correct place.
Costs of Producing a Barrel of Oil and Natural Gas U.S. Shale U.S.
Non-Shale
Gross Taxes.......     $6.42     $5.03
  Capital Spending     $7.56     $7.70
  Production Costs     $5.85     $5.15
  Admin/Trans          $3.52     $3.11
  Total               $23.25    $20.99
Libya......      $184.00
  Iran ......... $131.00
 Russia......... $105.20
 Saudi Arabia....$104.00
 Iraq ...........$101.00
7/20 In fact, the lower the corrective activity in a given year, the less likely a bear market year will follow. This has been the case since 1988. The last two bear market years -- 2008 and 2001 -- had corrective activity of at least 10% the year before.
www.HilltopSecurities.com; Editor, Mark J. Grant We are the world's largest importer of oil and yet we are also, now, the biggest owner of oil reserves on the planet. There is something very wrong with this picture. We need to throw our domestic oil production into high gear so that we are not just oil self-dependent but so that we become the biggest exporter of oil to the world and replace the often hostile intentions of OPEC, and their producing nations. We can do this, and we should do this!
This is one aspect of the picture. It is not just cost, however, but increasing America's production that should be the key to our strategy. The United States can be the dominant oil exporter if we just put our minds and our taxes and our regulations in the correct place.
Costs of Producing a Barrel of Oil and Natural Gas U.S. Shale U.S. Non-Shale Gross Taxes $6.42 $5.03 Capital Spending $7.56 $7.70 Production Costs $5.85 $5.15 Admin/Trans $3.52 $3.11 Total $23.25 $20.99 *Data from the WSJ on 4/15/16
You see, as exemplified below, the difference is that America is not supporting our government or our social programs from oil and natural gas. This is the striking difference between America's position and the financial position of the OPEC producers and Russia. This is where we can turn up the heat and the heat, in my view, should be turned up and as rapidly as possible.
Breakeven Oil Price by Country Libya $184.00 Iran $131.00 Russia $105.20 Saudi Arabia $104.00 Iraq $101.00 *Data provided by Reuters
We can break the backs of the OPEC nations, many of whom are funding terrorism. We can improve our oil technologies further, and bring Down our costs. We can start supplying Europe with oil and natural gas and cut their dependence on Russia. We can balance our budget and even, possibly, start cutting the budget deficit, if we expand our oil production and start exporting oil and natural gas to the world. We can change the balance of power in our favor
6/29/1Remember, the function of a bull market is to suck everyone in at the top, which brings up the obvious question: Are we there yet? We don’t think so. Volatility is picking up and appears to be weighted to the downside. At press time, the S&P 500, S&P Midcap Index, Dow and Russell 2000 were still above their respective 50 day moving averages (DMA), while the Nasdaq composite is a couple ticks below.
However, the burden of proof is still on the shoulders of the bears. The chart patterns of all of the widely followed averages are clearly bullish. For this to change, we would have to see the 50 day lines of the key indices broken along with penetration of support in evidence at the May 17th intraday lows. The benchmark S&P 500 lost 1.8% on that date, which was the biggest hit it had taken since September of last year. A rally started the next day with the S&P 500 posting seven consecutive winning sessions setting new all-time highs in the process. The numbers to watch are
S&P 500 2,356, Dow 20,601, S&P Midcap Index 1,693, Russell 2000 1,355.
With our models in a positive mode, our advice for long-term investors and traders is to maintain current positions.
6/8/17 As you know the period between May 1st and October 31st is historically the worst six months of the year. We have never been a fan of the “sell in May and go away.” However, we cannot argue with the fact that since 1950 the DJIA has had an average return of only 0.3% during the May-October period compared with a gain of 7.5% during the November-April period.
However, it is interesting to note that when the S&P gains 7.5% or more through Day 100, the worst six months of the year were not all that bad. As you can see by the printout, the Dow gained an average of 4.3%, which is actually above average for a six-month period because dividends were not factored in.
In our opinion, the first 100 days represent a viable strategy.
$XVG $SPX $RUT $COMPQ $INDU $MID
5/19 The stage now appears to be set for a test of near term support that is in evidence at the March 27th intraday lows.
This is where the majority of indices recorded their most recent lows. The numbers to watch:
Dow 20,412,
S&P 500 2,322,
S&P Midcap Index 1,673,
Value Line Geometric 505,
Nasdaq Composite 5,769,
and Russell 2000 1,335.
[img]www.stockcharts.com/c-sc/sc?s=%24MID&p=D&b=5&g=0&i=p81320757461&a=525070633&r=661
[/img]
5/19 The stage now appears to be set for a test of near term support that is in evidence at the March 27th intraday lows.
This is where the majority of indices recorded their most recent lows. The numbers to watch:
Dow 20,412,
S&P 500 2,322,
S&P Midcap Index 1,673,
Value Line Geometric 505,
Nasdaq Composite 5,769,
and Russell 2000 1,335.
Major Markets Poised to Break Higher - 5.8.17
Paris Accord Talks This Week<<<<----------
how is it going this morning ????? 'TRADING CHARTIST'
really ????? that is strong indicators.'TRADING CHARTIST'
|
Followers
|
5
|
Posters
|
|
|
Posts (Today)
|
0
|
Posts (Total)
|
227
|
|
Created
|
01/15/15
|
Type
|
Premium
|
| Moderators | |||
| Volume | |
| Day Range: | |
| Bid Price | |
| Ask Price | |
| Last Trade Time: |


