 News
News  Market Data
  Discover
Support: 888-992-3836
Copyright © 2023 InvestorsHub Inc.


Register for free to join our community of investors and share your ideas. You will also get access to streaming quotes, interactive charts, trades, portfolio, live options flow and more tools.
$SRNA
WEED STOCK. PROFITABLE OTC sitting at .12. Just finished the cup and handle formation. I see $1 soon. .5 easy in days or weeks depending on volume.
Financials mid March. Just closed largest contract ever
I'm surprised no one has mentioned $PTHRF. Pantheon has just announced a hug billion barrel strike on the north slope in Alaska, which lies near the Alaskan pipeline. It will be profitable at $30.BBL, which is so much better than oil from fracing. Expected production is at 90,000/day. And it's down to 0.201 now. Perfect timing. Jim
$BRZL Could Be The Next Penny RM Runner!!!
HALB .0035 Looking for copper next week!
$MWK: Mohawk Group (NASDAQ: MWK) beginning of the bounce higher as we noted in our article yesterday. Shares up 7.28% to $3.81. Chart looks very bullish. MACD bullish crossover, stochastics close to bullish cross, RSI coming out of oversold territory.
https://spotlightgrowth.com/index.php/2020/03/03/6-reasons-why-mohawk-group-holdings-inc-nasdaq-mwk-is-ripe-for-a-squeeze/
$DGIF check it out www.D7Enterprises.com I think this one can be a winner
$DBMM On Major Breakout Watch!!!!
$UNRG & $ADIA Custodian/Shell Plays Ready To Run_Into_Court_Dates!
$UNRG Custodian Date: 10/04/19
$ADIA Custodian Hearing: 11/09/19
========================================================================
Custodian Shell Plays
$PBEC $GRYO $GNXP $REOS $DWIS $DKMR $ADIA $EVTP $AAST $TNPH $MCTC $CSOL $YBIN
$DCGD
David Lazar Shell Plays
$SHNL $PEIW $GLFW $OCBG $TRDX $REPO $IDAD $FHAI $NTAH
$XNNHQ $MSHFQ $CERPQ $ESRG $HIGR $WDIS $TTCS $WSGF $EROZ
$VDPH $USRI $SIPN $INNX $PFMS $NXPC $ILXP $DIEN $CRGE
Sub-Penny Bottom Play Ready To Run!
$AHIX $APTY $APYP $BBDA $BGFT $BMXC $BOTY $BTFL $CBDD $CLKA
$CMGO $COBI $DNAD $DRNG $ERBB $ETEK $FTEG $FTWS $GOIG $GXXM $HMNY
$LBSR $MJTV $NOUV $PCLI $PTOP $QSIM $RETC $SBES $SDVI $SRMX $TPNI
$TTCM $USMJ $VGID $LIBE
=================================================
#davidlazar #reversemerger #mj #marijuana #hemp #custodian #custodianship
#merger #pennystocks $DCGD $ZMRK $KRFG $PASO $fcel $ACRL $PAOG $LAHO $VRUS
$VYST $SHMP $NWBO $ADIA $CNWHF $HMLA $ADIA #marijuanastocks
Most Read Boards
$DCGD $FNMA $AVXL $COOP $AXXA $LIBE $CDIX $SNDD
$VYST $RNVA $NWBO $DEWM $PACV $VRUS $UNRG $KBLB
$LAHO $CVSI $FUNN $TTCM $TMDI $HDII $CLSI $PRED
$CNWHF $TRDX $LWLG $BIEL $EMPM $LFAP $HMLA $SFIO
$SOLI $HMNY $LQMT $FLES $PFMS $PCTL $CVM $IMTL
$DKSC $IPIX $VATE $RXMD $KGKG $CMGO $ACRL $PMCB
$MSHFQ Next Monster MERGER Play!!! David_Lazar_Shell_Play!
$VYST Don't get caught without shares when acquisition news hits... Then it will be off to ChaseVille...GLTA
$TRBO is the one to be watching super undervalued IMO
$NDYN Chart gearing up for massive run. No_Toxic_Debt!
$MJTV Copperville On The Way! Soon When News Drops!
ADOM Probably want to grab a slice of this.
https://finance.yahoo.com/news/adomani-r-reports-first-quarter-200500409.html
from call:
''we would be well positioned to meet or exceed analyst consensus revenue estimates for full year 2019. Moreover, we continue to believe that, if we are able to effectively execute our business plan and capitalize on the opportunities that are presented to us, we will be profitable by 2020. We also feel that we have adequate cash to fund us to profitability.''
Conference Call Replay Information
Toll-free: 877-481-4010
$MJTV Under Accumulation Bottom Play- Bullish_Chart--->>
Chart
https://www.barchart.com/stocks/quotes/MJTV/technical-chart?plot=BAR&volume=total&data=DO&density=M&pricesOn=1&asPctChange=0&logscale=0&indicators=SMA(10);SMA(50);SMA(200);RSI(14,100);ACCUM;MFI(14,100)&sym=MJTV&grid=1&height=500&studyheight=100
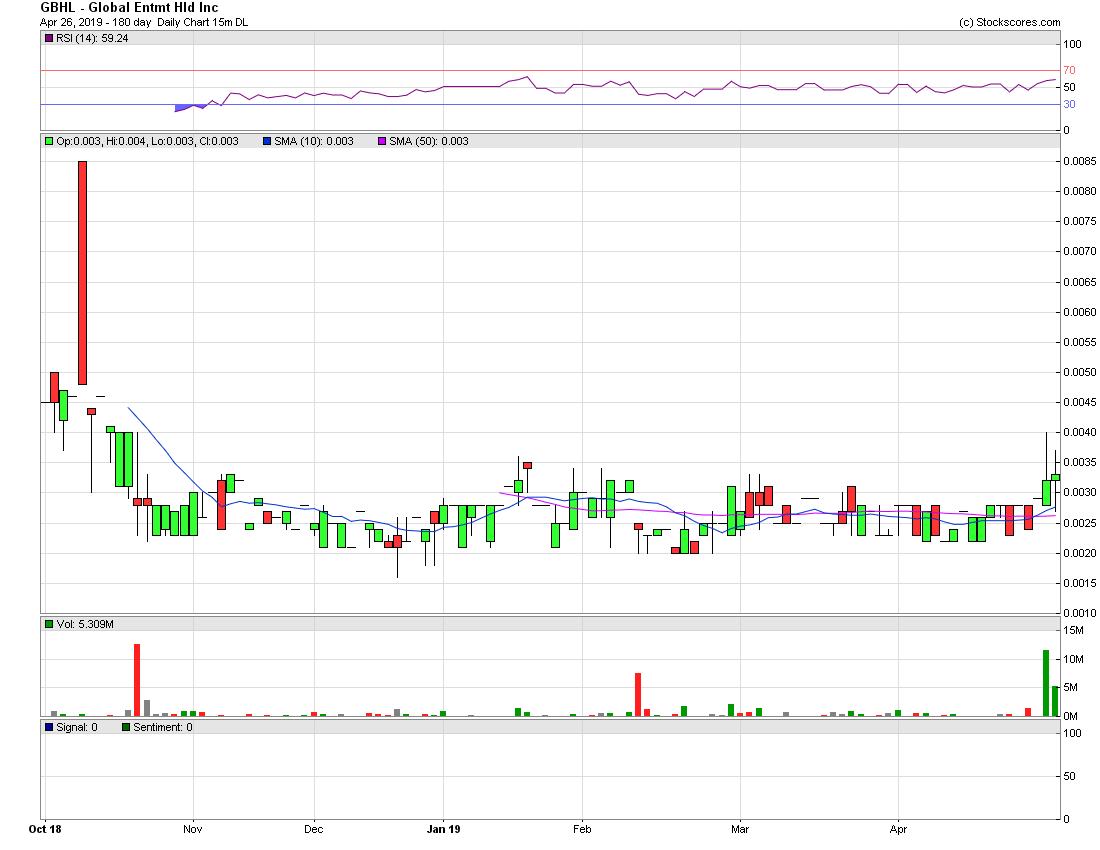
$GBHL On Breakout Watch! Attorney Letter Out-->>
SDVI @.002 merger completed and big rise today. JMO!
$ORRV Shell for Reverse Merger changing to $MCUS after. McCusker Holding Company Private, buying up other companies left and right.
Why is it a diamond in the rough? People don't realize yet that $ORRV is part of the McCusker Co. press releases.
DD:
https://twitter.com/mccuskerco
PR:
http://www.marketwired.com/press-release/mccusker-holding-corp-announces-letter-intent-merge-with-oceanic-research-recovery-inc-otc-pink-orrv-2186522.htm
ORRV ALREADY LISTED ON MCCUSKER HOLDING WEBSITE AS BEING MERGED
http://www.mccuskerco.com/our_companies
TXTM about to be run by the largest group i know. get in while its low!
AEPP about to explode! lowest float in town. Go look!
RSII run about to start. BUD BUILDING!
RSII OMG get your .0009s while yu can! SS OS under 400mil and float under 300 mil!
They JUST went current and will be showing revenue numbers soon from newly acquired summerfilms movies
$CHRO: Top 5 Smart Devices for your Home Automation
$SURE: tiny floater, super thin!
$EPGL to da moon lol! Nice Board and marked! Keep up the good work!
EPGL, non dilutive awareness campaign starts April 8th. Listen to conference call at http://www.epglmed.com
$EPGL -> Official announcement next week with CooperVision authorization!
EPGL .04 must get on watch lists this coming week.
To .0012
Top IP lawyers drafting multiples of joint IP with(EPGL+ AT&T) and (EPGL+CooperVision) as well! Many more publications will emerge! A % of these will be granted by the USPTO!!!
This is the sign the potential of billions in ongoing revenues though licensing and royalties is real, very real.
Claims have beat Google and Novartis in priority status it appears.
$EPGL now has MULTIPLE Patent Applications Published! Check it out!!!
PIEZOELECTRIC SENSOR FOR VISION CORRECTION
Pub. No.: WO/2015/123616
Publication Date: 8/20/2015
Filed 02/13/2014
https://patentscope.wipo.int/search/en/detail.jsf;jsessionid=DD785682D9B82BBBC85C0C645216E285.wapp1nB?docId=WO2015123616&recNum=1&maxRec=&office=&prevFilter=&sortOption=&queryString=&tab=PCT+Biblio
SYSTEM AND METHOD FOR CONTACT LENS WIRELESS COMMUNICATION
Pub. No.: WO/2015/148735
Published 10/1/2015
Filed 03/25/2014
https://patentscope.wipo.int/search/en/detail.jsf?docId=WO2015148735&recNum=2&maxRec=2079&office=&prevFilter=&sortOption=Pub+Date+Desc&queryString=david+markus&tab=PCT+Biblio
These newly discovered public records of actual $EPGL filings with details is NEW INFORMATION that many have been wanting to see. It's verification that EPGL is credible in what it says it is doing. EPGL Investors now have more information than ever about what the company has been working on and these are just two of many #patents pending. #Autofocus #SmartContactLens
Looking back at EPGL and the updates they have been 100% truthful over the last 2 years as they have been telling us they have been filing multiples of patent applications, this is absolute proof they have been truthful to shareholders. It's great to be an EPGL shareholder!!
More patent applications will emerge, USPTO will grant a % of the multiples of patents currently and forthcoming in the future, licensing deals will happen and 1st one anticipated here in 2015, more development deals can also come at anytime as negotiations with unnamed suitors have been going on, so far EPGL has multiples of real development agreements with CooperVision, Intel, and AT&T. With zero dilution, zero debt, and Billion dollar companies paying for R&D and also filing joint patents with EPGL, we will not trade this low .05 cent range much longer. Smart money will jump in sooner than later.
I continue to say $EPGL will trade $1.00+ in the future. Going to happen :)
Another $EPGL Patent Application Published! SYSTEM AND METHOD FOR CONTACT LENS WIRELESS COMMUNICATION
$EPGL #smartcontactlens #wearables #IoT #CooperVision #PublishedPatent
CROSS-REFERENCE TO RELATED APPLICATIONS
This application claims the benefit of US Provisional Patent Application No 61/970,335, filed on 03/25/2014, and incorporated herein by reference.
STATEMENT REGARDING FEDERALLY SPONSORED RESEARCH AND DEVELOPMENT
Not Applicable.
FIELD OF THE INVENTION
This invention relates generally to wireless communication with a contact lens, and more particularly, to a system and method for transferring data from a contact lens using radio frequencies.
DISCUSSION OF RELATED ART
Wireless transmission of data varies greatly, from one-way broadcast systems such as radio and television signals to two way systems such as Wi-Fi and cellular signals. One type of wireless transmission, radio-frequency identification, or RFID, utilizes electromagnetic or electrostatic fields to transfer data. An RFID device utilizes an antenna and a transceiver to read the radio frequency and transfer information to an external device, and a transponder, or tag, which contains the circuitry of the RFID and the data to be transmitted.
RFID is advantageous over other types of wireless transmission in that it does not require a power source to transmit data. Consequently, RFID transmission is limited to a short range and limited data transfer. As such, RFID is most commonly used for automatically identifying and tracking tags attached to objects, such as clothing, livestock, pets, assembly lines, pharmaceuticals, etc. Powered RFID systems can solve many of the unpowered RFID shortcomings by increasing range and reduced interference.
The human eye, in very simplistic terms, is adapted to provide vision by detecting and converting light into electrical impulses for the brain. While the human eye is extremely intricate and precise, the image produced often needs correction. The most common type of vision correction includes glasses and/or contact lenses, which are used to improve vision by correcting refractive error. This is done by directly focusing the light so that it enters the eye with the proper intensity.
While radio frequency technology has made its way into several industries, size and interference constrains have prevented them from entering into fields such as contact lenses, where size limitations are paramount. Therefore, there is a continued need for a vision correction device which makes use of wireless transmissions and/or wireless charging to transfer data between the vision correction device and an external device.
SUMMARY OF THE INVENTION
The present invention will provide a vision correction device which makes use of wireless transmissions and/or wireless charging to transfer data between the vision correction device and an external device. More specifically, the present invention will incorporate radio frequency technology onto a contact lens, including passive and active embodiments, and may further include wireless charging capability. This is
accomplished by positioning an extremely small RF device onto a contact lens, along with an antenna and/or battery, and using a fluid medium to enhance the signal to and from an external device.
When in use, the RF device is adapted to provide identifying information, such as which batch a lens is from and when it was manufactured. Furthermore, the RF device is adapted to notify the user when it is time to dispose of the contact lens, either from time or usage statistics. The RFID device will transmit this information either passively or actively to an external device, providing the user with invaluable information relating to their vision. The RF device can further communicate charging information such as charging states, charging rate, and other relevant information when wireless charging is used.
These and other objectives of the present invention will become obvious to those of ordinary skill in the art after reading the following detailed description of the preferred embodiments. It is to be understood that the foregoing general description and the following detailed description are exemplary, and are intended to provide further explanation of the invention as claimed.
DESCRIPTION OF THE DRAWINGS
FIG. 1 is a diagram illustrating the wireless communication device and contact lens within an external device;
FIG. 2 is a diagram illustrating the antenna, microprocessor, and power source of the contact lens within an external device;
FIG. 3 is a diagram illustrating the method of using the present invention.
DETAILED DESCRIPTION OF THE PREFERRED EMBODIMENT
Illustrative embodiments of the invention are described below. The following explanation provides specific details for a thorough understanding of and enabling
description for these embodiments. One skilled in the art will understand that the invention may be practiced without such details. In other instances, well-known structures and functions have not been shown or described in detail to avoid
unnecessarily obscuring the description of the embodiments.
Unless the context clearly requires otherwise, throughout the description and the claims, the words "comprise," "comprising," and the like are to be construed in an inclusive sense as opposed to an exclusive or exhaustive sense; that is to say, in the sense of "including, but not limited to." Words using the singular or plural number also include the plural or singular number respectively. Additionally, the words "herein," "above," "below" and words of similar import, when used in this application, shall refer to this application as a whole and not to any particular portions of this application. When the claims use the word "or" in reference to a list of two or more items, that word covers all of the following interpretations of the word: any of the items in the list, all of the items in the list and any combination of the items in the list.
The present invention comprises one or a plurality of contact lenses 20, a wireless communication device 30, an antenna assembly 40, 41, a fluid medium 50, and an external device 60. More specifically, the wireless communication device 30 and the antenna assembly 40, 41 are positioned on the external device 60, while the external device 60 is not in in physical contact with the contact lens 20, but is in fluid contact with the contact lens 20 through the fluid medium 50. When in use, the wireless
communication device 30 is adapted to interact with the antenna assembly 40, 41 to
communicate with the external device 60 through the fluid medium 50. The wireless communication device 30 may be read-only, having a unique key or data sequence, or may be read/write, where data can be written into the wireless communication device 30.
The wireless communication device 30 is positioned on the outer edge of the contact lens 20 and is adapted to send and/or receive wireless data to/from the external device 60 through the fluid medium 50. In the preferred embodiment, the wireless communication device 30 is a passive tag RFID device. More specifically, the wireless communication device 30 is a passive tag RFID device adapted to operate without a power source 31. The wireless communication device 30 is activated when a signal is received from the external device 60. The signal will power the passive RFID device, which will then begin transmitting data. Advantages of a passive tag RFID device include a smaller size and no power requirements, which are paramount with dealing with contact lenses.
In an alternative embodiment, an active tag RFID (powered) device is used. Here, a small battery or capacitor 31 is positioned on the outer edge of the contact lens 20 in electrical communication with the wireless communication device 30 and operates to provide power for transmitting data through the wireless communication device 30. Advantages of an active tag RFID device include longer ranges, improved response time, less interference, and lower radiation. In yet a further alternative embodiment, the wireless communication device 30 is adapted to charge a battery or capacitor 31 used for powering a microprocessor chip 32. Here, the wireless communication device 30 will receive radio frequencies from the external device 60, convert these radio frequencies into electrical energy, and store this electrical energy in the capacitor or battery 31. The energy requirements are low, however, and said battery or capacitor 31 may be easily charged wirelessly in this manner.
The antenna assembly 40, 41 operates to receive data and other radio frequencies, as well as facilitate the transfer of data between the wireless communication device 30 and the external device 60. A first, or top, antenna 40 is positioned in the cap 61, while a second, or bottom, antenna 41 is positioned in the external device 60 adjacent to the fluid chamber 62. In an alternative embodiment, a lens antenna 33 is positioned on the perimeter of the contact lens 20 in electrical communication with the wireless
communication device 30, outside of the view of the user. In all embodiment, the lens antenna 33, as well as the wireless communication device 30 and/or battery 31, will not be visible by the user. The antennas is adapted to amplify signals send and received greatly, as these signals are used to activate the wireless communication device 30.
The fluid medium 50 between the contact lens 20 and the external device 60 operates to amplify the RF signals from 1 - 10 times. The fluid medium 50 also acts as a
disinfectant and improves surface wetablility and comfort of the contact lenses 20 during storage in the external device 60. In the preferred embodiment, the fluid medium 50 may be saline water. By utilizing the fluid medium 50, short distance communication between the contact lens 20 and the external case 60 can range from 0.1 mm to 1 cm.
The external device 60 is used to transmit data and/or power to the contact lens 20. In the preferred embodiment, the external device 60 is a contact lens case further comprising a cap 61 and fluid chamber 62, where the contact lens 20 may be stored for 1- 8 hours daily. Due to the long storage periods, the external device 60 and contact lens 20 may transmit data and energy even at low transfer speeds or energy levels. For example, data collected during use can be transferred from a microprocessor 32 in the contact lens 20 to the external device 60 at extremely low speeds. Also, energy can be transferred from the external device 60 to the battery or capacitor 32 for wireless charging, thus enabling the external device 60 to operate as a power outlet. Lastly, miscellaneous information such as identification numbers (RFID), logged usage data, and user data (blinking, light exposure) can be transmitted from the contact lens 20 to the external device 60 during this time. For example, the present invention may monitor time used and count usage cycles to notify the user when the contact lens 20 needs replacement or care. As mentioned above, the external device 60 will further comprise an antenna assembly 40, 41 to communicate with the contact lens 20 with less interference, both for data and wireless charging, and the external device 60 will enclose the contact lens 20 in a fluid chamber 62, further reducing interference and increasing the reliability of the
transmission.
When in use, the wireless communication device 30 will receive a message from the external device 60, or an interrogation message, once it is in range. In the passive embodiment, the signal strength of the interrogation message will activate the wireless communication device 30. The wireless communication device 30 will authenticate this
interrogation message and will respond with identification or other data once
authenticated. Alternatively, with an active Tag RFID, the wireless communication device 30 will broadcast an interrogation message, where the external device 60 will receive the message for authentication. In a further alternative embodiment, the interrogation message will operate to wake the wireless communication device 30 from a sleeping state, which will then begin to transmit data with the external device 60 once authenticated.
In the preferred embodiment, the wireless communication device 30 is adapted to fit on the perimeter of a contact lens 20. As such, the size of the wireless communication device 30 will be within the range of .05 mm x .05 mm. The wireless communication will operate in a frequency range of 10 kHz- 100 MHz. The wireless communication device 30 is adapted to communicate at a range of 1 cm-1 m. In the alternative embodiment, where an active tag RFID is used with a battery source 31 , the frequency range increases to 10 kHz-5GHz, with a range of 1 cm-lOOm.
In a further alternative embodiment, a piezoelectric sensor is used to receive a frequency within a specific range for data transmission or wireless charging. The piezoelectric sensor is sensitive enough to distinguish frequencies, and is adapted to receive only frequencies which can communicate with the wireless communication device 30. The piezoelectric sensor may comprise synthetic piezoelectric ceramics including, but not limited to, barium titanate, lead titanate, lead zirconate titanate, potassium niobate, lithium niobate, lithium tantalite, sodium tungstate, and zinc oxide. Alternatively, the piezoelectric sensor may comprise a polymer piezoelectric such as polyvinylidene fluoride. Lastly, biological piezoelectrics can be used including bone, tendon, silk, wood, enamel, dentin, DNA, and viral protein such as bacteriophage.
In yet a further alternative embodiment, a vibration sensor may be implemented to activate the wireless communication device 30. Here, either a battery 31 or a
piezoelectric sensor is adapted to produce an electrical charge when the vibrational sensor is triggered. The vibration sensor can be triggered when the contact lens 20 is removed from the eye or removed from the external device 60. Once a vibration, or lack thereof, is sensed, the vibrational sensor will activate the wireless communication device 30.
In still a further alternative embodiment, the present invention may be paired with a piezoelectric energy harvesting device for powering the wireless communication device 30 and/or vibration sensor. Energy can be harvested from the movement of the eye, blinking, body movement, or other source. A battery or capacitor 31 may be provided to receive and store this energy.
When in use, the user will place a contact lens 20 within an external storage device 60. An interrogation message will be received from the external device 60, which is then authenticated within the contact lens 20. After authentication, wireless data transmission and/or wireless charging may begin between the contact lens 20 and external device 60. This communication and/or charging may last between 2-8 hours, providing ample time for charging and information transfer.
The present invention is manufactured such that the components work in conjunction to provide data transmission and/or wireless charging with an external storage device 60. The method of manufacturing the present invention comprises first electrically connecting the wireless communication device 30 with any microprocessors 32, antennas 33, and/or power sources 31, creating a wireless communication circuit. In the preferred embodiment, any transparent materials may be used to reduce obstructing the vision of the user.
Once the wireless communication circuit is created, it is placed directly into a contact lens mold member, preferably the female mold member, or first (anterior) contact lens mold member. The placement would occur preferably robotically and be coupled with a means of centering the assembly and a means of controlling the depth of the assembly during the filling of the mold with a lens precursor material, which can be understood to be a polymerizable silicone hydrogel lens precursor composition. The polymerizable silicone hydrogel lens precursor composition may be understood to be a pre-polymerized or pre-cured composition suitable for polymerization. In alternative embodiments, the lens precursor material may be comprised of silicone, hydrogel, polyimide, kapton, parylene, or SU-8. Non-stretchable lens precursor materials comprise metals, ceramics, and crystals.
The first contact lens mold member is placed in contact with a second contact lens mold member to form a contact lens mold having a contact lens shaped cavity. Next, the two contact lens mold members are placed in contact with one another to form a contact lens shaped cavity, with the polymerizable silicone hydrogel lens precursor composition and wireless communication circuit positioned within the contact lens shaped cavity. The polymerizable silicone hydrogel lens precursor composition is then cured to form a pre-extracted polymerized silicone hydrogel contact lens product. The contact lens mold is then demolded, where the two mold members are separated. The pre-extracted polymerized silicone hydrogel contact lens product is then separated from the contact lens mold members, or delensed. After delensing, the pre-extracted silicone hydrogel contact lens product is extracted. After extraction, the extracted polymerized silicone hydrogel contact lens product is hydrated with water or an aqueous solution to form a hydrated silicone hydrogel contact lens.
While the above description contains specific details regarding certain elements, sizes, and other teachings, it is understood that embodiments of the invention or any combination of them may be practiced without these specific details. Specifically, although certain materials and shapes are designated in the above embodiments, any suitable materials or shape may be used. These details should not be construed as limitations on the scope of any embodiment, but merely as exemplifications of the presently preferred embodiments. In other instances, well known structures, elements, and techniques have not been shown to clearly explain the details of the invention.
The above detailed description of the embodiments of the invention is not intended to be exhaustive or to limit the invention to the precise form disclosed above or to the particular field of usage mentioned in this disclosure. While specific embodiments of, and examples for, the invention are described above for illustrative purposes, various equivalent modifications are possible within the scope of the invention, as those skilled in the relevant art will recognize. Also, the teachings of the invention provided herein can be applied to other systems, not necessarily the system described above. The elements and acts of the various embodiments described above can be combined to provide further embodiments.
Changes can be made to the invention in light of the above "Detailed Description." While the above description details certain embodiments of the invention and describes the best mode contemplated, no matter how detailed the above appears in text, the invention can be practiced in many ways. Therefore, implementation details may vary considerably while still being encompassed by the invention disclosed herein. As noted above, particular terminology used when describing certain features or aspects of the invention should not be taken to imply that the terminology is being redefined herein to be restricted to any specific characteristics, features, or aspects of the invention with which that terminology is associated.
While certain aspects of the invention are presented below in certain claim forms, the inventor contemplates the various aspects of the invention in any number of claim forms. Accordingly, the inventor reserves the right to add additional claims after filing the application to pursue such additional claim forms for other aspects of the invention.
https://patentscope.wipo.int/search/en/detail.jsf?docId=WO2015148735&recNum=2&maxRec=2079&office=&prevFilter=&sortOption=Pub+Date+Desc&queryString=david+markus&tab=PCTDescription
IGEX up 20% today ..this is just getting started
http://investorshub.advfn.com/boards/read_msg.aspx?message_id=117374211
0001-0003 in one hr nice, now taking a break loading zone before she goes booom past 0003
Thanks, VS
Will definitely look and waiting for the right time to enter. Your pick is always solid.
This newly discovered public record today of an actual $EPGL filing with details is NEW INFORMATION that many have been wanting to see. It's verification that EPGL is credible in what it says it is doing. EPGL Investors now have more information than ever about what the company has been working on and this is just one of multiple #patents pending. #Autofocus #SmartContactLens
https://patentscope.wipo.int/search/en/detail.jsf?docId=WO2015123616&recNum=1&tab=PCTClaims&maxRec=&office=&prevFilter=&sortOption=&queryString=
PCT Biblio. Data
Pub. No.: WO/2015/123616 International Application No.: PCT/US2015/015978
Publication Date: 20.08.2015 International Filing Date: 13.02.2015
IPC:
A61F 2/16 (2006.01)
Applicants: MARKUS, David [US/US]; (US).
HAYES, Michael [US/US]; (US)
Inventors: MARKUS, David; (US).
HAYES, Michael; (US)
Agent: KAFANTARIS, Theologos; (US)
Priority Data:
61/939,736 13.02.2014 US
14/622,814 13.02.2015 US
Title (EN) PIEZOELECTRIC SENSOR FOR VISION CORRECTION
(FR) CAPTEUR PIÉZO-ÉLECTRIQUE POUR LA CORRECTION DE LA VISION
Abstract: front page image
(EN)The present invention will provide a vision correction device which utilizes the movements of the eye to correct the focus of the user without the need of surgical procedures. More specifically, the present invention will detect the movement of the ciliary muscle and adaptively modify the shape of an artificial lens positioned inside or outside of the eye to adjust the focus of the lens. This adjustment will occur very rapidly and coincide with the ciliary muscles attempt to focus the crystalline lens of the eye.
(FR)La présente invention concerne un dispositif de correction de la vision qui utilise les mouvements de l'œil pour corriger la focalisation de l'utilisateur sans impliquer de procédures chirurgicales. Plus spécifiquement, la présente invention va détecter le mouvement du muscle ciliaire et modifier de manière adaptative la forme d'une lentille artificielle positionnée à l'intérieur ou à l'extérieur de l'œil pour ajuster la focalisation du cristallin. Cet ajustement va se produire très rapidement et coïncidera avec la tentative des muscles ciliaires de focaliser le cristallin de l'œil.
Designated States: AE, AG, AL, AM, AO, AT, AU, AZ, BA, BB, BG, BH, BN, BR, BW, BY, BZ, CA, CH, CL, CN, CO, CR, CU, CZ, DE, DK, DM, DO, DZ, EC, EE, EG, ES, FI, GB, GD, GE, GH, GM, GT, HN, HR, HU, ID, IL, IN, IR, IS, JP, KE, KG, KN, KP, KR, KZ, LA, LC, LK, LR, LS, LU, LY, MA, MD, ME, MG, MK, MN, MW, MX, MY, MZ, NA, NG, NI, NO, NZ, OM, PA, PE, PG, PH, PL, PT, QA, RO, RS, RU, RW, SA, SC, SD, SE, SG, SK, SL, SM, ST, SV, SY, TH, TJ, TM, TN, TR, TT, TZ, UA, UG, US, UZ, VC, VN, ZA, ZM, ZW.
African Regional Intellectual Property Organization (BW, GH, GM, KE, LR, LS, MW, MZ, NA, RW, SD, SL, ST, SZ, TZ, UG, ZM, ZW)
Eurasian Patent Organization (AM, AZ, BY, KG, KZ, RU, TJ, TM)
European Patent Office (AL, AT, BE, BG, CH, CY, CZ, DE, DK, EE, ES, FI, FR, GB, GR, HR, HU, IE, IS, IT, LT, LU, LV, MC, MK, MT, NL, NO, PL, PT, RO, RS, SE, SI, SK, SM, TR)
African Intellectual Property Organization (BF, BJ, CF, CG, CI, CM, GA, GN, GQ, GW, KM, ML, MR, NE, SN, TD, TG).
Publication Language: English (EN)
Filing Language: English (EN)
Description
PIEZOELECTRIC SENSOR FOR VISION CORRECTION
CROSS-REFERENCE TO RELATED APPLICATIONS
This application claims the benefit of US Provisional Patent Application No 61/939,736, filed on 02/13/2014, and incorporated herein by reference.
STATEMENT REGARDING FEDERALLY SPONSORED RESEARCH AND DEVELOPMENT
Not Applicable.
FIELD OF THE INVENTION
This invention relates generally to a piezoelectric sensor for vision correction, and more particularly, to a piezoelectric sensor adapted to detect ciliary muscle movement and shape for vision correction.
DISCUSSION OF RELATED ART
Piezoelectricity can generally be described as an electrical charge in some solid materials, such as crystals, synthetic ceramics, polymers, biological matter such as bone, and
organic nanostructures, with the most common material being the ceramic lead zirconate titanate (PZT). When these materials receive mechanical stress or pressure, their stored energy is released as an electrical charge. Common applications for piezoelectricity include ignition devices, fuses, electric cigarette lighters, photovialtic cells, medical equipment, sensors, and transformers.
Piezoelectricity can be used to power small, even nano-sized electronic devices, and can be stored in a capacitor or a battery. A battery will allow for steadier, lower energy output, while a capacitor will allow for higher energy spike during output. The application of piezoelectricity in microprocessors, network circuits, and other nano-sized devices is typically transmitted wirelessly, as it is generally impractical to power nano-sized devices with large-scale energy sources with direct connectivity.
Piezoelectric thin films are very widely used in microelectromechanical systems
(MEMS). Here, thin films of piezoelectric material are used as sensors and actuators, where the piezoelectric material deforms in response to an applied electric field.
Piezoelectric thin films have also been used in micro motors and micro gears, where the deformation caused by the applied electrical field is converted into linear or rotary motion.
U.S. Patent 5,914,507 to Polla et al. describes a piezoelectric microdevice which uses thin film piezoelectric materials. Specifically, Polla utilizes a deflectable component which is mounted for deflection on a device substrate which has a sensor/actuator. The
sensor/actuator has first and second electrodes with a piezoelectric thin film piezoelectric material disposed between the first and second electrodes. The piezoelectric microdevice of Polla are adapted to stress the piezoelectric thin film material when a voltage is applied, resulting in a mechanical deformation or movement through its piezoelectric effect. This force can be transduced to move or position another object, creating a very precise motor.
The human eye, in very simplistic terms, is adapted to provide vision by detecting and converting light into electrical impulses for the brain. The main components of the human eye comprise the pupil, iris, cornea, crystalline lens, zonular fibres, ciliary muscle, retina, and optic nerve. These components work in conjunction to provide a clear and focused image with vibrant colors and proper intensity.
The ciliary muscle is used to adjust the focus of the eye when viewing objects of varying distances. The ciliary muscle, which is circular, is adapted to change the shape of the crystalline lens within the eye, which changes the way light is focused through the lens. When the ciliary muscle contracts, it pulls itself forward, causing the crystalline lens to become more spherical and improving short range focus. Alternatively, when the ciliary muscle relaxes, the crystalline lens is flattened and focal distance is increased. The zonular fibres hold the crystalline lens in its position when not being adjusted by the ciliary muscle.
The human eye is extremely intricate and precise, but the image produced often needs correction. The most common type of vision correction includes glasses and/or contact lenses, which are used to improve vision by correcting refractive error. This is done by directly focusing the light so that it enters the eye with the proper intensity. For those who have trouble focusing their vision, an artificial, intraocular lens can be implanted in the eye to replace a damaged or missing crystalline lens.
While vision correction devices are common in the prior art, there is currently no device which detects specific movements within the eye for focus correction. Furthermore, there is currently no non-surgical means for correcting the focus of the eye without undue burden on the user. Therefore, there is a continued need for a wearable ophthalmic vision correction device which makes use of the movements of the eye to correct the focus of the user without the need of surgical procedures or undue burden. The present invention satisfies these needs.
SUMMARY OF THE INVENTION
The present invention will provide a wearable ophthalmic vision correction device which utilizes the movements of the eye to correct the focus of the user without the need of surgical procedures. More specifically, the present invention will detect the movement of the ciliary muscle and adaptively modify the shape of an artificial lens positioned inside or outside of the eye to adjust the focus of the lens. This adjustment will occur very rapidly and coincide with the ciliary muscle's attempt to focus the crystalline lens of the eye.
More specifically, the present invention comprises a vibration sensor and artificial lens actuator. The vibration sensor comprises a piezoelectric sensor in direct or indirect contact with the eye, with the preferred embodiment in the form of a contact lens. The vibration sensor is adapted to detect the frequencies generated by specific muscle movements within the eye, namely, the ciliary muscle. When these movements are detected, the artificial lens actuator is activated, physically adjusting the shape of a lens for correcting focus. Alternatively, the artificial lens actuator is adapted for use with a display to accommodate the change of focus.
These and other objectives of the present invention will become obvious to those of ordinary skill in the art after reading the following detailed description of the preferred embodiments. It is to be understood that the foregoing general description and the following detailed description are exemplary, and are intended to provide further explanation of the invention as claimed.
DESCRIPTION OF THE DRAWINGS
FIG. 1 is a diagram illustrating the relevant anatomy of the eye with contact lens attached;
FIG. 2A is a diagram illustrating the change of focus of the eye for distant vision;
FIG. 2B is a diagram illustrating the change of focus of the eye for close vision;
FIG. 3 is a flowchart illustrating the steps of the present invention;
FIG. 4 is a diagram illustrating the first embodiment of the invention;
FIG. 5 is a diagram illustrating the second embodiment of the invention;
FIG. 6 is a diagram illustrating the third embodiment of the invention;
FIG. 7 is a diagram illustrating the fourth embodiment of the invention;
FIG. 8 is a diagram illustrating the fifth embodiment of the invention;
FIG. 9A is a diagram illustrating a cross-sectional view of a first type of vibration sensor;
FIG. 9B is a diagram illustrating a top view of a first type of vibration sensor;
FIG. 10A is a diagram illustrating a cross-sectional view of a second type of vibration sensor;
FIG. 1 OB is a diagram illustrating a top view of a second type of vibration sensor;
FIG. IOC is a diagram illustrating a bottom view of a second type of vibration sensor;
FIG. 11 A is a diagram illustrating a cross-sectional view of a third type of vibration sensor;
FIG. 1 IB is a diagram illustrating a top view of a third type of vibration sensor;
FIG. 12A is a diagram illustrating a cross-sectional view of a fourth type of vibration sensor;
FIG. 12B is a diagram illustrating a top view of a fourth type of vibration sensor;
FIG. 12C is a diagram illustrating a bottom view of a fourth type of vibration sensor;
FIG. 13 is a diagram illustrating a piezoelectric sensor array; and
FIG. 14 is a diagram illustrating a contact lens structure of the present invention.
DETAILED DESCRIPTION OF THE PREFERRED EMBODIMENT
Illustrative embodiments of the invention are described below. The following explanation provides specific details for a thorough understanding of and enabling description for these embodiments. One skilled in the art will understand that the invention may be practiced without such details. In other instances, well-known structures and functions have not been shown or described in detail to avoid
unnecessarily obscuring the description of the embodiments.
Unless the context clearly requires otherwise, throughout the description and the claims, the words "comprise," "comprising," and the like are to be construed in an inclusive sense as opposed to an exclusive or exhaustive sense; that is to say, in the sense of "including, but not limited to." Words using the singular or plural number also include the plural or singular number respectively. Additionally, the words "herein," "above," "below" and words of similar import, when used in this application, shall refer to this application as a whole and not to any particular portions of this application. When the claims use the word "or" in reference to a list of two or more items, that word covers all of the following interpretations of the word: any of the items in the list, all of the items in the list and any combination of the items in the list.
The present invention comprises a vibrational sensor 40 in electrical connection with an artificial lens actuator 50 for artificial lens focus correction. When in use, the vibrational sensor 40 is adapted to detect a change of focus within the human eye 20, and once detected, the artificial lens actuator 50 is activated to correct the focus of the user. The vibrational sensor 40 and artificial lens actuator 50 are presented in several embodiments and orientations, each described in further detail below.
When the ciliary muscles 25 contract, they loosen the ciliary fibers which are attached to the crystalline lens 24. Because the lens 24 is pliable, it relaxes into a more curved shape, increasing its refractive power to accommodate for closer viewing (Fig. 2B). When the eye 20 is relaxed and the crystalline lens 24 is the least rounded, the lens 24 has its maximum focal length for distant viewing (Fig. 2A). As the muscle tension around the ring of the ciliary muscle 25 is increased and the supporting fibers are thereby loosened, the crystalline lens 24 rounds out to its minimum focal length. The iris 23 serves as the aperture stop for the eye 20, closing to about 2mm in diameter in bright light and opening to a maximum of about 8mm in dim light.
The vibrational sensor 40 is positioned in close proximity to the eye 20 and is adapted to detect specific activity triggered by a change of focus. More specifically, the vibrational sensor 40 is adapted to detect the movement of the ciliary muscles 25, zonule fibers, suspensory ligaments 26, crystalline lens 24, and iris 23, each of which generates a frequency within a specific range. The vibrational sensor 40 is adapted to monitor and distinguish these frequency from other unwanted frequencies. Furthermore, the vibration sensor 40 is adapted to determine frequency, intensity, force, length, and direction, so as to accurately determine which type and how much focus is desired.
Each individual's ciliary muscles may produce a different frequency and force.
Generally, individuals below the age of 50 can produce a maximum force of 1 x 10~2 N, while those over 50 can produce a maximum force of .5 x 10~2 N. As such, the present invention will further comprise a calibration module for determining the specific frequency and force range for the user. In the preferred embodiment, the frequency range is between 0.01 Hz to 5 Hz and the force sensitivity is between 0.1 x 10"2 N to 5 x 10"2 N.
The vibration sensor 40 is a piezoelectric sensor 41 adapted to detect frequencies within this range. The piezoelectric sensor 41 may comprise synthetic piezoelectric ceramics including, but not limited to, barium titanate, lead titanate, lead zirconate titanate, potassium niobate, lithium niobate, lithium tantalite, sodium tungstate, and zinc oxide. Alternatively, the piezoelectric sensor 41 may comprise a polymer piezoelectric such as polyvinylidene fluoride. Lastly, biological piezoelectrics can be used including bone, tendon, silk, wood, enamel, dentin, DNA, and viral protein such as bacteriophage.
The piezoelectric sensor 41 may be implemented in low power and powered
embodiments. In the preferred embodiment, the piezoelectric sensor 41 will produce an electrical charge when the piezoelectric material 42 receives the frequencies generated by the movement of the ciliary muscles 25 and/or other muscles within the eye. This non-powered embodiment will save power and lower the complexity of the circuit as it will not require an independent power source. Here, the vibrational sensor 40 is adapted to only respond to a frequency within the above range, although it may generate an electrical charge from all frequencies so as to provide power to other components. In the powered embodiment, an independent power source will provide an electrical charge for the vibrational sensor 40 and other components. More specifically, electrical tunneling of sharp tip shifting is used when there is vibration or a change of capacitance of a structure that moves during the vibration.
Once a frequency is received from the ciliary muscle 25, the vibrational sensor 40 will activate the artificial lens actuator 50, which will artificially adjust the focus for the user. The artificial lens actuator 50 is adapted to physically alter the shape of an artificial lens, or intraocular lens 51 , corresponding with the frequency detected by the vibration sensor 40. For example, if the vibration sensor 40 detects that the eye 20 is focusing on an object at a distance, the artificial lens actuator 50 will physically alter the shape of the intraocular lens 51 to focus at a distance. The artificial lens actuator 50, in tandem with the vibration sensor 40, is adapted to determine whether the eye 20 is focusing near or far and at what distance. More specifically, the vibration sensor 40 will relay frequency, intensity, length, and direction information to the artificial lens actuator 50 so as to accurately determine which type and how much focus is desired.
The present invention may be implemented in several embodiments. In a first embodiment, the vibration sensor 40 is positioned outside of the cornea 21 and will be mechanically coupled with the surface of the cornea 21 for vibration detection (Fig. 4). Here, a contact lens 30 is displayed such that the vibration sensor 40 rests adjacent to the eye 20 when the contact lens 30 is worn. The vibration sensor 40 will activate the artificial lens actuator 50 within the contact lens 30 if a frequency is detected. The
contact lens 30 will then adjust the shape of the contact lens 30, adjusting the focus of the eye 20 accordingly. All components must be highly flexible to operate within a stretchable and elastic contact lens 30 and within the delicate structure in and around the eye 20.
In a second embodiment, the vibration sensor 40 is positioned within the eye 20 and will be mechanically coupled with the ciliary muscle 40 (Fig. 5). Here, the intraocular lens 51 is positioned such that a pair of vibration sensors 40 are positioned adjacent to the ciliary muscles 25 as they attach to the intraocular lens 51. When a frequency is detected, the artificial lens actuator 50 will change the shape of the intraocular lens 51, thereby adjusting the focus of the eye 20 accordingly.
In a third embodiment, the vibration sensor 40 is positioned outside of the eye 20 on a pair of glasses 60 (Fig. 6). Here, the vibration sensor 40 is positioned on the temples and nose pads of the glasses 60, where there is direct contact with the face of the user. As such, the vibration sensors 40 will be adapted to detect the frequency from the ciliary muscles 25 and/or other movements of the eye 20. Here, if a frequency within the specified range is detected, the artificial lens actuator 50 will adjust the shape of the intraocular lens 51 , thereby adjusting the focus of the eye 20 accordingly. Alternatively, the glasses 60 may be adapted to provide a display for the user, and as such, the artificial lens actuator 50 will instead manipulate the display to accommodate the change of focus.
In a fourth embodiment, the vibration sensor 40 is positioned outside of the eye 20 and in wired or wireless communication with goggles 70 or other type of helmet (Fig. 7). Here, the vibration sensor 40 is positioned directly on the user's face in close proximity to the eye 20. The vibration sensor 40 will detect the frequency from the ciliary muscles 25 and/or other movements of the eye 20 and act as a trigger. For example, the goggles 70 or helmet will be adapted to provide a display for the user, and as such, if a frequency is detected, the display 50 may be activated, deactivated, or otherwise trigger a display within the goggles 70 or helmet.
In a fifth embodiment, the vibration sensor 40 is implanted or otherwise directly attached to an artificial or natural eye 20 for vibration detection (Fig. 8). The vibration sensor 40 will detect the frequency from the ciliary muscles 25 and/or other movements of the eye 20 and relay this information to the artificial lens actuator 50 electronically. If the artificial lens actuator 50 is positioned within the eye 20, the communication will be wired, and if outside the eye 20, the communication will be wireless.
Figs. 9 A and 9B illustrate a type 1 cantilever piezoelectric structure having a clamp 43 on one end. This permits the piezoelectric material 42 to vibrate freely. It has solid interface material at the tip of the cantilever 44 to detect the vibration, while the base 45 is made from silicon. Figs. 11 A and 1 IB illustrate a type 3 enclosed membrane piezoelectric structure which is clamped 43 on all ends or partially clamped. Here, vibration is detected when the center of the piezoelectric material membrane 42 vibrates with the frequency of the ciliary muscle movements of the eye 20. This embodiment comprises a
solid interface material 44 at the tip of the center of the membrane to detect the vibration, while the base 45 is made from silicon. Fig. 13 displays how a piezoelectric sensor array may be positioned on a contact lens. Fig. 14 displays how the layers of the contact lens are positioned.
While the above description contains specific details regarding certain elements, sizes, and other teachings, it is understood that embodiments of the invention or any
combination of them may be practiced without these specific details. Specifically, although certain materials and shapes are designated in the above embodiments, any suitable materials or shape may be used. These details should not be construed as limitations on the scope of any embodiment, but merely as exemplifications of the presently preferred embodiments. In other instances, well known structures, elements, and techniques have not been shown to clearly explain the details of the invention.
The above detailed description of the embodiments of the invention is not intended to be exhaustive or to limit the invention to the precise form disclosed above or to the particular field of usage mentioned in this disclosure. While specific embodiments of, and examples for, the invention are described above for illustrative purposes, various equivalent modifications are possible within the scope of the invention, as those skilled in the relevant art will recognize. Also, the teachings of the invention provided herein can be applied to other systems, not necessarily the system described above. The elements and acts of the various embodiments described above can be combined to provide further embodiments.
Changes can be made to the invention in light of the above "Detailed Description." While the above description details certain embodiments of the invention and describes the best mode contemplated, no matter how detailed the above appears in text, the invention can be practiced in many ways. Therefore, implementation details may vary considerably while still being encompassed by the invention disclosed herein. As noted above, particular terminology used when describing certain features or aspects of the invention should not be taken to imply that the terminology is being redefined herein to be restricted to any specific characteristics, features, or aspects of the invention with which that terminology is associated.
While certain aspects of the invention are presented below in certain claim forms, the inventor contemplates the various aspects of the invention in any number of claim forms. Accordingly, the inventor reserves the right to add additional claims after filing the application to pursue such additional claim forms for other aspects of the invention.
CLAIMS
CLAIMS
What is claimed is:
1. A sensor for vision correction comprising:
a vibrational sensor positioned in close proximity to the eye and adapted to detect frequencies corresponding to ciliary muscle movement; and
an artificial lens actuator in electrical communication with said vibrational sensor; wherein said vibrational sensor will receive frequencies corresponding to muscle movements when the eye attempts to focus, activating said artificial lens actuator for artificial focus correction.
2. The sensor for vision correction of claim 1, wherein said vibrational sensor is a piezoelectric sensor comprising a thin film piezoelectric material positioned between a pair of electrodes.
3. The sensor for vision correction of claim 2, wherein said thin film piezoelectric sensor further comprises a cantilever structure, wherein one clamp attaches a piezoelectric material to a silicon base.
4. The sensor for vision correction of claim 2, wherein said thin film piezoelectric sensor further comprises a bridge structure, wherein two opposing clamps attach a piezoelectric material to a silicon base.
5. The sensor for vision correction of claim 2, wherein said thin film piezoelectric sensor further comprises an enclosed membrane structure, wherein a piezoelectric material is attached to a silicon base on all ends
6. The sensor for vision correction of claim 2, wherein said thin film piezoelectric sensor further comprises a piezoelectric material comprising lead zirconate titanate, barium titanate, lead titanate, potassium niobate, lithium niobate, lithium tantalite, sodium tungstate, zinc oxide, polyvinylidene fluoride, bone, tendon, silk, wood, enamel, dentin, DNA, and viral proteins.
7. The sensor for vision correction of claim 1, wherein said frequency is between 0.01 Hz to 5 Hz and a force sensitivity is between 0.1 x 10~2 N to 5 x 10~2 N.
8. The sensor for vision correction of claim 7, wherein said distinct eye movements further comprise movement of the ciliary muscles, zonule fibers, suspensory ligaments, crystalline lens, and iris.
9. The sensor for vision correction of claim 8, wherein said vibration sensor is unpowered, providing an electrical charge to said when said artificial lens actuator when said distinct eye movements are detected.
10. The sensor for vision correction of claim 8, wherein said vibration sensor is powered by an external power source.
11. The sensor for vision correction of claim 1 , wherein said artificial lens actuator will physically alter the shape of the lens of the eye to provide focus correction when distinct eye movements are detected.
12. The sensor for vision correction of claim 11, wherein said vibration sensor will relay frequency, intensity, length, and direction information to said artificial lens actuator so as to accurately determine which type and how much correction is needed on the lens of the eye.
13. The sensor for vision correction of claim 1, wherein said vibration sensor is positioned outside of the cornea within a contact lens.
14. The sensor for vision correction of claim 1, wherein said vibration sensor is positioned within the eye, wherein a pair of opposing vibration sensors are positioned adjacent to the ciliary muscles as they are mechanically attached to an intraocular lens within the eye.
15. The sensor for vision correction of claim 1, wherein said artificial lens actuator is in mechanical communication with a lens outside of the eye.
16. The sensor for vision correction of claim 1, wherein said vibration sensor is positioned outside of the cornea within the frame of a pair of eye glasses.
17. The sensor for vision correction of claim 16, wherein said vibration sensor is positioned on the temples and nose pads of said pair of eye glasses, wherein said vibration sensor is in direct contact with the user's face.
18. The sensor for vision correction of claim 1, wherein said eye glasses, a pair of goggles, or helmet is adapted to provide a display for the user, and as such, said vibration sensor is adapted to trigger said display.
19. The sensor for vision correction of claim 1, wherein said vibration sensor is implanted or otherwise directly attached to an artificial or natural eye for vibration detection.
20. The sensor for vision correction of claim 1, wherein said electronic communication is wireless communication.
DRAWINGS
https://patentscope.wipo.int/search/en/detail.jsf?docId=WO2015123616&recNum=1&tab=Drawings&maxRec=&office=&prevFilter=&sortOption=&queryString=
DOCUMENTS
International Application Status
Date
Title
View
Download
12.09.2015 International Application Status Report HTML, PDF PDF, XML
Published International Application
Date
Title
View
Download
20.08.2015 Initial Publication with ISR (A1 33/2015) PDF (35p.) PDF (35p.), ZIP(XML + TIFFs)
20.08.2015 Declaration PDF (1p.) PDF (1p.), ZIP(XML + TIFFs)
Search and Examination-Related Documents
Download
20.08.2015 Search Strategy PDF (7p.) PDF (7p.), ZIP(XML + TIFFs)
20.08.2015 Written Opinion of the International Search Authority PDF (8p.) PDF (8p.), ZIP(XML + TIFFs)
20.08.2015 International Search Report PDF (2p.) PDF (2p.), ZIP(XML + TIFFs)
08.09.2015 (IB/308) Notice Informing the Applicant of the Communication of the International Application to the Designated Offices PDF (1p.) PDF (1p.), ZIP(XML + TIFFs)
20.08.2015 Replacement sheets of the request form PDF (1p.) PDF (1p.), ZIP(XML + TIFFs)
20.08.2015 (RO/102) Notification Concerning Payment of Prescribed Fees PDF (2p.) PDF (2p.), ZIP(XML + TIFFs)
20.08.2015 (IB/311) Notification Concerning Availability of Publication of the International Application PDF (1p.) PDF (1p.), ZIP(XML + TIFFs)
20.08.2015 (ISA/220) Notification of transmittal of the international search report and the written opinion of the international searching authority, or the declaration PDF (1p.) PDF (1p.), ZIP(XML + TIFFs)
20.08.2015 Cover Letter PDF (5p.) PDF (5p.), ZIP(XML + TIFFs)
20.08.2015 Replacement, Substitute sheets (Rule 26) PDF (14p.) PDF (14p.), ZIP(XML + TIFFs)
20.08.2015 (ISA/202) Notification of Receipt of Search Copy PDF (1p.) PDF (1p.), ZIP(XML + TIFFs)
20.08.2015 Application Body as Filed PDF (35p.) PDF (35p.), ZIP(XML + TIFFs)
20.08.2015 (RO/105) Notification of the International Application Number and of the International Filing Date PDF (1p.) PDF (1p.), ZIP(XML + TIFFs)
20.08.2015 (RO/101) Request form PDF (4p.) PDF (4p.), ZIP(XML + TIFFs)
20.08.2015 (IB/301) Notification of receipt of record copy PDF (1p.) PDF (1p.), ZIP(XML + TIFFs)
20.08.2015 (IB/345) Communication in Cases for Which No Other Form is Applicable PDF (1p.) PDF (1p.), ZIP(XML + TIFFs)
20.08.2015 (RO/106) Invitation to Correct Defects in the International Application PDF (4p.) PDF (4p.), ZIP(XML + TIFFs)
https://patentscope.wipo.int/search/en/detail.jsf?docId=WO2015123616&recNum=1&tab=PCTDocuments&maxRec=&office=&prevFilter=&sortOption=&queryString=
EPGL turned down 2 NDA's offered by Novartis, most haven't researched enough to know that either, once in 2013 and recently in July 2015. This tells me Google Novartis are getting beat by a .06 company
Look at this $EPGL FIND! PIEZOELECTRIC SENSOR FOR VISION CORRECTION Filed on 02/13/2014 This application claims the benefit of US Provisional Patent Application No 61/939,736, $EPGL
https://patentscope.wipo.int/search/en/detail.jsf?docId=WO2015123616&recNum=1&maxRec=&office=&prevFilter=&sortOption=&queryString=&tab=PCTDescription
FIELD OF THE INVENTION
This invention relates generally to a piezoelectric sensor for vision correction, and more particularly, to a piezoelectric sensor adapted to detect ciliary muscle movement and shape for vision correction.
DISCUSSION OF RELATED ART
Piezoelectricity can generally be described as an electrical charge in some solid materials, such as crystals, synthetic ceramics, polymers, biological matter such as bone, and
organic nanostructures, with the most common material being the ceramic lead zirconate titanate (PZT). When these materials receive mechanical stress or pressure, their stored energy is released as an electrical charge. Common applications for piezoelectricity include ignition devices, fuses, electric cigarette lighters, photovialtic cells, medical equipment, sensors, and transformers.
Piezoelectricity can be used to power small, even nano-sized electronic devices, and can be stored in a capacitor or a battery. A battery will allow for steadier, lower energy output, while a capacitor will allow for higher energy spike during output. The application of piezoelectricity in microprocessors, network circuits, and other nano-sized devices is typically transmitted wirelessly, as it is generally impractical to power nano-sized devices with large-scale energy sources with direct connectivity.
Piezoelectric thin films are very widely used in microelectromechanical systems
(MEMS). Here, thin films of piezoelectric material are used as sensors and actuators, where the piezoelectric material deforms in response to an applied electric field.
Piezoelectric thin films have also been used in micro motors and micro gears, where the deformation caused by the applied electrical field is converted into linear or rotary motion.
U.S. Patent 5,914,507 to Polla et al. describes a piezoelectric microdevice which uses thin film piezoelectric materials. Specifically, Polla utilizes a deflectable component which is mounted for deflection on a device substrate which has a sensor/actuator. The
sensor/actuator has first and second electrodes with a piezoelectric thin film piezoelectric material disposed between the first and second electrodes. The piezoelectric microdevice of Polla are adapted to stress the piezoelectric thin film material when a voltage is applied, resulting in a mechanical deformation or movement through its piezoelectric effect. This force can be transduced to move or position another object, creating a very precise motor.
The human eye, in very simplistic terms, is adapted to provide vision by detecting and converting light into electrical impulses for the brain. The main components of the human eye comprise the pupil, iris, cornea, crystalline lens, zonular fibres, ciliary muscle, retina, and optic nerve. These components work in conjunction to provide a clear and focused image with vibrant colors and proper intensity.
The ciliary muscle is used to adjust the focus of the eye when viewing objects of varying distances. The ciliary muscle, which is circular, is adapted to change the shape of the crystalline lens within the eye, which changes the way light is focused through the lens. When the ciliary muscle contracts, it pulls itself forward, causing the crystalline lens to become more spherical and improving short range focus. Alternatively, when the ciliary muscle relaxes, the crystalline lens is flattened and focal distance is increased. The zonular fibres hold the crystalline lens in its position when not being adjusted by the ciliary muscle.
The human eye is extremely intricate and precise, but the image produced often needs correction. The most common type of vision correction includes glasses and/or contact lenses, which are used to improve vision by correcting refractive error. This is done by directly focusing the light so that it enters the eye with the proper intensity. For those who have trouble focusing their vision, an artificial, intraocular lens can be implanted in the eye to replace a damaged or missing crystalline lens.
While vision correction devices are common in the prior art, there is currently no device which detects specific movements within the eye for focus correction. Furthermore, there is currently no non-surgical means for correcting the focus of the eye without undue burden on the user. Therefore, there is a continued need for a wearable ophthalmic vision correction device which makes use of the movements of the eye to correct the focus of the user without the need of surgical procedures or undue burden. The present invention satisfies these needs.
SUMMARY OF THE INVENTION
The present invention will provide a wearable ophthalmic vision correction device which utilizes the movements of the eye to correct the focus of the user without the need of surgical procedures. More specifically, the present invention will detect the movement of the ciliary muscle and adaptively modify the shape of an artificial lens positioned inside or outside of the eye to adjust the focus of the lens. This adjustment will occur very rapidly and coincide with the ciliary muscle's attempt to focus the crystalline lens of the eye.
More specifically, the present invention comprises a vibration sensor and artificial lens actuator. The vibration sensor comprises a piezoelectric sensor in direct or indirect contact with the eye, with the preferred embodiment in the form of a contact lens. The vibration sensor is adapted to detect the frequencies generated by specific muscle movements within the eye, namely, the ciliary muscle. When these movements are detected, the artificial lens actuator is activated, physically adjusting the shape of a lens for correcting focus. Alternatively, the artificial lens actuator is adapted for use with a display to accommodate the change of focus.
These and other objectives of the present invention will become obvious to those of ordinary skill in the art after reading the following detailed description of the preferred embodiments. It is to be understood that the foregoing general description and the following detailed description are exemplary, and are intended to provide further explanation of the invention as claimed.
DESCRIPTION OF THE DRAWINGS
FIG. 1 is a diagram illustrating the relevant anatomy of the eye with contact lens attached;
FIG. 2A is a diagram illustrating the change of focus of the eye for distant vision;
FIG. 2B is a diagram illustrating the change of focus of the eye for close vision;
FIG. 3 is a flowchart illustrating the steps of the present invention;
FIG. 4 is a diagram illustrating the first embodiment of the invention;
FIG. 5 is a diagram illustrating the second embodiment of the invention;
FIG. 6 is a diagram illustrating the third embodiment of the invention;
FIG. 7 is a diagram illustrating the fourth embodiment of the invention;
FIG. 8 is a diagram illustrating the fifth embodiment of the invention;
FIG. 9A is a diagram illustrating a cross-sectional view of a first type of vibration sensor;
FIG. 9B is a diagram illustrating a top view of a first type of vibration sensor;
FIG. 10A is a diagram illustrating a cross-sectional view of a second type of vibration sensor;
FIG. 1 OB is a diagram illustrating a top view of a second type of vibration sensor;
FIG. IOC is a diagram illustrating a bottom view of a second type of vibration sensor;
FIG. 11 A is a diagram illustrating a cross-sectional view of a third type of vibration sensor;
FIG. 1 IB is a diagram illustrating a top view of a third type of vibration sensor;
FIG. 12A is a diagram illustrating a cross-sectional view of a fourth type of vibration sensor;
FIG. 12B is a diagram illustrating a top view of a fourth type of vibration sensor;
FIG. 12C is a diagram illustrating a bottom view of a fourth type of vibration sensor;
FIG. 13 is a diagram illustrating a piezoelectric sensor array; and
FIG. 14 is a diagram illustrating a contact lens structure of the present invention.
DETAILED DESCRIPTION OF THE PREFERRED EMBODIMENT
Illustrative embodiments of the invention are described below. The following explanation provides specific details for a thorough understanding of and enabling description for these embodiments. One skilled in the art will understand that the invention may be practiced without such details. In other instances, well-known structures and functions have not been shown or described in detail to avoid
unnecessarily obscuring the description of the embodiments.
Unless the context clearly requires otherwise, throughout the description and the claims, the words "comprise," "comprising," and the like are to be construed in an inclusive sense as opposed to an exclusive or exhaustive sense; that is to say, in the sense of "including, but not limited to." Words using the singular or plural number also include the plural or singular number respectively. Additionally, the words "herein," "above," "below" and words of similar import, when used in this application, shall refer to this application as a whole and not to any particular portions of this application. When the claims use the word "or" in reference to a list of two or more items, that word covers all of the following interpretations of the word: any of the items in the list, all of the items in the list and any combination of the items in the list.
The present invention comprises a vibrational sensor 40 in electrical connection with an artificial lens actuator 50 for artificial lens focus correction. When in use, the vibrational sensor 40 is adapted to detect a change of focus within the human eye 20, and once detected, the artificial lens actuator 50 is activated to correct the focus of the user. The vibrational sensor 40 and artificial lens actuator 50 are presented in several embodiments and orientations, each described in further detail below.
When the ciliary muscles 25 contract, they loosen the ciliary fibers which are attached to the crystalline lens 24. Because the lens 24 is pliable, it relaxes into a more curved shape, increasing its refractive power to accommodate for closer viewing (Fig. 2B). When the eye 20 is relaxed and the crystalline lens 24 is the least rounded, the lens 24 has its maximum focal length for distant viewing (Fig. 2A). As the muscle tension around the ring of the ciliary muscle 25 is increased and the supporting fibers are thereby loosened, the crystalline lens 24 rounds out to its minimum focal length. The iris 23 serves as the aperture stop for the eye 20, closing to about 2mm in diameter in bright light and opening to a maximum of about 8mm in dim light.
The vibrational sensor 40 is positioned in close proximity to the eye 20 and is adapted to detect specific activity triggered by a change of focus. More specifically, the vibrational sensor 40 is adapted to detect the movement of the ciliary muscles 25, zonule fibers, suspensory ligaments 26, crystalline lens 24, and iris 23, each of which generates a frequency within a specific range. The vibrational sensor 40 is adapted to monitor and distinguish these frequency from other unwanted frequencies. Furthermore, the vibration sensor 40 is adapted to determine frequency, intensity, force, length, and direction, so as to accurately determine which type and how much focus is desired.
Each individual's ciliary muscles may produce a different frequency and force.
Generally, individuals below the age of 50 can produce a maximum force of 1 x 10~2 N, while those over 50 can produce a maximum force of .5 x 10~2 N. As such, the present invention will further comprise a calibration module for determining the specific frequency and force range for the user. In the preferred embodiment, the frequency range is between 0.01 Hz to 5 Hz and the force sensitivity is between 0.1 x 10"2 N to 5 x 10"2 N.
The vibration sensor 40 is a piezoelectric sensor 41 adapted to detect frequencies within this range. The piezoelectric sensor 41 may comprise synthetic piezoelectric ceramics including, but not limited to, barium titanate, lead titanate, lead zirconate titanate, potassium niobate, lithium niobate, lithium tantalite, sodium tungstate, and zinc oxide. Alternatively, the piezoelectric sensor 41 may comprise a polymer piezoelectric such as polyvinylidene fluoride. Lastly, biological piezoelectrics can be used including bone, tendon, silk, wood, enamel, dentin, DNA, and viral protein such as bacteriophage.
The piezoelectric sensor 41 may be implemented in low power and powered
embodiments. In the preferred embodiment, the piezoelectric sensor 41 will produce an electrical charge when the piezoelectric material 42 receives the frequencies generated by the movement of the ciliary muscles 25 and/or other muscles within the eye. This non-powered embodiment will save power and lower the complexity of the circuit as it will not require an independent power source. Here, the vibrational sensor 40 is adapted to only respond to a frequency within the above range, although it may generate an electrical charge from all frequencies so as to provide power to other components. In the powered embodiment, an independent power source will provide an electrical charge for the vibrational sensor 40 and other components. More specifically, electrical tunneling of sharp tip shifting is used when there is vibration or a change of capacitance of a structure that moves during the vibration.
Once a frequency is received from the ciliary muscle 25, the vibrational sensor 40 will activate the artificial lens actuator 50, which will artificially adjust the focus for the user. The artificial lens actuator 50 is adapted to physically alter the shape of an artificial lens, or intraocular lens 51 , corresponding with the frequency detected by the vibration sensor 40. For example, if the vibration sensor 40 detects that the eye 20 is focusing on an object at a distance, the artificial lens actuator 50 will physically alter the shape of the intraocular lens 51 to focus at a distance. The artificial lens actuator 50, in tandem with the vibration sensor 40, is adapted to determine whether the eye 20 is focusing near or far and at what distance. More specifically, the vibration sensor 40 will relay frequency, intensity, length, and direction information to the artificial lens actuator 50 so as to accurately determine which type and how much focus is desired.
The present invention may be implemented in several embodiments. In a first embodiment, the vibration sensor 40 is positioned outside of the cornea 21 and will be mechanically coupled with the surface of the cornea 21 for vibration detection (Fig. 4). Here, a contact lens 30 is displayed such that the vibration sensor 40 rests adjacent to the eye 20 when the contact lens 30 is worn. The vibration sensor 40 will activate the artificial lens actuator 50 within the contact lens 30 if a frequency is detected. The
contact lens 30 will then adjust the shape of the contact lens 30, adjusting the focus of the eye 20 accordingly. All components must be highly flexible to operate within a stretchable and elastic contact lens 30 and within the delicate structure in and around the eye 20.
In a second embodiment, the vibration sensor 40 is positioned within the eye 20 and will be mechanically coupled with the ciliary muscle 40 (Fig. 5). Here, the intraocular lens 51 is positioned such that a pair of vibration sensors 40 are positioned adjacent to the ciliary muscles 25 as they attach to the intraocular lens 51. When a frequency is detected, the artificial lens actuator 50 will change the shape of the intraocular lens 51, thereby adjusting the focus of the eye 20 accordingly.
In a third embodiment, the vibration sensor 40 is positioned outside of the eye 20 on a pair of glasses 60 (Fig. 6). Here, the vibration sensor 40 is positioned on the temples and nose pads of the glasses 60, where there is direct contact with the face of the user. As such, the vibration sensors 40 will be adapted to detect the frequency from the ciliary muscles 25 and/or other movements of the eye 20. Here, if a frequency within the specified range is detected, the artificial lens actuator 50 will adjust the shape of the intraocular lens 51 , thereby adjusting the focus of the eye 20 accordingly. Alternatively, the glasses 60 may be adapted to provide a display for the user, and as such, the artificial lens actuator 50 will instead manipulate the display to accommodate the change of focus.
In a fourth embodiment, the vibration sensor 40 is positioned outside of the eye 20 and in wired or wireless communication with goggles 70 or other type of helmet (Fig. 7). Here, the vibration sensor 40 is positioned directly on the user's face in close proximity to the eye 20. The vibration sensor 40 will detect the frequency from the ciliary muscles 25 and/or other movements of the eye 20 and act as a trigger. For example, the goggles 70 or helmet will be adapted to provide a display for the user, and as such, if a frequency is detected, the display 50 may be activated, deactivated, or otherwise trigger a display within the goggles 70 or helmet.
In a fifth embodiment, the vibration sensor 40 is implanted or otherwise directly attached to an artificial or natural eye 20 for vibration detection (Fig. 8). The vibration sensor 40 will detect the frequency from the ciliary muscles 25 and/or other movements of the eye 20 and relay this information to the artificial lens actuator 50 electronically. If the artificial lens actuator 50 is positioned within the eye 20, the communication will be wired, and if outside the eye 20, the communication will be wireless.
Figs. 9 A and 9B illustrate a type 1 cantilever piezoelectric structure having a clamp 43 on one end. This permits the piezoelectric material 42 to vibrate freely. It has solid interface material at the tip of the cantilever 44 to detect the vibration, while the base 45 is made from silicon. Figs. 11 A and 1 IB illustrate a type 3 enclosed membrane piezoelectric structure which is clamped 43 on all ends or partially clamped. Here, vibration is detected when the center of the piezoelectric material membrane 42 vibrates with the frequency of the ciliary muscle movements of the eye 20. This embodiment comprises a
solid interface material 44 at the tip of the center of the membrane to detect the vibration, while the base 45 is made from silicon. Fig. 13 displays how a piezoelectric sensor array may be positioned on a contact lens. Fig. 14 displays how the layers of the contact lens are positioned.
While the above description contains specific details regarding certain elements, sizes, and other teachings, it is understood that embodiments of the invention or any
combination of them may be practiced without these specific details. Specifically, although certain materials and shapes are designated in the above embodiments, any suitable materials or shape may be used. These details should not be construed as limitations on the scope of any embodiment, but merely as exemplifications of the presently preferred embodiments. In other instances, well known structures, elements, and techniques have not been shown to clearly explain the details of the invention.
The above detailed description of the embodiments of the invention is not intended to be exhaustive or to limit the invention to the precise form disclosed above or to the particular field of usage mentioned in this disclosure. While specific embodiments of, and examples for, the invention are described above for illustrative purposes, various equivalent modifications are possible within the scope of the invention, as those skilled in the relevant art will recognize. Also, the teachings of the invention provided herein can be applied to other systems, not necessarily the system described above. The elements and acts of the various embodiments described above can be combined to provide further embodiments.
Changes can be made to the invention in light of the above "Detailed Description." While the above description details certain embodiments of the invention and describes the best mode contemplated, no matter how detailed the above appears in text, the invention can be practiced in many ways. Therefore, implementation details may vary considerably while still being encompassed by the invention disclosed herein. As noted above, particular terminology used when describing certain features or aspects of the invention should not be taken to imply that the terminology is being redefined herein to be restricted to any specific characteristics, features, or aspects of the invention with which that terminology is associated.
While certain aspects of the invention are presented below in certain claim forms, the inventor contemplates the various aspects of the invention in any number of claim forms. Accordingly, the inventor reserves the right to add additional claims after filing the application to pursue such additional claim forms for other aspects of the invention
Let me know your thoughts added 2m+ today at .0016 average, market cap says the stock is way undervalued, add zero dilution and a decent chart, I only see major upside.
HISTORICALS: SHOW NO FRONTLOAD
Historical Prices
Date Open High Low Close Volume Adj
Close
2015/09/04 0.00080 0.0011 0.00080 0.0011 732,463 0.0011
2015/09/03 0.00080 0.00090 0.00080 0.00089 385,939 0.00089
2015/09/02 0.00090 0.00090 0.00090 0.00090 500,000 0.00090
2015/09/01 0.00080 0.00090 0.00075 0.00090 1,129,900 0.00090
2015/08/31 0.00070 0.00090 0.00070 0.00090 98,388 0.00090
2015/08/28 0.00090 0.00090 0.00070 0.00070 498,000 0.00070
2015/08/27 0.00080 0.00090 0.00070 0.00090 1,899,778 0.00090
2015/08/26 0.00080 0.00080 0.00080 0.00080 200,200 0.00080
2015/08/25 0.00080 0.00090 0.00080 0.00081 940,881 0.00081
2015/08/24 0.00090 0.0010 0.00080 0.00080 241,500 0.00080
2015/08/21 0.0010 0.0010 0.00090 0.00090 29,350 0.00090
2015/08/20 0.0010 0.0010 0.0010 0.0010 67,370 0.0010
2015/08/19 0.00090 0.0010 0.00090 0.0010 118,000 0.0010
2015/08/18 0.00090 0.00090 0.00090 0.00090 - 0.00090
2015/08/17 0.0010 0.0012 0.00060 0.00090 7,266,616 0.00090
2015/08/14 0.0012 0.0012 0.0012 0.0012 600 0.0012
2015/08/13 0.0010 0.0010 0.0010 0.0010 - 0.0010
2015/08/12 0.0011 0.0011 0.0010 0.0010 64,750 0.0010
2015/08/11 0.0010 0.0011 0.00098 0.0011 270,000 0.0011
2015/08/10 0.00090 0.0010 0.00090 0.00090 510,530 0.00090
2015/08/07 0.00090 0.00090 0.00090 0.00090 924,396 0.00090
2015/08/06 0.0011 0.0011 0.00090 0.00092 11,741 0.00092
2015/08/05 0.00090 0.0010 0.00090 0.00090 31,388 0.00090
2015/08/04 0.0010 0.0011 0.00090 0.0011 424,888 0.0011
2015/08/03 0.0010 0.0010 0.0010 0.0010 100,000 0.0010
2015/07/31 0.0010 0.0010 0.0010 0.0010 - 0.0010
Here is some DD on it Angel :) LONG TERM PLAY TO FAIR VALUE/ THIS IS NOT A DAY TRADE. (*LIKE ECDP FROM .0006 TO .005 733% TOP SO FAR, AND HOLDING AROUD 400% MORE THAN 1 MONTH LATER.) SR2G stays on a stock longer than anyone.
UAPC (United American Petroleum Corp) is a 100% real revenue producing company and a SEC audited filer with and OS of 321,867,909 shares with an AS of 750M. Float is around 250M minus the insider restricted shares. UAPC has NOT diluted even 1 share in almost two years if you go back and check all the 10k’s. Additionally, and more importantly, there are NO convertible notes whatsoever in the company’s 10k’s anymore. The importance of this is that there are NO forces of diluting MM’s working against the trading public.
NEW FILING – AMMENDENT 10 K/S: http://www.otcmarkets.com/edgar/GetFilingHtml?FilingID=10817138
Above is the certified, documented highly credible SEC filed listing on OIL RESERVES: (*Click on link and scroll down to you see the 3rd party certified SEC filed document.
As of Jan 1, 2015, we estimate the UAPC net proved reserves to be about 118,660 barrels of oil. Projected future cash shows a discounted net present value of $2,025,090. (*see the document on the page 5 or click on the link above.)
Lets do some Math: Current Market Value of UAPC is the following on the close of market Friday, Sept. 4.
UAPC Security Details Share Structure 321,867,909 x .0011 = $354,055 a/o Sept 4, 2015
In our opinion, the company is severely UNDERVALUED based on proven documented 3rd party Oil Reserves alone. The company is revenue generating and improving rapidly in its operating losses dramatically over the last few quarters and approaching profitability.
THIS COMPANY HAS OVER $2M in SEC certified and documented OIL RESERVES and has a current market value of only $354K. The FAIR MARKET VALUE at the very least if nothing else is being negotiated or being made public in more well/lease acquistions should be at least approximately .01 the very least based just on oil reserves.
Revenue: Last 6 months: (from the 10k)
Results of operations for the six months ended June 30, 2015, as compared to the six months ended June 30, 2014
Revenues . We had total revenues of $291,802 for the six months ended June 30, 2015which were generated from oil and gas sales of $286,702 and well operating revenues of $5,100. This was a $18,580 or 6% decrease from total revenues of $310,382 for the six months ended June 30, 2014, which were generated from oil and gas sales of $305,282 and well operation revenues of $5,100. Barrels of oil per day produced (BOPD) increased to an average of 42.85 BOPD from 19.29 BOPD for the six months ended June 30, 2014.
Net Loss. For the six months ended June 30, 2015, our net loss was $180,650 as compared to a net loss of $459,597 for the six months ended June 30, 2014, an improvement of $278,947 or 61% from the prior period.
Cash on Hand: $189,208 Total Cash & Receivables: $223, 207
Chart:
Discussion: UAPC hit a high almost .005 back in late May on relatively light volume and for the most part declined on small volume as well mainly due to traders moving money to more active stocks in the summer duldrums and perhaps the decline of oil prices may have been a detriment as well. However, oil prices have bottomed out and are beginning to rise again as most analysts agree bottom
is in there and should see prices moving back up. See- chart for crude oil prices: http://www.dailyfx.com/crude-oil
Here is the most important fact that everyone needs to realize. I scrubbed every filing back for the last few years in UAPC. The pps
back in 2013 as you can see on the chart was over .12. The reason for the decline in the pps was the conversion of several convertible notes that the company used to pay off some long term debt. It severely hurt the stock price, but I guess it’s a necessary evil if you have no cash to develop your business plan. However, as you can see now this company is growing nicely and has about $200K CASH
in the bank and $2M in proven oil reserves now, but the market has overlooked that. Convertible debt kills the stock price
of a company, but it also hides the true value of it until its realized my the market. That is what needs to happen with UAPC
and imo it will. The decline of oil prices has not helped here over the last few months, but that is on the upswing as well.
Finally, if you look at where their oil/gas well and leases are you can see they are right in the middle of where the big
boys are playing. Here is picture of it. Notice the names of the big oil and gas companies.
Key Operations Facts
• 17 Projects (Producing)
• Almost 5,000 Acres
• 10 Counties
• 60 Wellbores
United is presently providing operational services for numerous oil and gas leaseholders in 10 Counties Statewide, covering almost 5,000 acres, containing 60 existing wellbores with many offset drilling locations identified. Including Lavaca, Frio, Gonzales, Caldwell, Jackson, La Salle, Pecos, Bastrop, Erath, Parker, Shackelford, Pecos, Lockhart, Duval, Medina, Wilbarger, Navarro, Archer and Victoria counties. We are exploring opportunities to increase both the size and locations of our operations portfolio.With our years of experience in the region, we pride ourselves on our ability to perform any duty needed in the oil field, including, but not limited to:
• Landman
• Title and leasing
• Lease work
• Pumping and gauging
• Geology and geophysics
• Reserve estimates
• Overseeing work-overs
• Re-entries and drilling
• We can also perform enhanced recovery such as water floods and gas injection and a wide array of other industry specific tasks.
Major Players in the Texas Eagle Ford Shale Field
Listed on the OTC Markets, the company can be found under the ticker symbol UAPC.
Standard & Poor's Market Access Profile
HISTORICALS: SHOW NO FRONTLOAD
Historical Prices
Date Open High Low Close Volume Adj
Close
2015/09/04 0.00080 0.0011 0.00080 0.0011 732,463 0.0011
2015/09/03 0.00080 0.00090 0.00080 0.00089 385,939 0.00089
2015/09/02 0.00090 0.00090 0.00090 0.00090 500,000 0.00090
2015/09/01 0.00080 0.00090 0.00075 0.00090 1,129,900 0.00090
2015/08/31 0.00070 0.00090 0.00070 0.00090 98,388 0.00090
2015/08/28 0.00090 0.00090 0.00070 0.00070 498,000 0.00070
2015/08/27 0.00080 0.00090 0.00070 0.00090 1,899,778 0.00090
2015/08/26 0.00080 0.00080 0.00080 0.00080 200,200 0.00080
2015/08/25 0.00080 0.00090 0.00080 0.00081 940,881 0.00081
2015/08/24 0.00090 0.0010 0.00080 0.00080 241,500 0.00080
2015/08/21 0.0010 0.0010 0.00090 0.00090 29,350 0.00090
2015/08/20 0.0010 0.0010 0.0010 0.0010 67,370 0.0010
2015/08/19 0.00090 0.0010 0.00090 0.0010 118,000 0.0010
2015/08/18 0.00090 0.00090 0.00090 0.00090 - 0.00090
2015/08/17 0.0010 0.0012 0.00060 0.00090 7,266,616 0.00090
2015/08/14 0.0012 0.0012 0.0012 0.0012 600 0.0012
2015/08/13 0.0010 0.0010 0.0010 0.0010 - 0.0010
2015/08/12 0.0011 0.0011 0.0010 0.0010 64,750 0.0010
2015/08/11 0.0010 0.0011 0.00098 0.0011 270,000 0.0011
2015/08/10 0.00090 0.0010 0.00090 0.00090 510,530 0.00090
2015/08/07 0.00090 0.00090 0.00090 0.00090 924,396 0.00090
2015/08/06 0.0011 0.0011 0.00090 0.00092 11,741 0.00092
2015/08/05 0.00090 0.0010 0.00090 0.00090 31,388 0.00090
2015/08/04 0.0010 0.0011 0.00090 0.0011 424,888 0.0011
2015/08/03 0.0010 0.0010 0.0010 0.0010 100,000 0.0010
2015/07/31 0.0010 0.0010 0.0010 0.0010 - 0.0010
Disclaimer:
Opinions expressed on this board are just that. Opinions. I am not a licensed broker. Trading strategies discussed on this board are often high risk and not suitable everyone. If you are losing money in the market, you may wish to seek the advice of a licensed securities professional. No one is responsible for your gains or losses in the market except YOU. If you follow stocks, strategies discussed on this board, you may LOSE ALL YOUR MONEY. Please weigh the strategies discussed here carefully against what you are willing to risk. Please do your own due diligence before buying or selling ANY SECURITY in the open market, there are no guarantees.
Yes I will post it, how's it been going Angel
|
Followers
|
193
|
Posters
|
|
|
Posts (Today)
|
0
|
Posts (Total)
|
38299
|
|
Created
|
12/16/11
|
Type
|
Premium
|
| Moderator smalltimetrader | |||
| Assistants vikingzskillz ~Angel~ L-Back risk on MrPoppaGeorgeo L1ving | |||


| ANATOMY OF A SCAM | TOXIC TRADING PATTERN | RESERVED |
|---|---|---|
| 1. Take a shell which you control and buy back as many shares as possible while it has nothing in it and convert loans into more free trading shares such that the majority of all free trading shares are in the hands of the promoters; | 1. PPS drops to .000# 2. R/S the stock |
|
| RSI | Usually 70 represents overbought which is very bullish for those who are already in, however, generally it means you should think about selling your position. Generally, when a stock is overbought which 70+ represents then a decline is soon to follow. On the converse though, a stock which has an RSI of under 30 means it is oversold which is a bearish indicator, however it could represent a stock which maybe at a time to purchase. RSI should be used in conjunction with fundamentals to understand why the conditions exist in the first place. |
| Channel | Difficult to describe, however a channel represents the average recent high as the top and the average recent low as the bottom. Others may define the channel as upper level being resistance and the lower level being support. However, I have seen channels trade with-in that range. The idea is to flip stocks in the short term for the best possible price at the time. |
| SAR | Parabolic SAR is a weak indicator which implies whether the people are attracted the stock or could be closing their positions. It's more important in my opinion to look for the distance between the par dot and the candle and look for the convergence. For example, if the dots are going to slam into a candle from below; that could indicate a buy signal. Likewise, if the dots are far below the candles, it's a bullish indicator implying a hold. If the dots are about to slam into the top of a candle it could indicate a sell signal, while if the dots are way above the candles I wouldn't recommend taking a position. So, generally above the candle = bad, below the candle = good, unless your goal is to enter a stock at a weak point. |
| MACD | A lot of people like MACD, however, personally that is big board stuff. It crosses all day long. Generally, wider the lines are apart the more affect it has. If the bullish line is above the bearish line then watch for a convergence and possible sell point. Nothing goes up forever. Likewise, if the Bearish line is above the Bullish line then watch the stock for an entry point. |
| Accum/Dist | A deceptive indicator, a lot of people will point to it and say "look at all the people buying". This could actually be showing diluted shares being bought. Watching the line is important however, it should be checked with fundamentals. |
![]()


|
Posts Today
|
0
|
|
Posts (Total)
|
38299
|
|
Posters
|
|
|
Moderator
|
|
|
Assistants
|
| Volume | |
| Day Range: | |
| Bid Price | |
| Ask Price | |
| Last Trade Time: |


