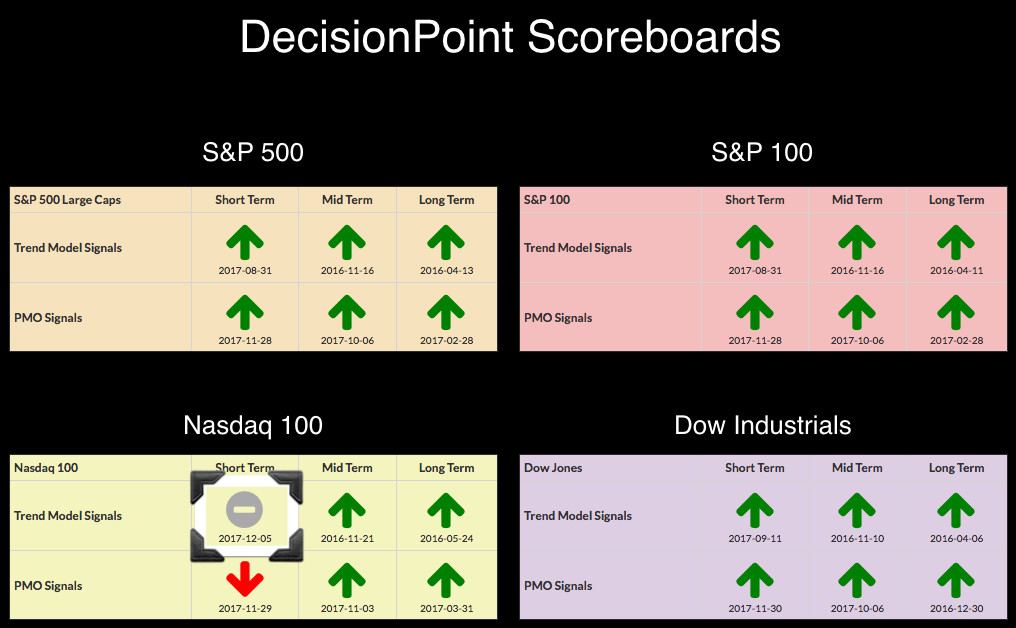
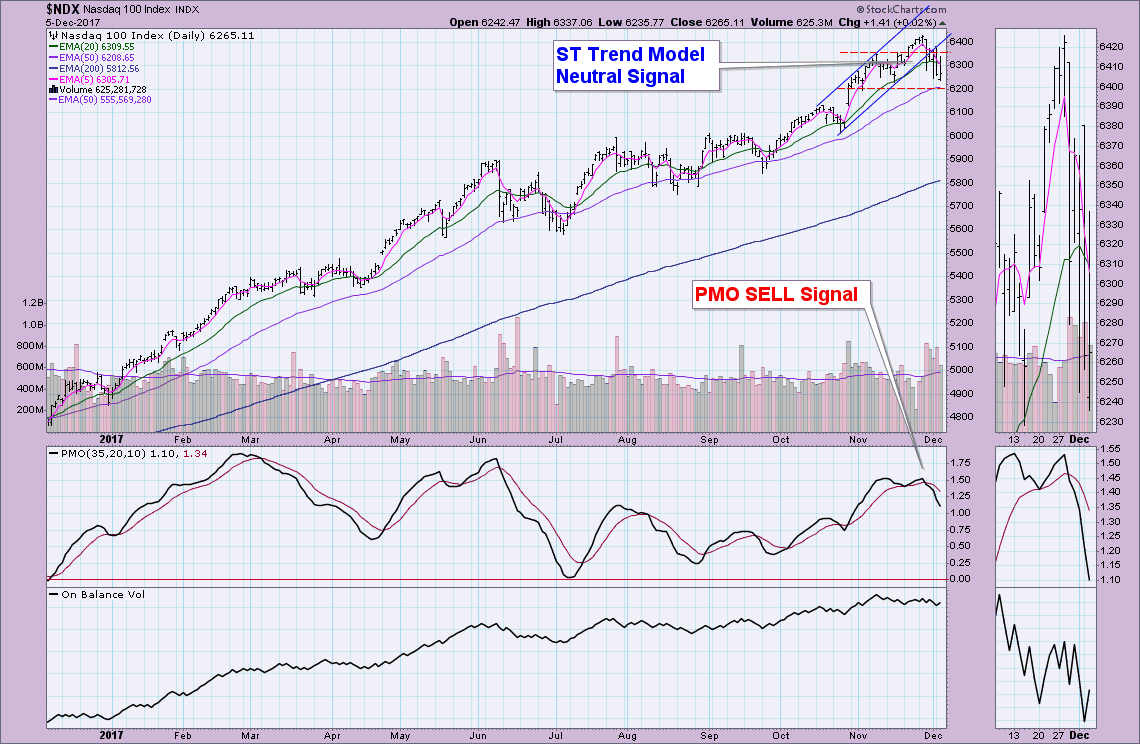
First and foremost I am pointing out the new ST Trend Model Neutral signal that arrived today on the NDX. Despite attempting to rally from the recent decline, price was unable to move high enough to prevent this Neutral signal from appearing. Today I discussed with Tom thoughts on whether we are looking at a small bounce off a decline or a last gasp before more decline. I'm of the thought that the decline and weakness are still a problem and with this signal, a big problem. Looking at the chart, I think there is more downside to digest with a move likely to support at 6200. At that point, Santa should come around and spread Christmas cheer to technology.
STOCKS
IT Trend Model: BUY as of 11/15/2016
LT Trend Model: BUY as of 4/1/2016
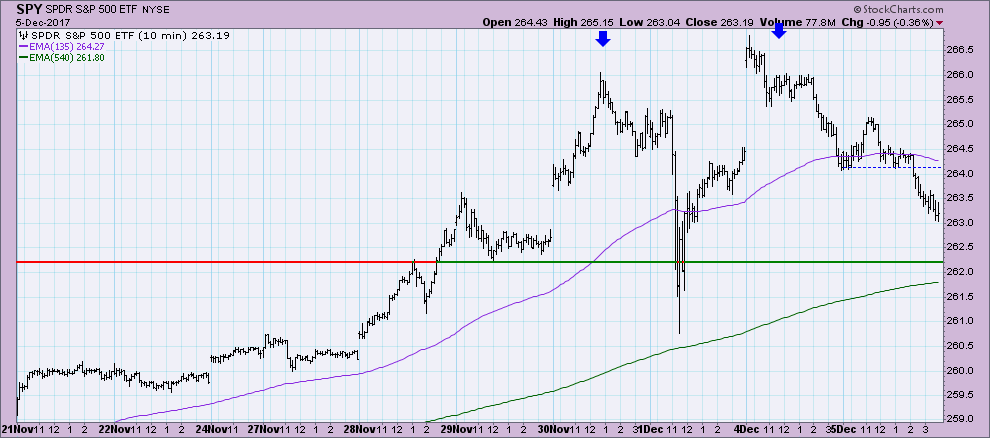
The gap up on yesterday's open was very encouraging, however, it was nearly all given back by the end of the day. Today we saw follow-through on that decline. I have annotated what could be a very short-term double-top with a neckline just below 262.0.
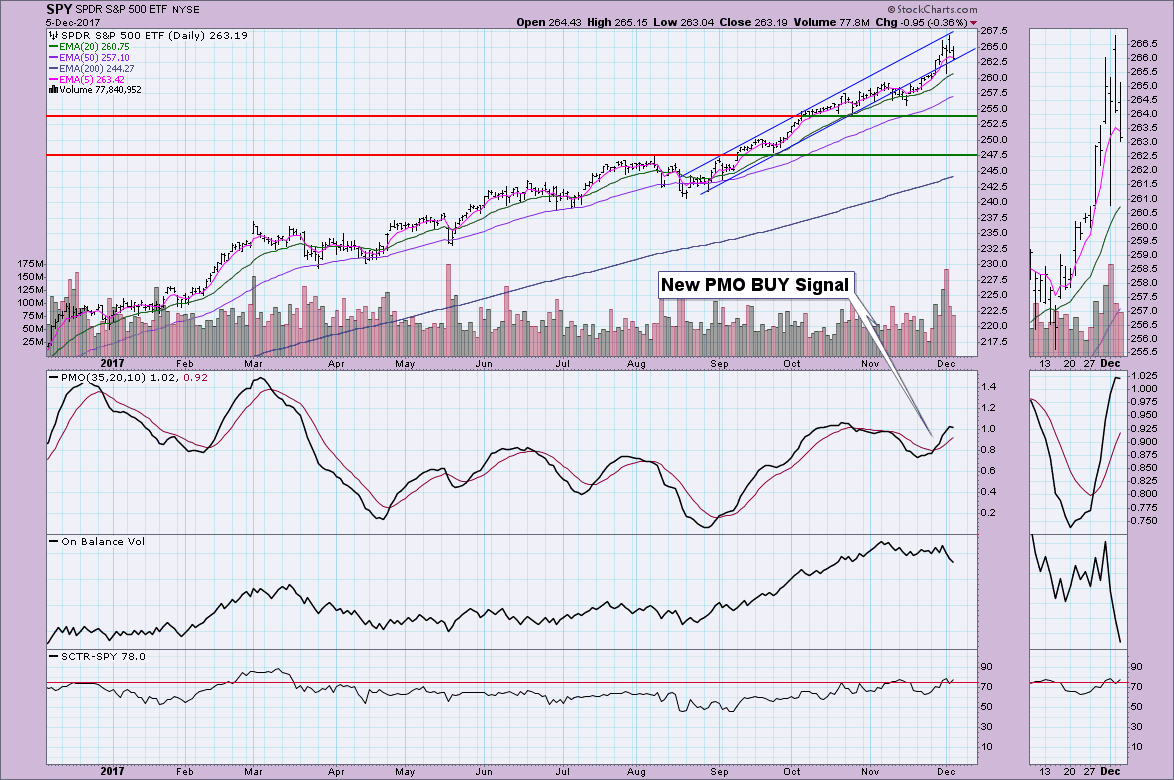
The PMO on the SPY topped today. Not a good sign, but we do see price staying inside the rising trend channel. Given the bearish look to the 10-minute bar chart and activity by short-term indicators (read on), I am starting to see a possible drop to the 260 level.
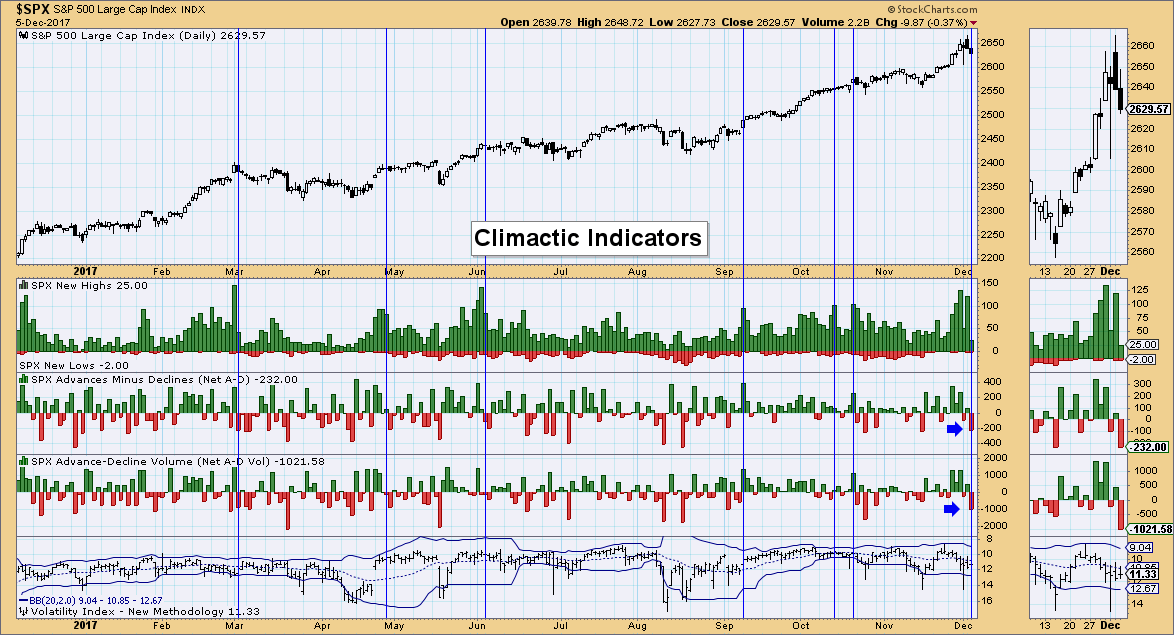
Climactic Indicators: We did see a spike on the A-D readings, but I didn't see a similar climactic move by the VIX or New Lows. If I had that confirming data, I'd see this as an exhaustion. Unfortunately without that, I'm concerned this decline isn't quite finished.
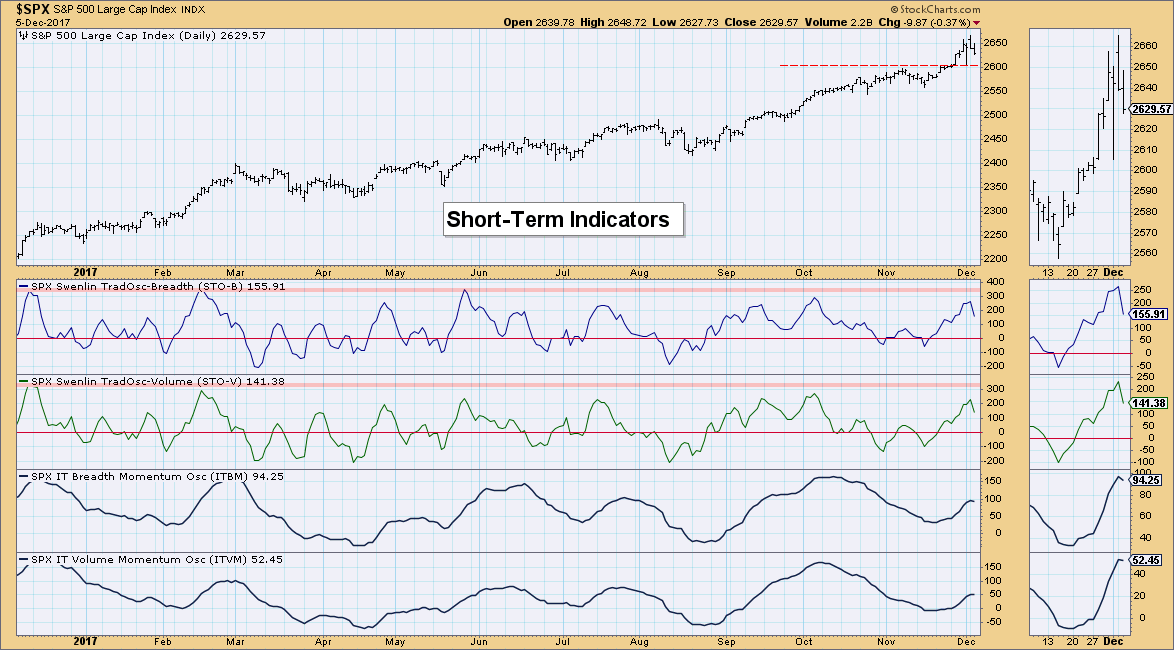
Short-Term Indicators: The Swenlin Trading Oscillators have been looking very bullish for some time, but now we have a serious turnaround. When I saw it tick down on Monday, I wasn't too concerned since we see 'twitch' quite often, but today's continuation is bearish. You can also see the IT indicators are topping as well.
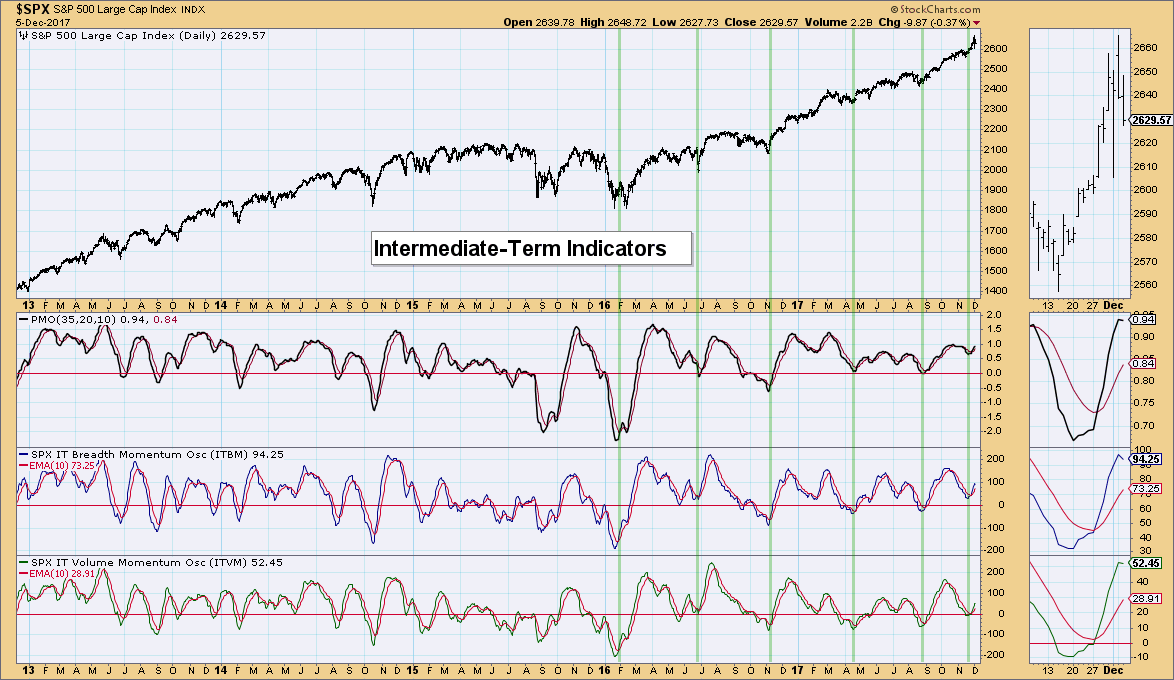
Intermediate-Term Indicators: While the tops on the ITBM and ITVM may look somewhat ominous on the ST Indicators chart above, this chart tells me we are likely looking at some twitch. These indicators are not overbought. If we see them continue lower and have negative crossovers, then we should get worried. For now, the IT picture is still mostly bullish.
Conclusion: The deterioration of short-term indicators is a problem, along with a topping PMO on the SPY. Climactic indicators suggest more short-term weakness. IT indicators are still healthy enough to stay bullish in the intermediate term.
DOLLAR
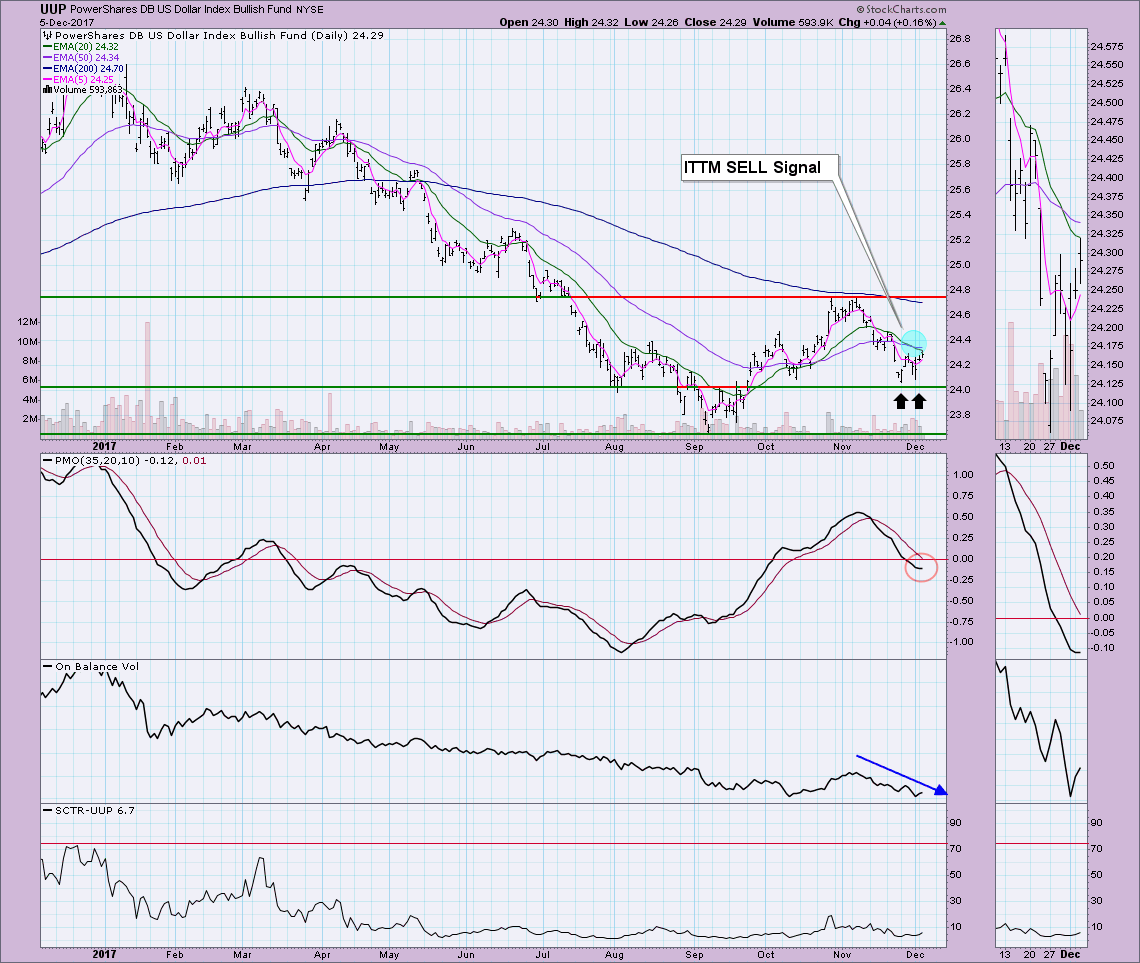
IT Trend Model: SELL as of 11/30/2017
LT Trend Model: SELL as of 05/24/2017
I suspect that UUP triggered the recent ITTM SELL signal late. The picture for UUP is starting to brighten. I see what looks like a short-term bullish double-bottom formation. Today the neckline at 24.30 was penetrated, though UUP closed at 24.29 just below it. The PMO has turned up which suggests to me this pattern will execute completely. The upside target would be around $24.60. A move to test overhead resistance at $24.80 is entirely possible, but we need to see the OBV turn back up. . .
Information posted to this board is not meant to suggest any specific action, but to point out the technical signs that can help our readers make their own specific decisions. Your Due Dilegence is a must! • DiscoverGold
Register for free to join our community of investors and share your ideas. You will also get access to streaming quotes, interactive charts, trades, portfolio, live options flow and more tools.


 News
News  Market Data
  Discover