(SPY) Weekly Wrap: Blowoff By: Carl Swenlin | December 1, 2017
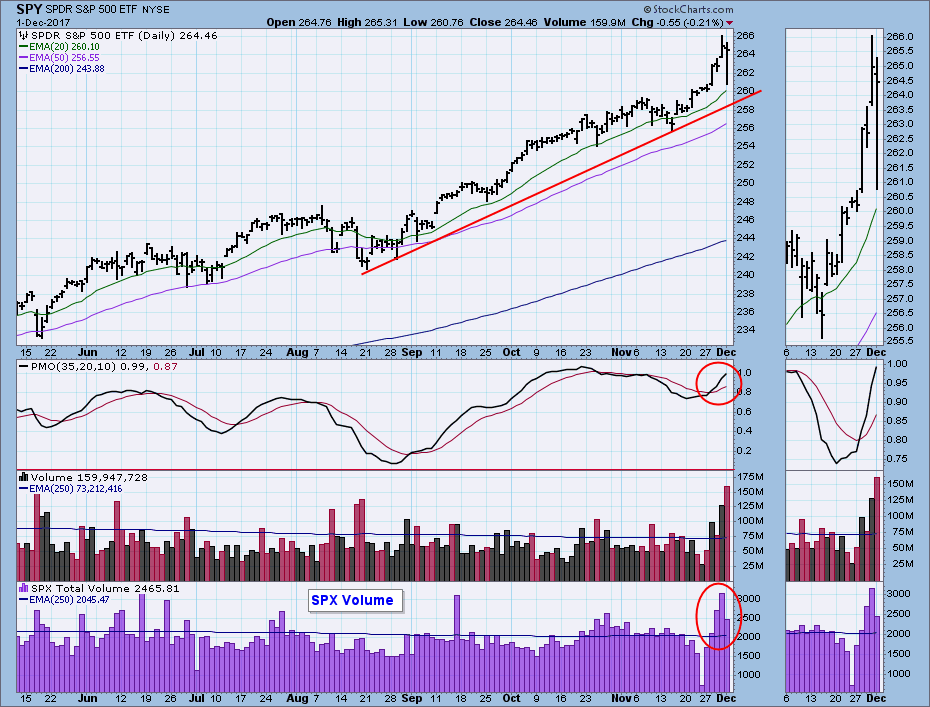
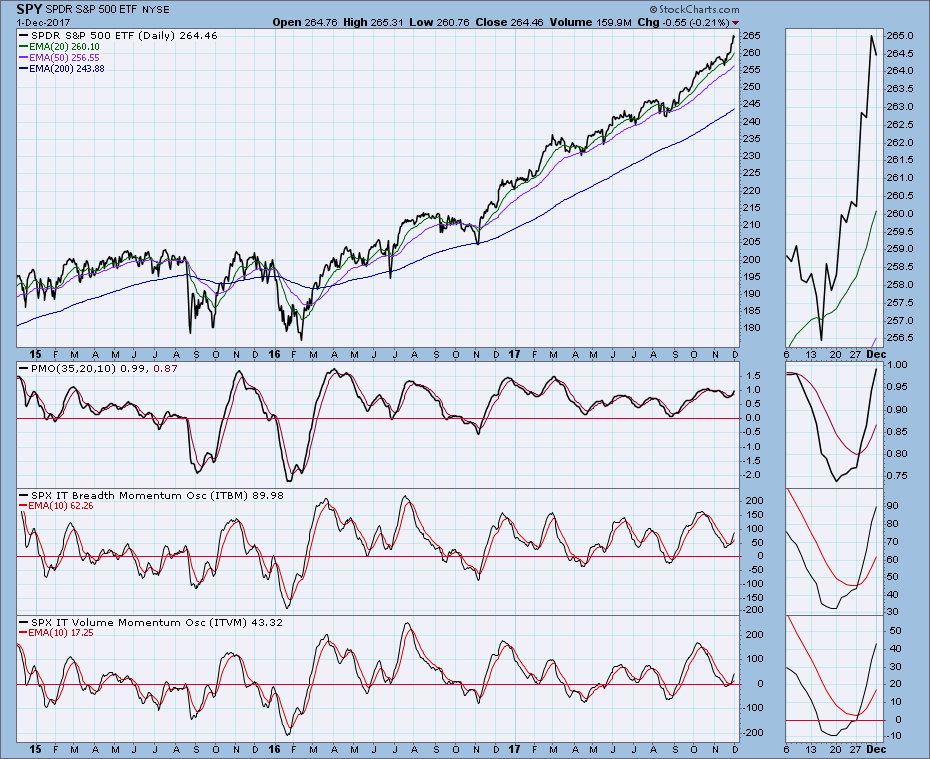
There were a couple of news stories on which to blame Friday's pullback, but my opinion is that the vertical up move of the prior three days was a short-term blowoff that needed to be corrected. The blowoff is most readily identified by the rapidly expanding volume midweek, capped by a buying climax on Thursday. I usually include the SPX volume panel with the SPY chart because it tells the story of the S&P 500, whereas SPY volume is all about the ETF.
STOCKS
IT Trend Model: BUY as of 11/15/2016
LT Trend Model: BUY as of 4/1/2016
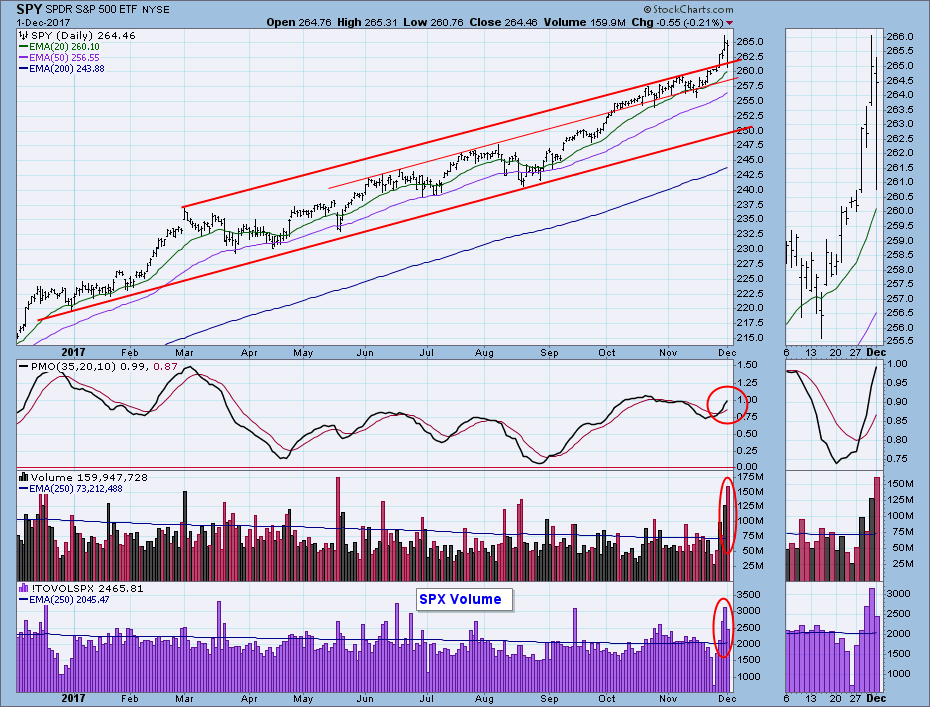
Daily Chart: This week price broke out of the fanciful rising trend channel that appears on the one-year daily chart. While there was a furious pullback to the point of breakout on Friday, price closed well above the top of the channel. SPX volume blewoff on Thursday, and SPY volume spiked on Friday, hinting that there was a selling climax.
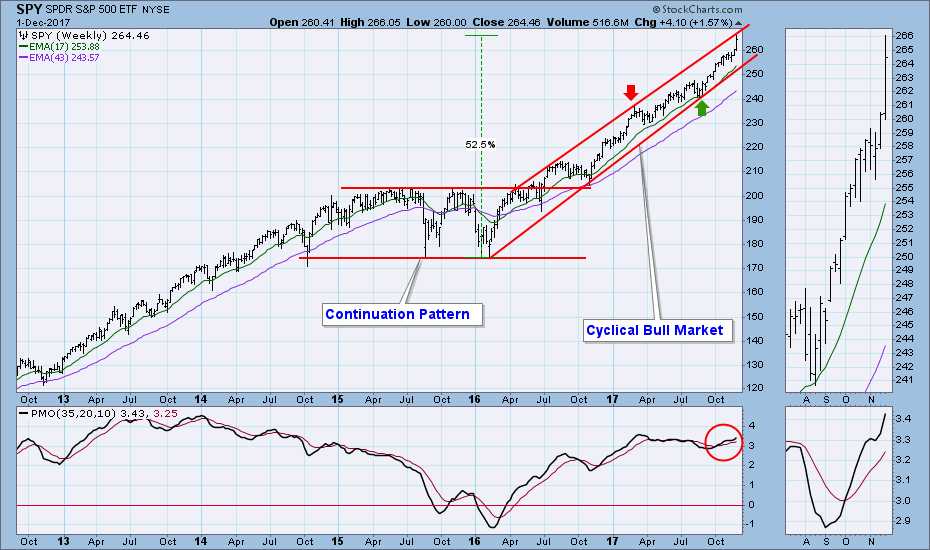
Weekly Chart: In this time frame we can see that price has reached the top of the nominal rising trend channel that has contained the cyclical bull market for almost two years. The angle of ascent has become so steep, it seems reasonable that price should start movement toward the bottom of the channel. That doesn't necessarily mean lower prices. Earlier this year a correction took place (from red arrow to green arrow) that was not really the usual correction -- SPY finally hit the rising trend line at a level that was higher than where the correction began.
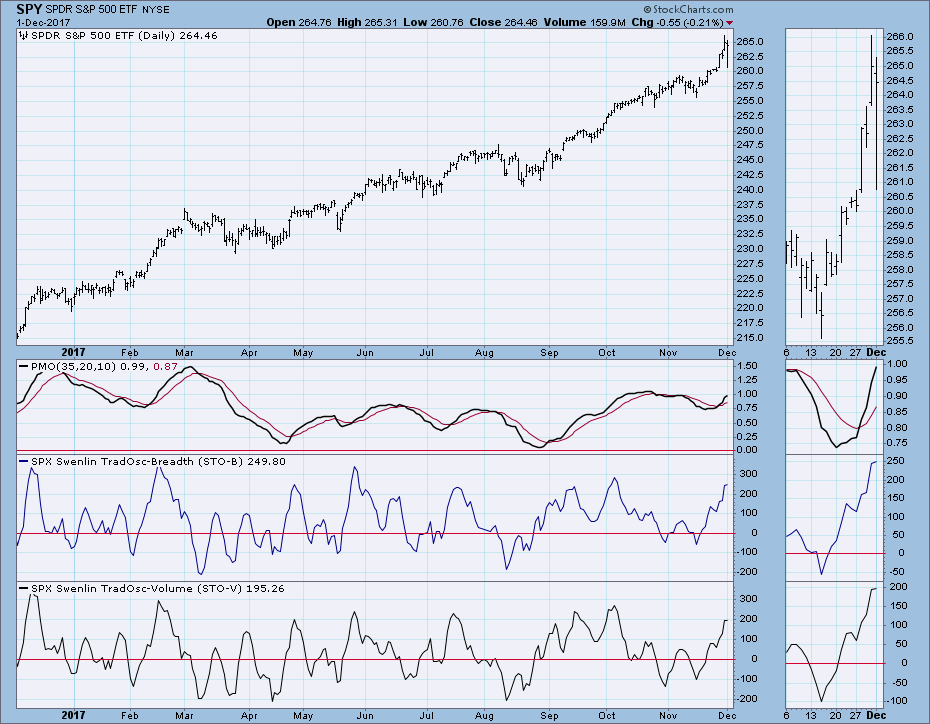
Short-Term Market Indicators: These indicators are getting overbought, but not so much as to interfere with the rally yet.
Intermediate-Term Market Indicators: These indicators have plenty of room to accommodate much higher prices. We're still looking at a very nice setup for a continued rally.
Conclusion: In spite of plenty of cover stories explaining Friday's pullback, the technical picture tells us that the market just got overheated and ascended at an unsustainable angle. The fact that Friday's deep pullback didn't last very long tells me that the bull is still alive and well -- plenty of people out there buying the dip. For the record, I don't consider that intraday air pocket a "dip" for people with an intermediate-term time horizon. Nevertheless, it was a high-volume selling climax that may have offset Thursday's blowoff. Notice on the chart immediately above that SPY is displayed in line format. The line is simply too steep, and we cannot expect it to be sustained much longer without some kind of action to digest the advance. Having said that, because of Christmas seasonality my outlook is for the market to continue higher at least until the end of the year.
Click on "In reply to", for Authors past commentaries
Information posted to this board is not meant to suggest any specific action, but to point out the technical signs that can help our readers make their own specific decisions. Your Due Dilegence is a must! • DiscoverGold
Register for free to join our community of investors and share your ideas. You will also get access to streaming quotes, interactive charts, trades, portfolio, live options flow and more tools.


 News
News  Market Data
  Discover