


| Followers | 679 |
| Posts | 140850 |
| Boards Moderated | 36 |
| Alias Born | 03/10/2004 |
Sunday, November 19, 2017 2:27:13 PM
By: Clive Maund | November 19, 2017
Gold appeared to break out on Friday, but the situation is contradictory because on its price charts is appears to be in position to begin another upleg within an uptrend, but its COTs are still neutral / bearish at best, and don’t appear to allow much room for a rally, while the dollar Hedgers chart is still calling for the dollar to advance, despite its downturn last week.
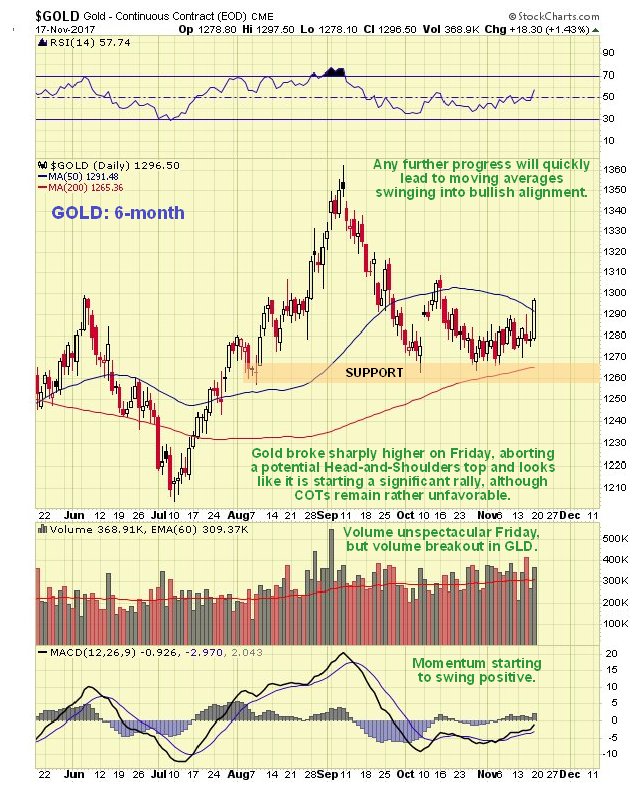
On gold’s 6-month chart we can see how, after weeks of indecisive sideways movement it broke sharply higher on Friday, looking like it has aborted a potential Head-and-Shoulders top. With the rising 200-day moving average having pulled up beneath the price, it is in position for another upleg, especially as the 50-day has dropped back to close up with the price and 200-day, creating a bullish bunching of all three.
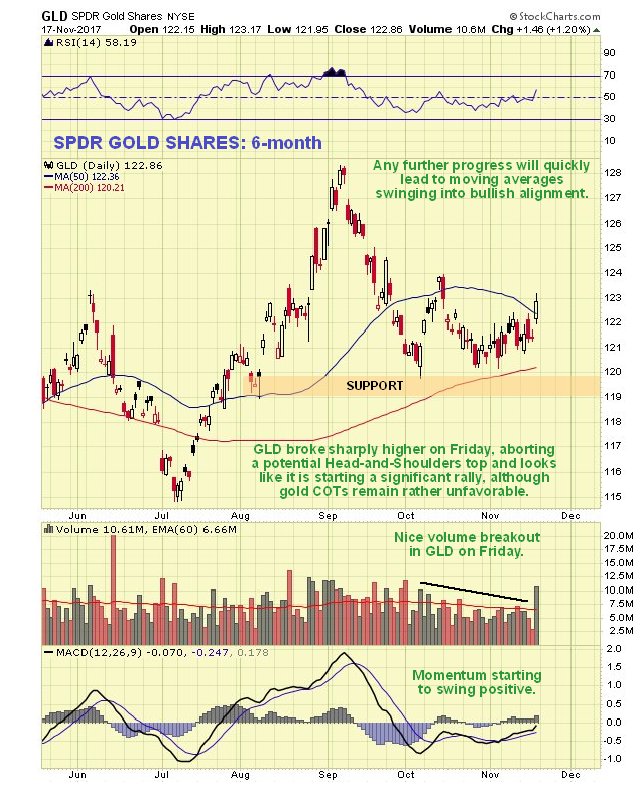
Whilst volume was unimpressive on Friday’s rally in gold, such was not the case with gold proxy GLD, which DID break higher on impressive volume – the highest since early September. This is a positive sign…
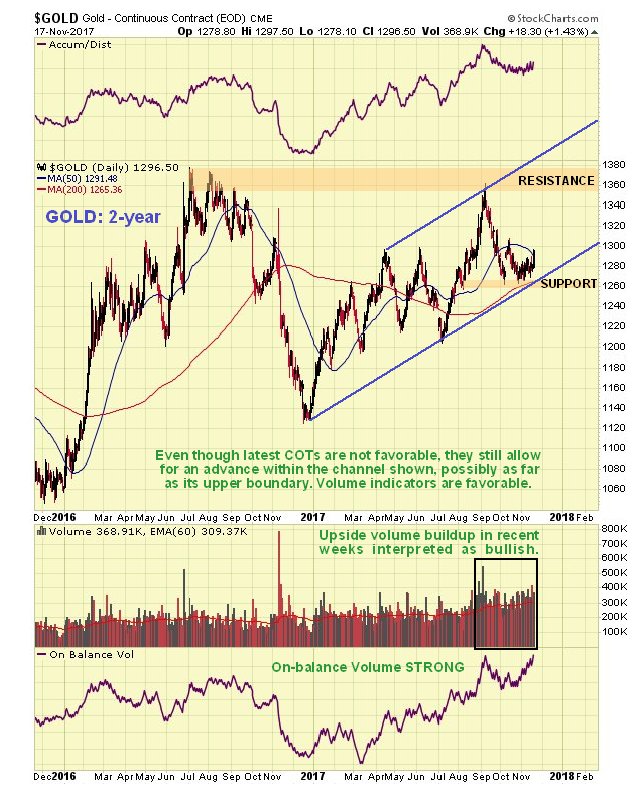
The 2-year chart for gold enables us to see clearly what is going on. Friday’s break higher looks like it marks the start of another intermediate uptrend within the now clear channel shown, after the price dropped back to ease its earlier overbought condition and test the support level shown and the support at the lower boundary of the channel. The potential Head-and-Shoulders top that we saw earlier will probably soon be history. There has been a very noticeable build in upside volume in recent weeks, resulting in strong volume indicators, especially On-balance Volume, which is at new highs. These volume indications certainly augur well for coming weeks.
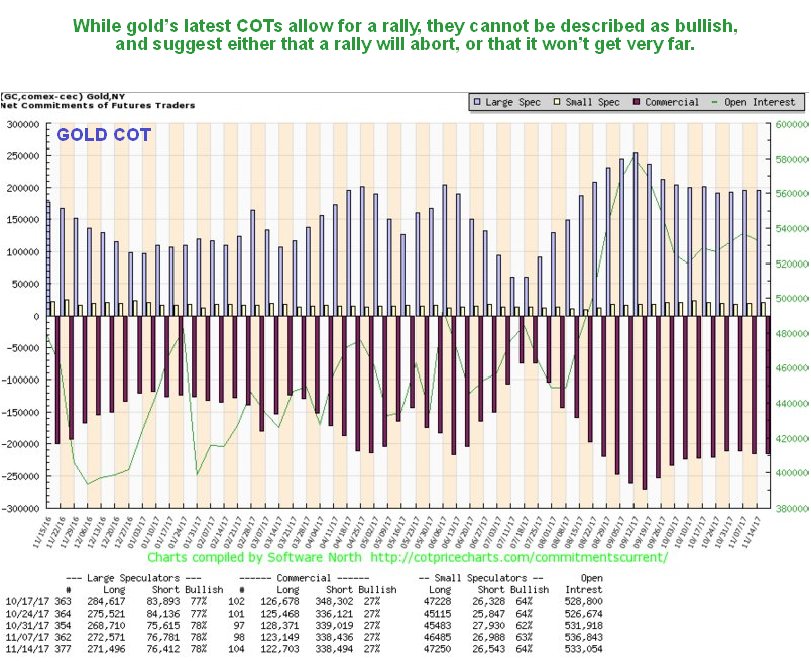
Against the now positive picture on the gold charts we must weight the latest gold COT, which is still neutral / bearish, as normally wrong Large Specs are still holding a high long position, although it has eased somewhat allowing room for a rally.
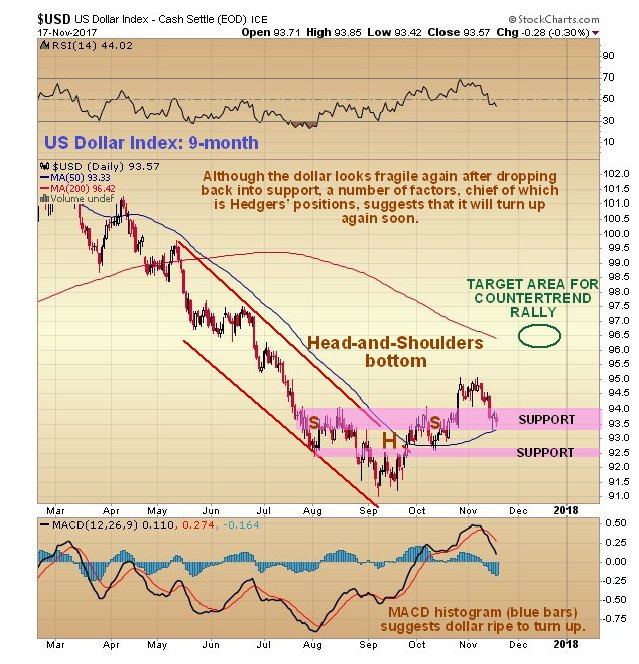
In addition the dollar Hedgers chart still points to a dollar rally, which would not be a positive influence on gold. First, if we look at the 6-month chart for the dollar index, we see that, after breaking out of what looks like a Head-and-Shoulders bottom, it has reacted back to support towards the top of the pattern and its rising 50-day moving average. This is a good point for it to turn higher again. Note however, that a clear break below 92.50 will turn the picture bearish again
The chances of the dollar turning higher again are amplified by its latest Hedgers chart, which shows that positions held by Commercial Hedgers are still at levels that in the past have lead to significant rallies.
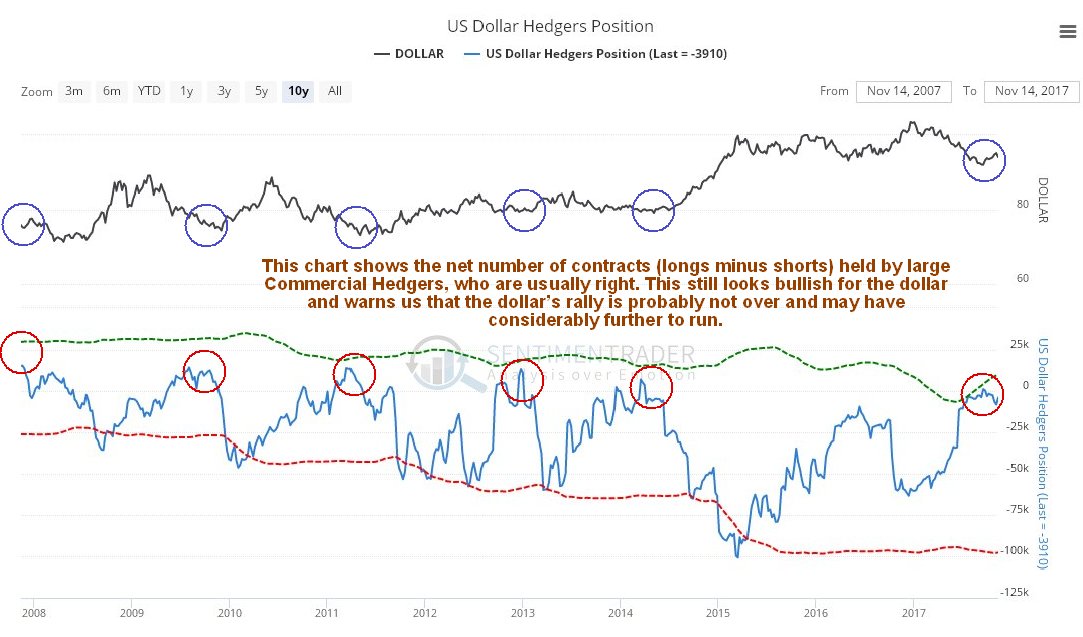
Chart courtesy of www.sentimentrader.com
So how do we reconcile the now bullish looking gold charts, especially the 2-year chart, with the still bullish looking dollar chart, and especially its latest Hedgers’ chart? With difficulty, that’s how. Here we should note that it is possible for the dollar and gold to rally together, although this is a rare event that would involve gold outpacing the dollar, which could happen for example if money flooded out of Europe into the US as a relative safe haven, and also into gold. One scenario that is considered quite likely is gold rallying up within its uptrend channel to the band of resistance in the $1360 - $1380 area where a COT extreme develops (which it is not too far off now) before stalling out and dropping again.
We will end now by looking at the dollar and its Hedgers chart. On the 9-month chart for the dollar index we can see the Head-and-Shoulders bottom that it broke out of last month. Following the breakout it has reacted back over the past week or so to the extent that many are now writing it off again. As we can see it is now dug into support near to the upper boundary of the Head-and-Shoulders bottom and is also at support at its rising 200-day moving average, and the big question is whether this support is enough to turn it higher again, especially as its longer-term charts looks rather grim. The answer to that is that it probably is, because of the bullish Hedgers positions that we will now look at.
On the latest Hedgers chart we can see that Hedgers net positions are now at levels that in the past have always led to a significant rally, and that therefore is what we can reasonably expect to see again. This, needless to say, would complicate the outlook for gold and other commodities (copper’s latest COTs are still quite heavily bearish).
An effective strategy for pragmatic traders to play this situation is to be long the Precious Metals sector now, following the buy signal on Friday, and to start taking profits on gold arriving at the resistance level in the $1360 - $1380 area and especially if it should make it all the way to the upper boundary of the channel shown on our chart. Alternatively positions should be scaled back if it breaks blow the lower boundary of the channel and especially if it breaks below the support level at about $1260.
Finally it is worth pointing out that we are perfectly well aware of the price suppression of gold being undertaken in the paper market as the physical supply continues to tighten, and that the Chinese and Russians are wisely taking the opportunity this presents to vacuum up much of the West’s gold on the cheap, so that later, and quite possibly at a time of their choosing, they will be able to bury the dollar and forcibly put the self-appointed global policeman with its 700 plus military bases around the world “out to grass” as a result of its being economically ground into the dust. At that time, when the Chinese may back the Yuan with gold, gold will reassume its central and traditional role and is likely to soar due to the extremely high level of paper assets to gold. A growing awareness of the raw power that China now wields is why the US has suddenly started being nice to China, which has noted and learned the lessons from the US’ treatment of Russia.
https://www.clivemaund.com/free.php?id=68
• DiscoverGold
Click on "In reply to", for Authors past commentaries
****************************************
*** For Market Direction and Trends visit our board:
https://investorshub.advfn.com/Market-Direction-and-Trends-26249/
Information posted to this board is not meant to suggest any specific action, but to point out the technical signs that can help our readers make their own specific decisions. Your Due Dilegence is a must!
• DiscoverGold
Recent GDX News
- YieldMax GDXY Name Change • GlobeNewswire Inc. • 01/25/2024 04:22:00 PM
- Surging S&P 500 Breadth • ValueWalk • 07/19/2023 03:16:37 PM
- S&P 500 Corrects In Breadth • ValueWalk • 07/18/2023 03:08:49 PM
- If The USDX Fell So Much, Why Didn’t Gold Truly Soar? • ValueWalk • 07/17/2023 05:16:20 PM
- USD’s Decline That’s… Bearish For Gold?! • ValueWalk • 07/12/2023 02:38:08 PM
- S&P 500 Late Day Reversal Worry • ValueWalk • 07/10/2023 03:17:34 PM
- Massive Gaming Celebrates Global Launch of House of Blackjack with USDC Earning Race • ValueWalk • 07/10/2023 02:44:17 PM
- Breathers In Mining Stocks Are Not Real Rallies • ValueWalk • 07/06/2023 05:20:55 PM
- S&P 500 Character Changes • ValueWalk • 07/06/2023 03:10:06 PM
- S&P 500 – As Bullish As It Gets • ValueWalk • 07/03/2023 04:01:21 PM
- The Great Gold Migration: How Asia Is Dominating The Global Gold Landscape • ValueWalk • 06/30/2023 05:07:35 PM
- S&P 500 Dip Buying And Tame PCE • ValueWalk • 06/30/2023 03:34:13 PM
- The Bullish Reversal In Gold Is Coming • ValueWalk • 06/29/2023 04:00:44 PM
- Insufficient S&P 500 Rotations • ValueWalk • 06/27/2023 02:41:42 PM
- Failing S&P 500 Rotations • ValueWalk • 06/23/2023 03:09:19 PM
- Countdown to S&P 500 Downleg • ValueWalk • 06/19/2023 01:49:20 PM
- Now THAT Was The Game-Changer For The Price Of Gold! • ValueWalk • 06/15/2023 04:40:35 PM
- S&P 500 Manages To Recover Initial Decline • ValueWalk • 06/15/2023 03:30:07 PM
- S&P 500 Manages To Recover From Tech-Driven Decline • ValueWalk • 06/15/2023 03:30:07 PM
- S&P 500 Withstands The Initial Selling – No Hike Tomorrow • ValueWalk • 06/13/2023 03:15:19 PM
- Roadmap For Mining Stocks – Courtesy Of The Stock Market • ValueWalk • 06/06/2023 03:17:49 PM
- Stocks To Still Extend S&P 500 Upswing • ValueWalk • 06/05/2023 03:31:02 PM
- AI, Stocks, And Gold Stocks – Connected After All • ValueWalk • 05/31/2023 03:29:15 PM
- Could Gold Miners Finally Stop Sliding?! • ValueWalk • 05/26/2023 08:42:37 PM
- S&P 500 Fine Selling Initiative • ValueWalk • 05/24/2023 03:06:00 PM
FEATURED Cannabix's Breath Logix Alcohol Device Delivers Positive Impact to Private Monitoring Agency in Montana, USA • Apr 25, 2024 8:52 AM
Bantec Reports an Over 50 Percent Increase in Sales and Profits in Q1 2024 from Q1 2023 • BANT • Apr 25, 2024 10:00 AM
Kona Gold Beverages, Inc. Announces Name Change to NuVibe, Inc. and Initiation of Ticker Symbol Application Process • KGKG • Apr 25, 2024 8:30 AM
Axis Technologies Group and Carbonis Forge Ahead with New Digital Carbon Credit Technology • AXTG • Apr 24, 2024 3:00 AM
North Bay Resources Announces Successful Equipment Test at Bishop Gold Mill, Inyo County, California • NBRI • Apr 23, 2024 9:41 AM
Epazz, Inc.: CryObo, Inc. solar Bitcoin operations will issue tokens • EPAZ • Apr 23, 2024 9:20 AM

