


| Followers | 689 |
| Posts | 143817 |
| Boards Moderated | 35 |
| Alias Born | 03/10/2004 |
Wednesday, November 15, 2017 11:20:40 AM
Technology Weakening, But How Much Selling Might We Expect?
By: Tom Bowley | November 15, 2017
For the third time in the last four days, we saw U.S. equities gap lower, only to reverse intraday to close near their highs of the session. It's still resulted in losses for the day, but it also shows the bull market resiliency that the bears are facing as they try to grab control of the near-term action. We're seeing fairly significant red futures once again this morning so the bulls will once again attempt to reclaim support by day's end.
All of our key indices finished lower on the session with the S&P 500 rallying to hold onto rising 20 day EMA support:
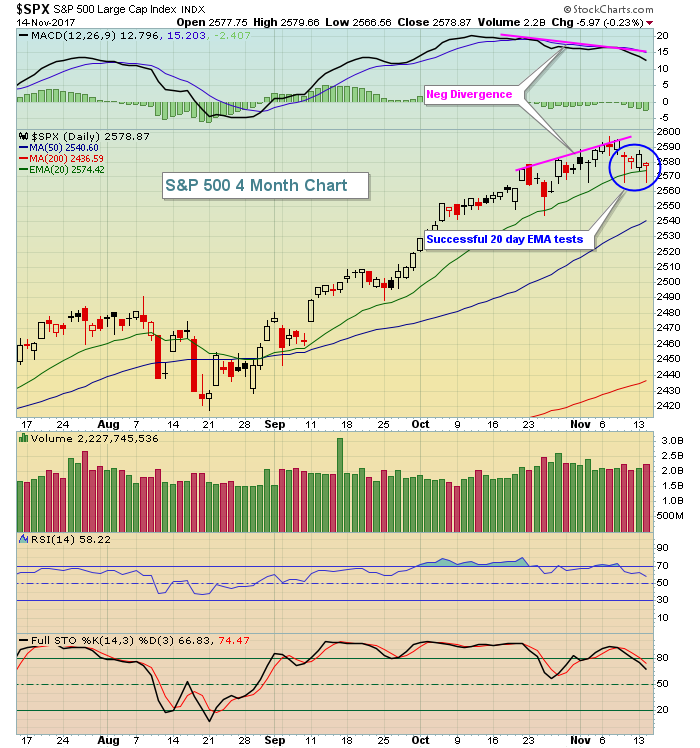
While the bulls continue to perform well in the very near-term, holding onto moving average support, don't lose sight of the fact that a negative divergence remains. That suggests we could see an upcoming 50 day SMA test. Don't rule it out.
Defensive areas of the market continue to provide leadership during this consolidation phase as utilities (XLU, +1.25%) and consumer staples (+0.35%) were the two best performing sectors on Tuesday. Profit taking in energy (XLE, -1.62%) was problematic as crude oil ($WTIC) has fallen to test its recent $55 per barrel breakout.
Pre-Market Action
Economic reports will pick up, beginning with this morning. Already, we've seen inflation at the consumer level come in at expectations - a positive development after inflation at the producer level showed signs of heating up in yesterday's economic report. October retail sales also aligned very closely with expectations. Only the Empire State manufacturing survey disappointed. Its reading of 19.4 was solid, but fell short of 26.0 consensus estimates.
The 10 year treasury yield ($TNX) is down 6 basis points at last check to 2.32% and that sudden drop is not helping U.S. stock futures. Also not helping are global markets as we're seeing fairly significant selling pressure around the world overnight and this morning. Asian markets were weak with losses of 1% or more in both Tokyo and Hong Kong. In Europe this morning, the German DAX (featured in Current Outlook section below) was down nearly 1%, adding to a slide of approximately 500 points the past six trading days.
Dow Jones futures are down over 100 points (at last check) in sympathy as we approach today's opening bell.
Current Outlook
There's a very tight positive correlation between the performance of the benchmark S&P 500 ($SPX) and the German DAX ($DAX). They tend to take turns in leadership, but over time they have proven to follow one another. One issue the S&P 500 currently faces is that selling has quite suddenly taken over in Germany. Here's a current look at the DAX:
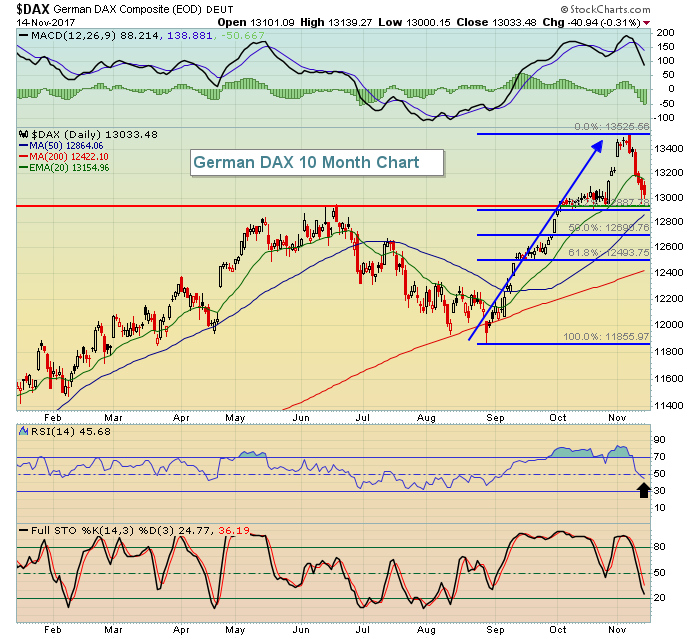
The 12900 level is fairly important on the DAX as the 50 day SMA is currently at 12864 and rising, price support resides closely to 12900, RSI has dipped into the 40s (typically a solid area of support during uptrends) and the first Fibonacci retracement support level (38.2%) is at 12887.
From a bullish perspective, we want to see the DAX reverse at its current level. Keep an eye on the DAX today.
Sector/Industry Watch
Unlike both financials (XLF) and industrials (XLI), the technology sector (XLK) did not suffer from slowing price momentum. Instead, the XLK simply became very stretched and overbought in the near-term. That's resulted in a need for consolidation and an unwinding of overbought conditions. That seems to be what's occurring now as the XLK's daily RSI has fallen from the mid-80s down to 70 at yesterday's close. Additional selling down to the rising 20 day EMA would not be a bad thing given the current technical state of the sector:
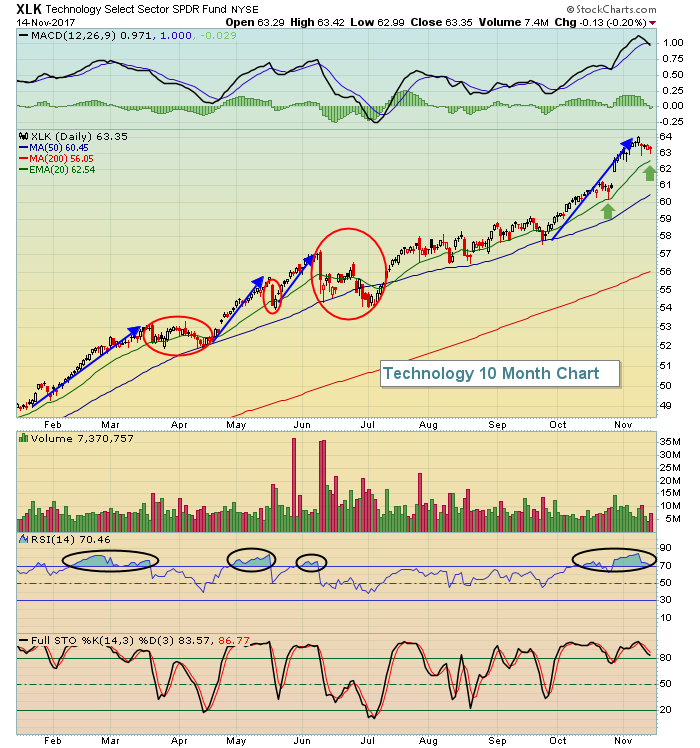
Following those huge advances (blue directional lines), we've seen a quick pullback (May) and two other more significant periods of consolidation (March-April, then June). Given the strength of the current daily momentum (MACD), I'd expect to see buying take place in technology if we see another 20 day EMA test (green arrows). The next price high, however, could see a negative divergence emerge. Such a development would significantly increase the risk of trading technology stocks. For now, I'd only look for relief from short-term overbought conditions. . .
* * *
http://stockcharts.com/articles/tradingplaces/2017/11/technology-weakening-but-how-much-selling-might-we-expect.html
• DiscoverGold
Information posted to this board is not meant to suggest any specific action, but to point out the technical signs that can help our readers make their own specific decisions. Your Due Dilegence is a must!
• DiscoverGold
Join the InvestorsHub Community
Register for free to join our community of investors and share your ideas. You will also get access to streaming quotes, interactive charts, trades, portfolio, live options flow and more tools.

