


| Followers | 689 |
| Posts | 143817 |
| Boards Moderated | 35 |
| Alias Born | 03/10/2004 |
Wednesday, November 15, 2017 7:58:46 AM
:::: DP Alert: SPY Rising Trend Channel Broken ::::
By: Erin Heim | November 14, 2017
DP Alert: SPY Rising Trend Channel Broken - DP Indicators Bearish in ST and IT - PMO SELL on UUP
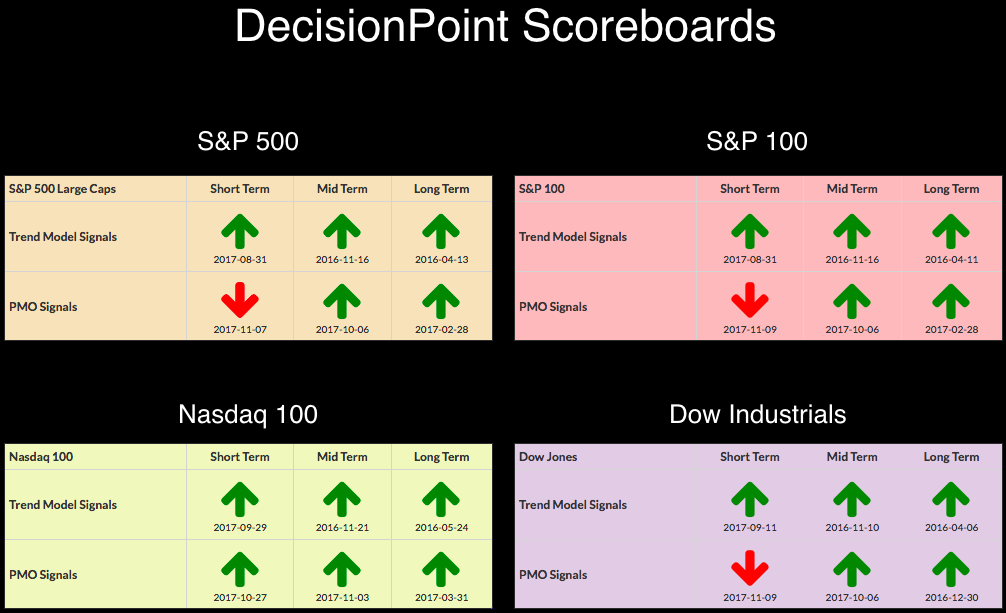
Since November 9th, the DP Scoreboards have been quiet. It isn't surprising to see the weakness on these Scoreboards to be short-term momentum given the recent decline. The SPY/SPX have now dropped below rising trend channels, but support remains. With DP indicators looking bearish, we could be in for more downside in both the short and intermediate terms.
SIGNALS: Here we include charts of any important signal changes triggered today by our Intermediate-Term Trend Model.
NO NEW SIGNALS TO REPORT
STOCKS
IT Trend Model: BUY as of 11/15/2016
LT Trend Model: BUY as of 4/1/2016
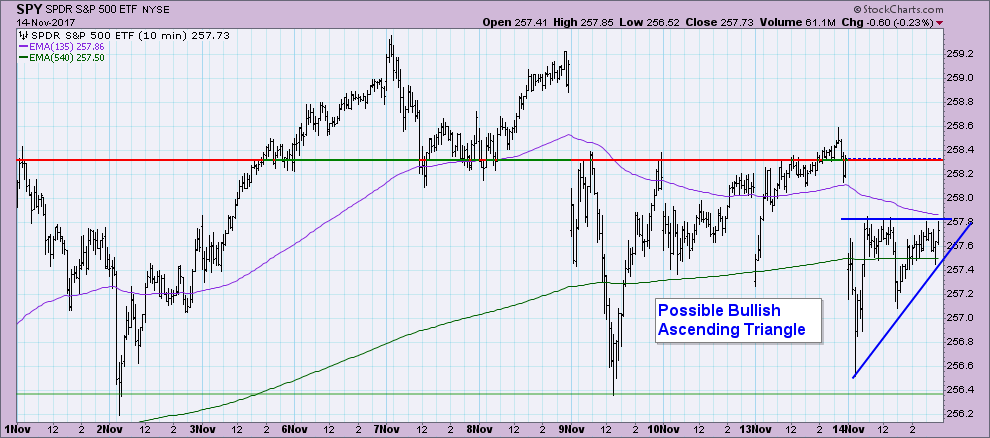
When you look at market action over the past 10 trading days, the decline we've been experiencing doesn't look so bad. Price has now bounced off the November 2 low twice. I do see a possible bullish ascending triangle which would call for some upside movement tomorrow.
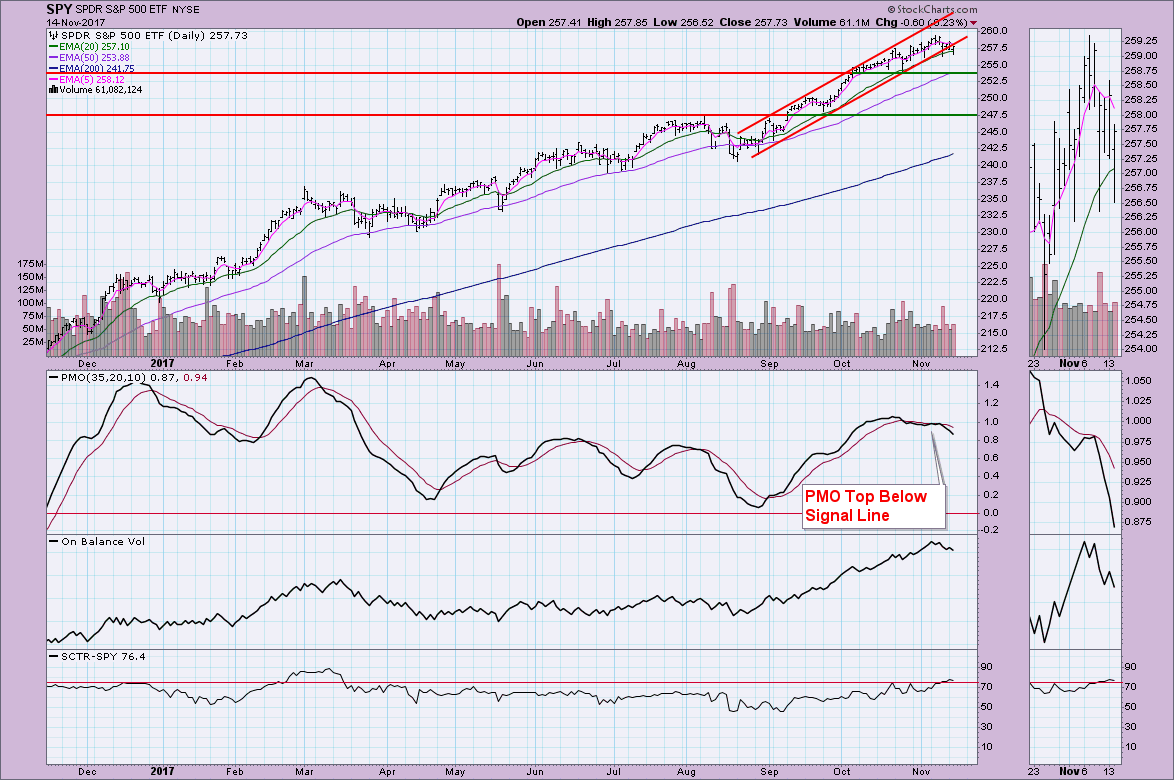
It is hard to call this a "breakdown" from the rising trend channel as it has more of the appearance of a 'drift' through the rising bottoms trendline. At this point, the 20-EMA is providing some support as well as the November low. The PMO is certainly a problem and now we can see OBV is trailing off. Internal strength remains based on the high SCTR value. If we do see more decline, the next area of support is at the mid-October lows.
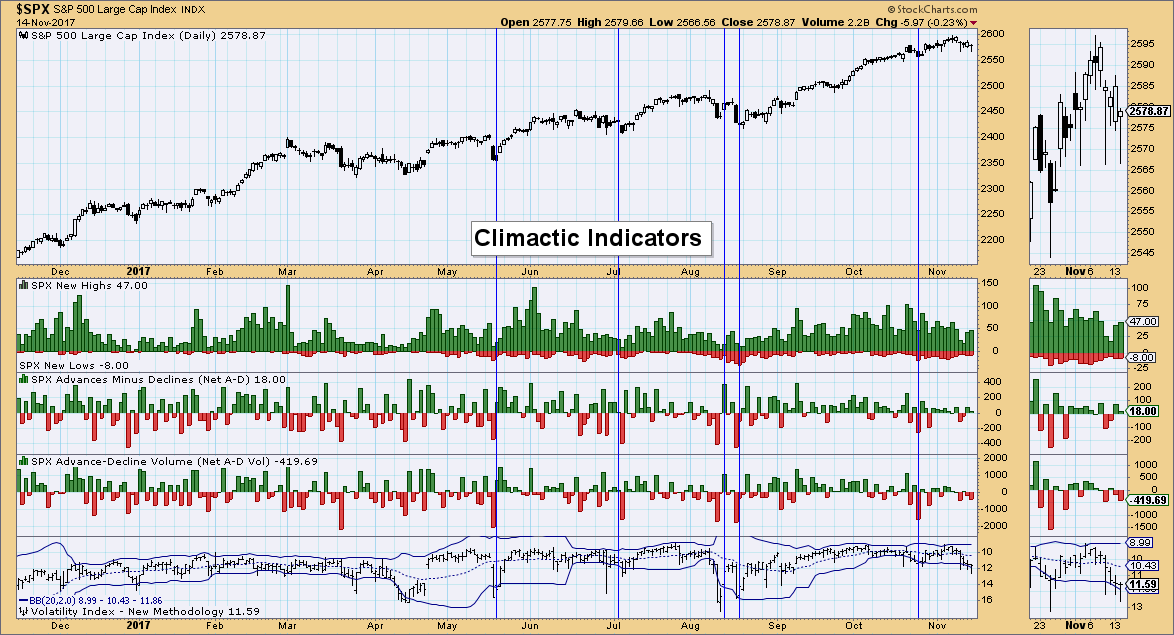
Climactic Indicators: I've annotated what usually happens when we get a penetration of the lower Bollinger Band on the VIX. This has the appearance of a selling exhaustion. Unfortunately, I'm not getting any climactic readings on the other indicators. The final candlestick in this current decline is a hammer which would also suggest a rally pop tomorrow.
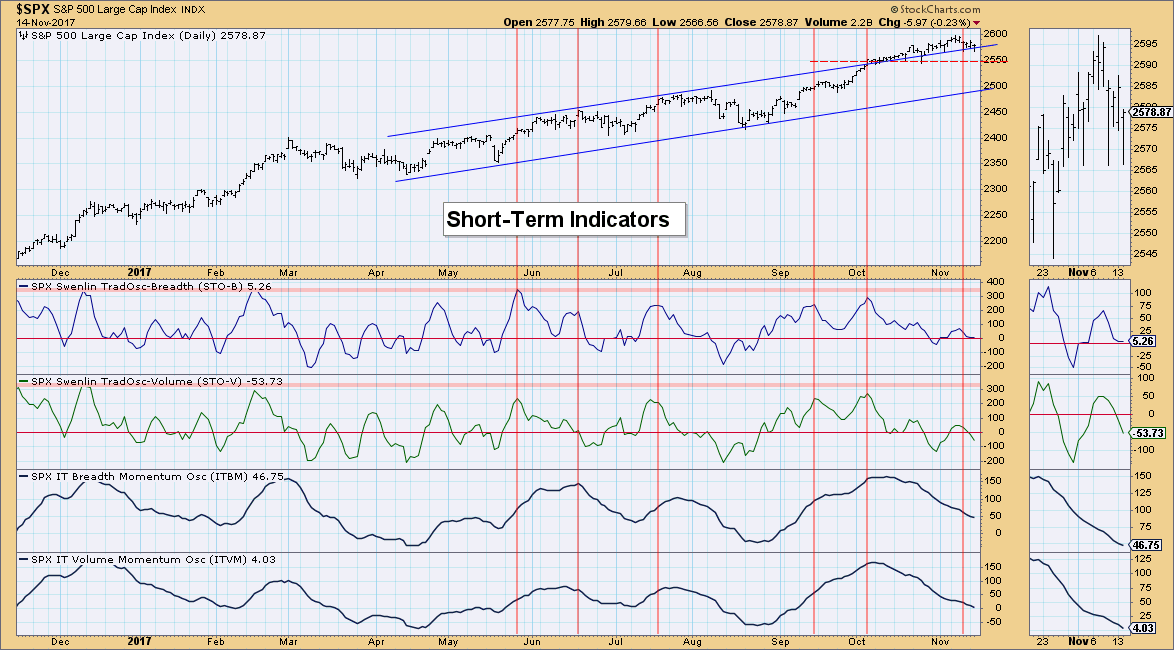
Short-Term Indicators: The remainder of our indicators are quite negative. STOs topped a week or so ago and continue to decline. I've included the IT indicators in the lower windows to give you a view of what is happening with them in their oscillation. Obviously what we want to see is both bottoming and rising at the same time. The pivotal moves typically occur at coincident bottoms. We're not there yet.
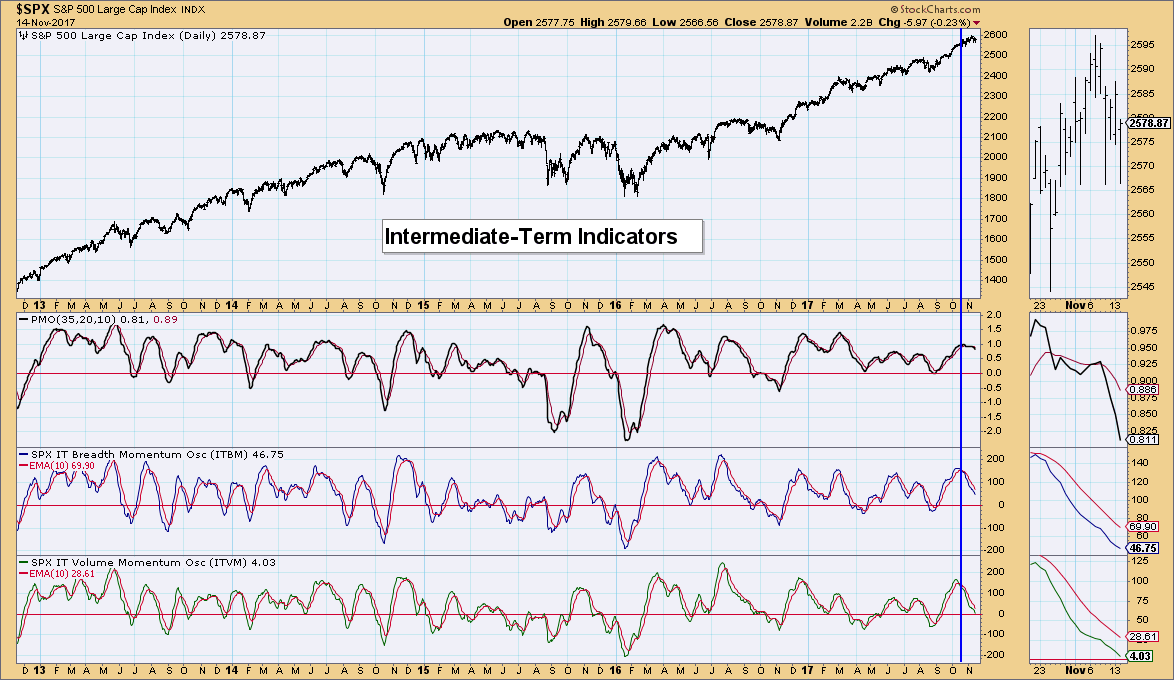
Intermediate-Term Indicators: The decline and lack of deceleration is clear on not only the PMO but the ITBM and ITVM. They are reaching neutral territory but appear to have no interest in decelerating, let alone bottoming. I would expect to see more difficulties in the market, although not a correction. Those seem to have become extinct since November 2016.
Conclusion: We should see a bit of a rally pop tomorrow or Thursday based on VIX readings moving outside the lower Bollinger Band. However, short and intermediate-term indicators are configured very bearishly, so I would expect to see more consolidation or possibly a pullback to October lows. . .
* * *
http://stockcharts.com/articles/decisionpoint/2017/11/dp-alert-rising-trend-channel-broken-on-spy---dp-indicators-bearish-in-st-and-it.html
• DiscoverGold
Click on "In reply to", for Authors past commentaries
By: Erin Heim | November 14, 2017
DP Alert: SPY Rising Trend Channel Broken - DP Indicators Bearish in ST and IT - PMO SELL on UUP
Since November 9th, the DP Scoreboards have been quiet. It isn't surprising to see the weakness on these Scoreboards to be short-term momentum given the recent decline. The SPY/SPX have now dropped below rising trend channels, but support remains. With DP indicators looking bearish, we could be in for more downside in both the short and intermediate terms.

SIGNALS: Here we include charts of any important signal changes triggered today by our Intermediate-Term Trend Model.
NO NEW SIGNALS TO REPORT
STOCKS
IT Trend Model: BUY as of 11/15/2016
LT Trend Model: BUY as of 4/1/2016
When you look at market action over the past 10 trading days, the decline we've been experiencing doesn't look so bad. Price has now bounced off the November 2 low twice. I do see a possible bullish ascending triangle which would call for some upside movement tomorrow.

It is hard to call this a "breakdown" from the rising trend channel as it has more of the appearance of a 'drift' through the rising bottoms trendline. At this point, the 20-EMA is providing some support as well as the November low. The PMO is certainly a problem and now we can see OBV is trailing off. Internal strength remains based on the high SCTR value. If we do see more decline, the next area of support is at the mid-October lows.

Climactic Indicators: I've annotated what usually happens when we get a penetration of the lower Bollinger Band on the VIX. This has the appearance of a selling exhaustion. Unfortunately, I'm not getting any climactic readings on the other indicators. The final candlestick in this current decline is a hammer which would also suggest a rally pop tomorrow.

Short-Term Indicators: The remainder of our indicators are quite negative. STOs topped a week or so ago and continue to decline. I've included the IT indicators in the lower windows to give you a view of what is happening with them in their oscillation. Obviously what we want to see is both bottoming and rising at the same time. The pivotal moves typically occur at coincident bottoms. We're not there yet.

Intermediate-Term Indicators: The decline and lack of deceleration is clear on not only the PMO but the ITBM and ITVM. They are reaching neutral territory but appear to have no interest in decelerating, let alone bottoming. I would expect to see more difficulties in the market, although not a correction. Those seem to have become extinct since November 2016.

Conclusion: We should see a bit of a rally pop tomorrow or Thursday based on VIX readings moving outside the lower Bollinger Band. However, short and intermediate-term indicators are configured very bearishly, so I would expect to see more consolidation or possibly a pullback to October lows. . .
* * *
http://stockcharts.com/articles/decisionpoint/2017/11/dp-alert-rising-trend-channel-broken-on-spy---dp-indicators-bearish-in-st-and-it.html
• DiscoverGold
Click on "In reply to", for Authors past commentaries
Information posted to this board is not meant to suggest any specific action, but to point out the technical signs that can help our readers make their own specific decisions. Your Due Dilegence is a must!
• DiscoverGold
Join the InvestorsHub Community
Register for free to join our community of investors and share your ideas. You will also get access to streaming quotes, interactive charts, trades, portfolio, live options flow and more tools.

