Energy sector bursting into leading quadrant on Relative Rotation Graph By: Julius de Kempenaer | November 14, 2017
Energy sector bursting into leading quadrant on Relative Rotation Graph, strong potential for EOG and COP
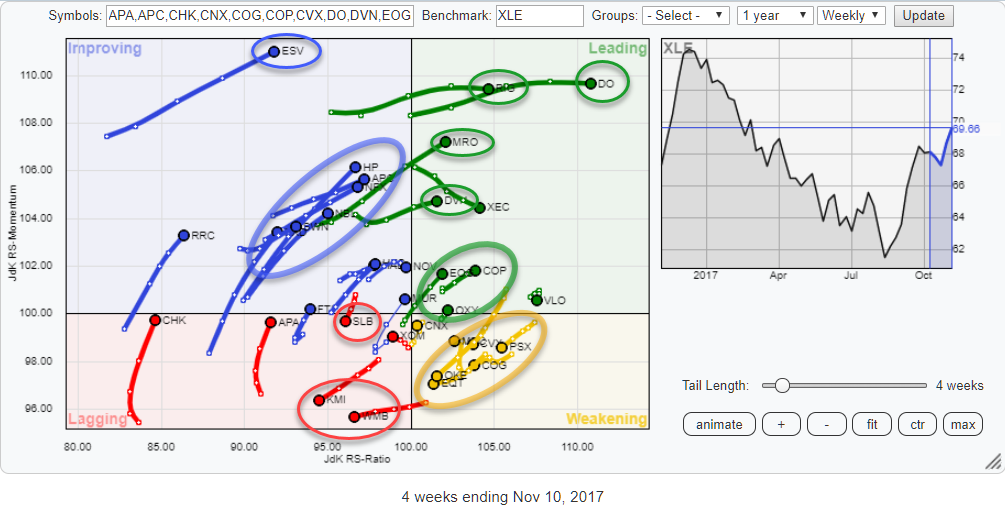
The Relative Rotation Graph above shows all the members of the S&P 500 Energy sector against XLE, the ETF that tracks the Energy sector price index.
The main reason for looking at this universe at the moment is the fact that the sector (XLE) on the RRG for US sectors is about to burst into the leading quadrant (chart further down in the article).
The chart above highlights a few areas of interest which I will dive into a bit deeper.
We will investigate the cluster of stocks inside the weakening quadrant as well as the cluster of stocks on the opposite side, inside the improving quadrant. Also inside the improving quadrant, ESV draws attention at the high JdK RS-Momentum level and its long tail.
Inside the lagging quadrant KMI, WMB, and SLB show (further) weakness, while there are a number of stocks inside leading that are powering ahead.
Summary
• XLE sector crossing over into the leading quadrant • OKE and EQT coming dangerously close to lagging quadrant • CVX tracing rotation of OKE • ESV too low on JdK RS-Ratio scale • HP, NFX, and APC providing good opportunities • Avoid SLB and KMI (both inside lagging quadrant) • Picking EOG and COP as potential leaders within Energy sector.âÂÂÂÂÂÂÂÂ?ÂÂÂÂÂÂÂÂ?
From a sector perspective
On the Relative Rotation Graph for US sectors, energy (XLE) is found on the edge of crossing over from improving into leading but more importantly at a positive RRG-Heading (0-90 degrees) at a high JdK RS-Momentum level and showing a long, powerful, tail.
The improvement for the energy sector was visible on the Relative Rotation Graphs for a while already and mentioned recently in RRG blog posts here and here.
With the crossover into the leading quadrant about to happen, let's inspect the relative rotation of the individual members (stocks) inside the energy sector.
Inside the weakening quadrant
Except for CNX and MPC, all stocks inside the weakening quadrant are moving at e negative RRG-Heading. Especially OKE and EQT are getting dangerously close to the 100-level on the JdK RS-Ratio and a crossover into lagging.
Another interesting observation that can be made on this subset of the Energy universe is the fact that CVX is tracking the rotation of OKE almost to the dot. . .
Information posted to this board is not meant to suggest any specific action, but to point out the technical signs that can help our readers make their own specific decisions. Your Due Dilegence is a must! • DiscoverGold
Register for free to join our community of investors and share your ideas. You will also get access to streaming quotes, interactive charts, trades, portfolio, live options flow and more tools.


 News
News  Market Data
  Discover