


| Followers | 679 |
| Posts | 141164 |
| Boards Moderated | 36 |
| Alias Born | 03/10/2004 |
Monday, October 16, 2017 9:07:43 AM
By: Clive Maund | October 15, 2017
We’ve all had people come up to us and say “Do you want the good news first or the bad news?” I always opt for the bad news first, to get it out of way and end on a lighter note. The bad news is that the dollar looks set to stage a significant “swansong” rally in coming weeks, which will probably result in gold being beaten down again. The good news is that once that’s done its toast – and that’s when the big gold and silver bullmarket that longer-term charts are calling for will really get underway.
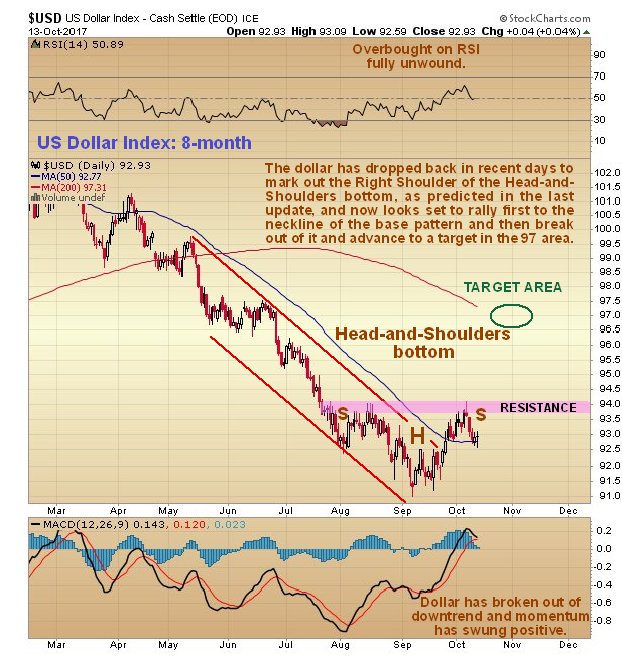
The last update called for the dollar to drop down to mark out the Right Shoulder of a Head-and-Shoulders bottom pattern, and for gold to break out of its rather steep intermediate downtrend and rally, and that is exactly what has since happened. On its latest 8-month chart, we can see how the dollar has backed off to the vicinity of its flattened out 50-day moving average and the vicinity of the Left Shoulder low of the base pattern, in order to mark out the Right Shoulder low. Three bullish developments to be noted that result from the dollar rising out of the Head of the pattern are the breakout from the downtrend, the break clear above the 50-day moving average, and the big improvement in momentum (MACD), which is swinging positive. If our interpretation that this is a genuine Head-and-Shoulders bottom is proven valid, the pattern targets the 97 area in coming weeks, probably by early November. Needless to say, this will not be good news for gold and silver prices.
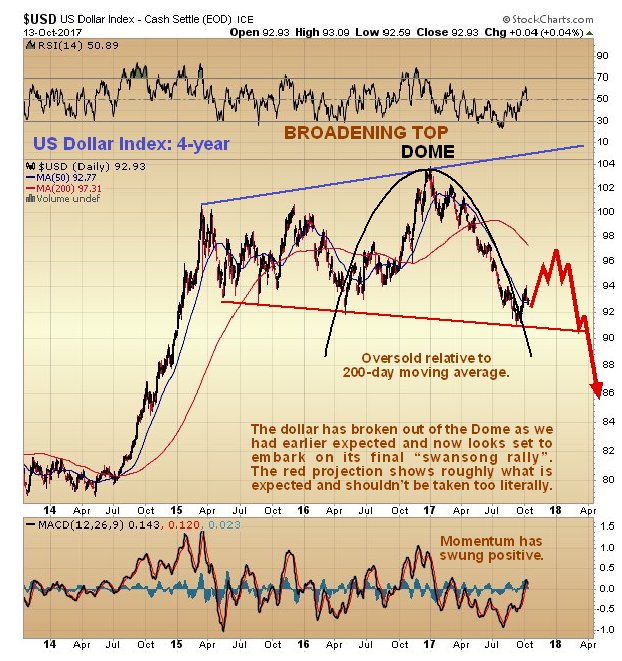
Our prediction made many weeks ago that the dollar would rally off the lower boundary of its big bullhorn pattern shown on the 4-year chart below to break out above its restraining Dome has proven to be correct, and a projection has been drawn on this chart showing roughly what is expected to happen. As we saw above on the 8-month chart, the base pattern now approaching completion targets the 97 area approx. This is the “swansong rally” – the dollar’s last rally before it “hands in its dinner pail”, and should present a wonderful last opportunity to accumulate the better gold and silver stocks, before the dollar does an about face, and breaks down from the large Broadening Top pattern into a severe decline.
The Hedgers chart has been warning for weeks that the dollar will reverse and rally, as has been pointed out repeatedly. The latest chart shows the rally is still ahead of us – which is congruent with the dollar being at the Right Shoulder low of its Head-and-Shoulders bottom.
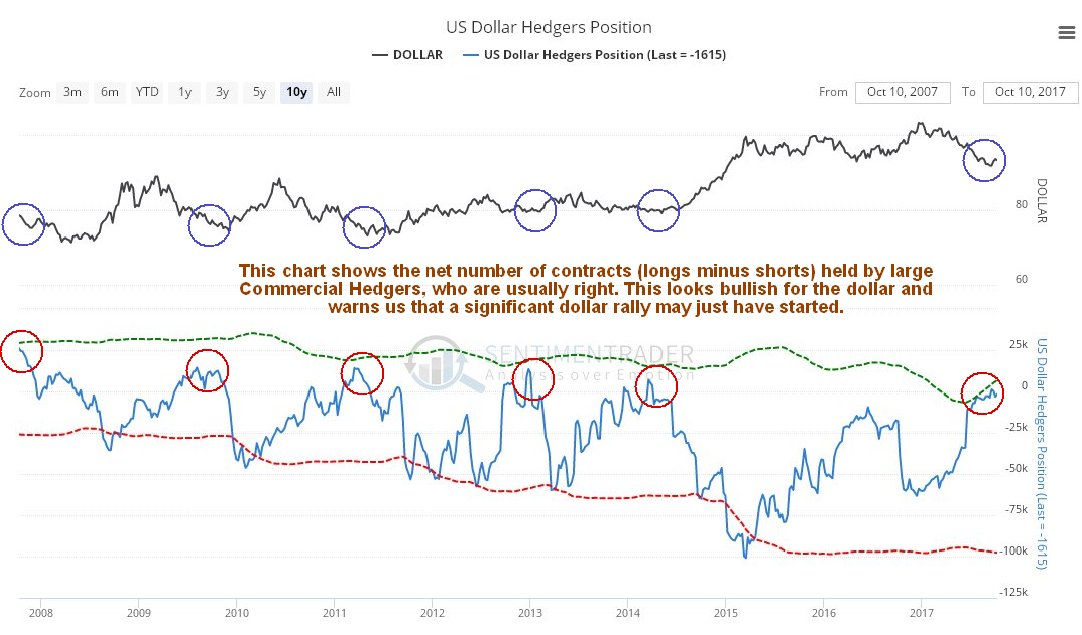
Chart courtesy of www.sentimentrader.com
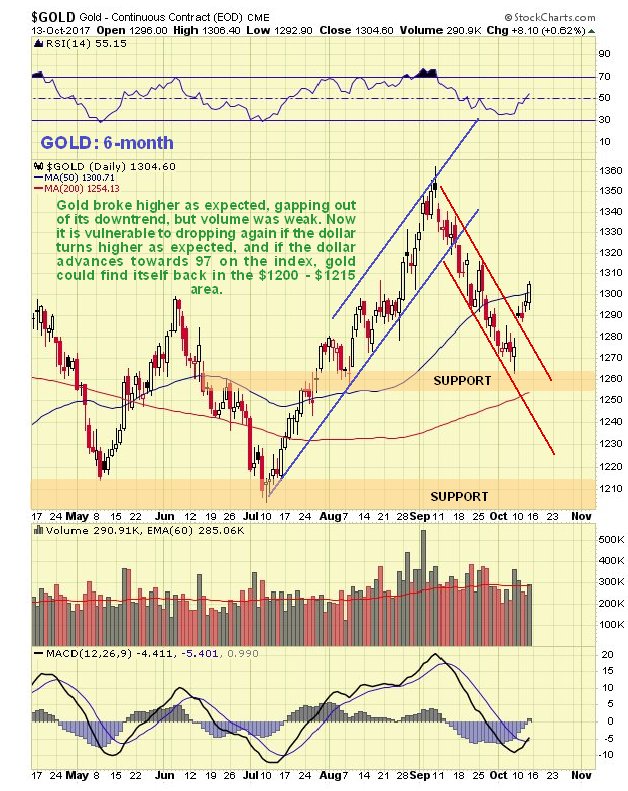
In light of the above it is logical to expect gold’s plucky little breakout from the steep downtrend channel shown on its 6-month chart below to abort, and if the dollar advances towards the 97 area on the index, we would expect gold to react back, probably to the $1200 - $1215 area.
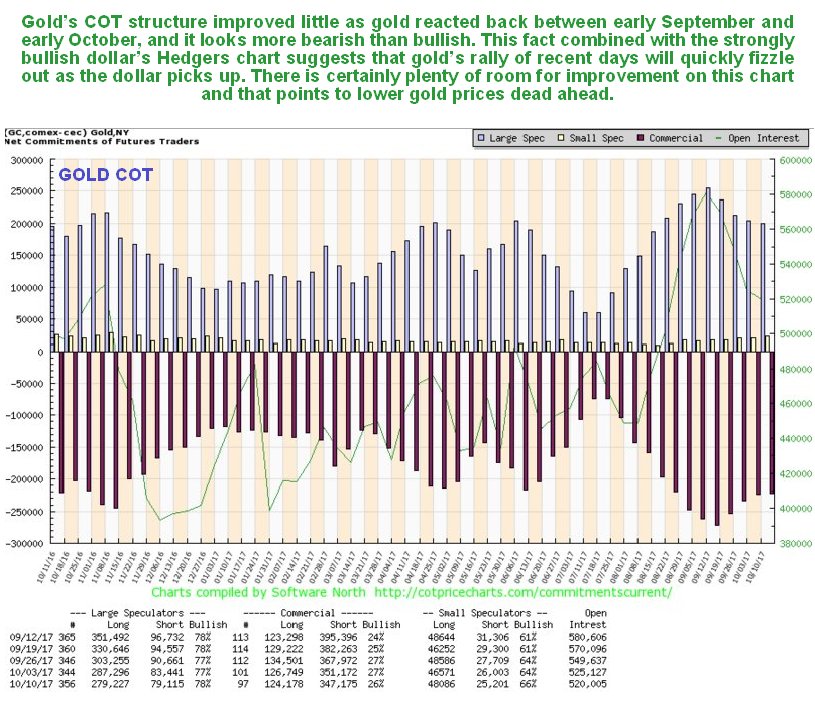
Such a reaction back by gold accords with its latest COT chart, which still looks more bearish than bullish, since gold’s COT structure improved but little on its recent downtrend. There is still a lot of room for improvement on this chart – and that probably means lower gold prices dead ahead…
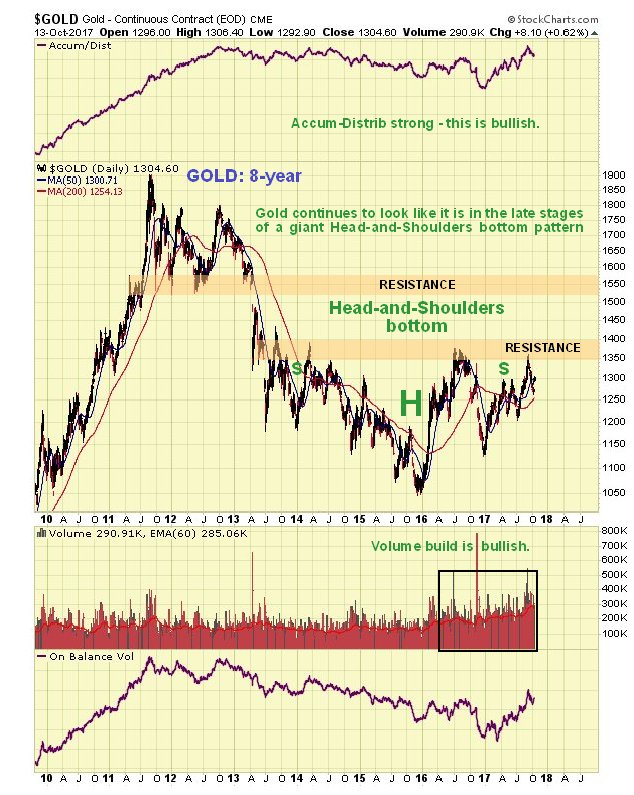
On gold’s 8-year chart it continues to look like it is in the late stages of a giant Head-and-Shoulders bottom pattern. The buildup in volume over the past 20 months certainly looks positive, especially over the past several months, all the more so because it has driven volume indicators higher, notably the Accum-Distrib line, which is not far off making new highs – exceeding its level at the 2011 peak. Once gold breaks above the resistance level approaching $1400 it will be on its way, although it will then have to contend with another important band of resistance in the $1510 - $1560 range. A near-term retreat by gold to the $1200 - $1215 area in the face of a dollar rally will not damage this long-term technical picture.
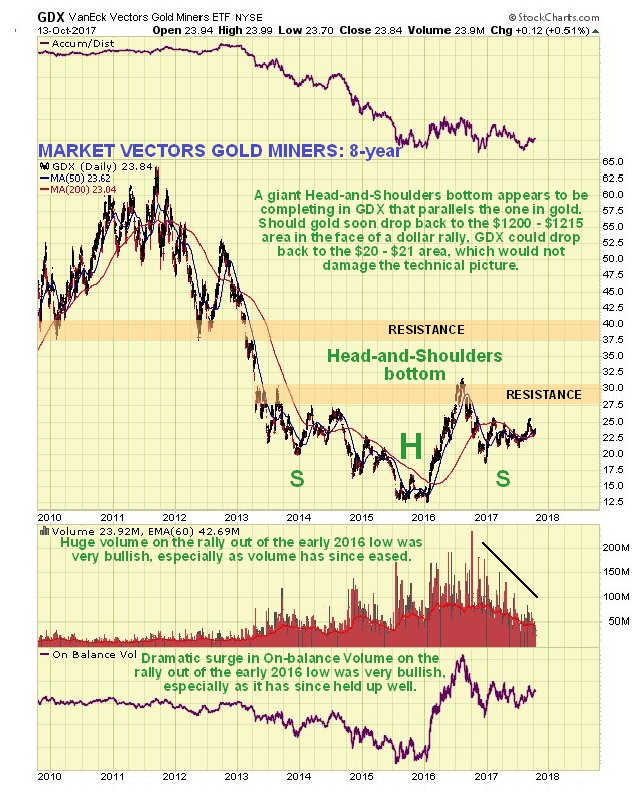
The Market Vectors Gold Miners, GDX, which functions as a gold stocks index, is marking out a giant Head-and-Shoulders bottom that roughly parallels the one completing in gold itself. A near-term decline to $20 - $21 in GDX will be viewed as presenting another important buying opportunity for the sector. The volume pattern during the build out of this base pattern is very bullish, with big volume on the rise out of the low (Head) of the pattern, tailing off steadily as the Right Shoulder has formed.
A mistake commonly made by gold and silver bugs, especially those close to or involved in the mining industry is to become “wed” to the sector to the exclusion of most everything else. This habit has ruined a good many investors in the Precious Metals sector in recent years. Investing should be regarded as an “opportunity cost game”, where you seek always to maximize your returns within a given timeframe consistent with an acceptable level of risk. This is the philosophy on clivemaund.com which is why we made a detour into the marijuana sector last year ahead of the legalization votes, when it boomed, and why we have invested in a variety of different sectors and stocks this year, notably the Biotech and Medical sector. There is no need to wait around on the Precious Metals sector to start a major uptrend, when, apart from individual outstanding opportunities in the sector than can occur at any time, it is possible to go with whatever is performing in the here and now.
We have had a number of outstanding successes in recent months and weeks where we traded on the basis of some very clear and useful chart patterns and signals, and a number of our stocks have produced some classic examples of chart patterns involving different types of candlesticks and price and volume patterns, often in combination, in the recent past. There is one in particular that I would like to draw your attention to in CHART SCHOOL – Gravestone Doji and Parabolic Blowoff calls a top, where just on the one chart going back 4-months we see a dramatic confluence of different factors – candlesticks, parabolic slingshot, various oscillators and the volume pattern all calling a top RIGHT NOW for a particular stock, and this also provides examples of breakaway gaps and a Flag. We sold this stock on Friday. To take a look at its chart, all you have to do is click on the link above, and for a good measure a couple of other interesting chart examples that we traded are included in this article, which is intended to be educational.
Hope you like what you see…
https://www.clivemaund.com/article.php?id=68
• DiscoverGold
Click on "In reply to", for Authors past commentaries
****************************************
*** For Market Direction and Trends visit our board:
https://investorshub.advfn.com/Market-Direction-and-Trends-26249/
Information posted to this board is not meant to suggest any specific action, but to point out the technical signs that can help our readers make their own specific decisions. Your Due Dilegence is a must!
• DiscoverGold
Recent GDX News
- YieldMax GDXY Name Change • GlobeNewswire Inc. • 01/25/2024 04:22:00 PM
- Surging S&P 500 Breadth • ValueWalk • 07/19/2023 03:16:37 PM
- S&P 500 Corrects In Breadth • ValueWalk • 07/18/2023 03:08:49 PM
- If The USDX Fell So Much, Why Didn’t Gold Truly Soar? • ValueWalk • 07/17/2023 05:16:20 PM
- USD’s Decline That’s… Bearish For Gold?! • ValueWalk • 07/12/2023 02:38:08 PM
- S&P 500 Late Day Reversal Worry • ValueWalk • 07/10/2023 03:17:34 PM
- Massive Gaming Celebrates Global Launch of House of Blackjack with USDC Earning Race • ValueWalk • 07/10/2023 02:44:17 PM
- Breathers In Mining Stocks Are Not Real Rallies • ValueWalk • 07/06/2023 05:20:55 PM
- S&P 500 Character Changes • ValueWalk • 07/06/2023 03:10:06 PM
- S&P 500 – As Bullish As It Gets • ValueWalk • 07/03/2023 04:01:21 PM
- The Great Gold Migration: How Asia Is Dominating The Global Gold Landscape • ValueWalk • 06/30/2023 05:07:35 PM
- S&P 500 Dip Buying And Tame PCE • ValueWalk • 06/30/2023 03:34:13 PM
- The Bullish Reversal In Gold Is Coming • ValueWalk • 06/29/2023 04:00:44 PM
- Insufficient S&P 500 Rotations • ValueWalk • 06/27/2023 02:41:42 PM
- Failing S&P 500 Rotations • ValueWalk • 06/23/2023 03:09:19 PM
- Countdown to S&P 500 Downleg • ValueWalk • 06/19/2023 01:49:20 PM
- Now THAT Was The Game-Changer For The Price Of Gold! • ValueWalk • 06/15/2023 04:40:35 PM
- S&P 500 Manages To Recover Initial Decline • ValueWalk • 06/15/2023 03:30:07 PM
- S&P 500 Manages To Recover From Tech-Driven Decline • ValueWalk • 06/15/2023 03:30:07 PM
- S&P 500 Withstands The Initial Selling – No Hike Tomorrow • ValueWalk • 06/13/2023 03:15:19 PM
- Roadmap For Mining Stocks – Courtesy Of The Stock Market • ValueWalk • 06/06/2023 03:17:49 PM
- Stocks To Still Extend S&P 500 Upswing • ValueWalk • 06/05/2023 03:31:02 PM
- AI, Stocks, And Gold Stocks – Connected After All • ValueWalk • 05/31/2023 03:29:15 PM
- Could Gold Miners Finally Stop Sliding?! • ValueWalk • 05/26/2023 08:42:37 PM
- S&P 500 Fine Selling Initiative • ValueWalk • 05/24/2023 03:06:00 PM
VAYK Discloses Strategic Conversation on Potential Acquisition of $4 Million Home Service Business • VAYK • May 9, 2024 9:00 AM
Bantec's Howco Awarded $4.19 Million Dollar U.S. Department of Defense Contract • BANT • May 8, 2024 10:00 AM
Element79 Gold Corp Successfully Closes Maverick Springs Option Agreement • ELEM • May 8, 2024 9:05 AM
Kona Gold Beverages, Inc. Achieves April Revenues Exceeding $586,000 • KGKG • May 8, 2024 8:30 AM
Epazz plans to spin off Galaxy Batteries Inc. • EPAZ • May 8, 2024 7:05 AM
Moon Equity Holdings, Corp. Announces Acquisition of Wikolo, Inc. • MONI • May 7, 2024 9:48 AM

