Weekly Market Summary By: Urban Carmel | September 30, 2017
Summary: The major US indices traded at new all-time highs (ATH) again this week, led by surging small cap stocks. SPX is now higher 6 months in a row and 10 of the past 11 months; that level of momentum has never marked a bull market high.
Short-term optimism has reached an extreme that has resulted in a lower weekly close within the next 6 weeks every time over the past 5 years.
The fundamental narrative for the current rally is that the Trump administration's tax plan will boost earnings by an estimated 6%. If investors expect the tax plan to also cause economic growth to accelerate, they are very likely to be disappointed.
* * *
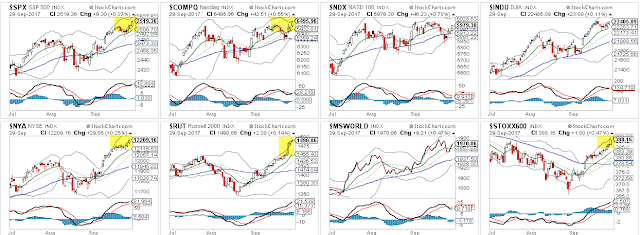
SPX, COMPQ, RUT and NYSE made new all-time highs (ATH) again this week. SPX has been up 5 of the last 6 weeks. The dominant trend remains higher. Enlarge any image by clicking on it.
The set up for this week was for a bounce off the 13-ema (on its first touch in 3 weeks; green line) and then a higher high in price (momentum highs are followed by price highs; slanted line in the top panel). That post is here. SPY ended the week at the top of 7-month price channel that has marked stiff resistance since winter (arrows).
The long-term outlook for US equities is positive.
September became the sixth month in a row that SPX has risen. In the past 90 years, this has happened 26 other times, with SPX closing higher either 1 or 3 months later in 92% of instances. In the two instances that it failed, stocks closed higher by 1 year later. A bear market did not start within 3 months of any of these instances; there was always a higher high ahead (from Nautilus Research).
Moreover, since 1928, when SPX has risen in every month from May through September, as it has this year, it has risen in the 4th quarter every time (from Ryan Detrick).
The most salient feature of the US equity market this year has been the persistence of the uptrend. SPX is up more than 12% YTD but the maximum drawdown has been just 3%, tied for the lowest of the past 37 years. The median annual drawdown is about 8% (from JPM).
That is significant, as the studies presented above and in prior weeks demonstrate that persistent uptrends do not quickly reverse direction. If past is prologue then SPX is likely to see a series of 3-5% swings (higher and lower) - creating a sawtooth pattern as the uptrend weakens - before a more significant drop takes place. This process has not yet started. . .
Information posted to this board is not meant to suggest any specific action, but to point out the technical signs that can help our readers make their own specific decisions. Your Due Dilegence is a must! • DiscoverGold
Register for free to join our community of investors and share your ideas. You will also get access to streaming quotes, interactive charts, trades, portfolio, live options flow and more tools.


 News
News  Market Data
  Discover