Tesla Weakens But Chart Is On Cruise Control By: Tom Bowley | September 24, 2017
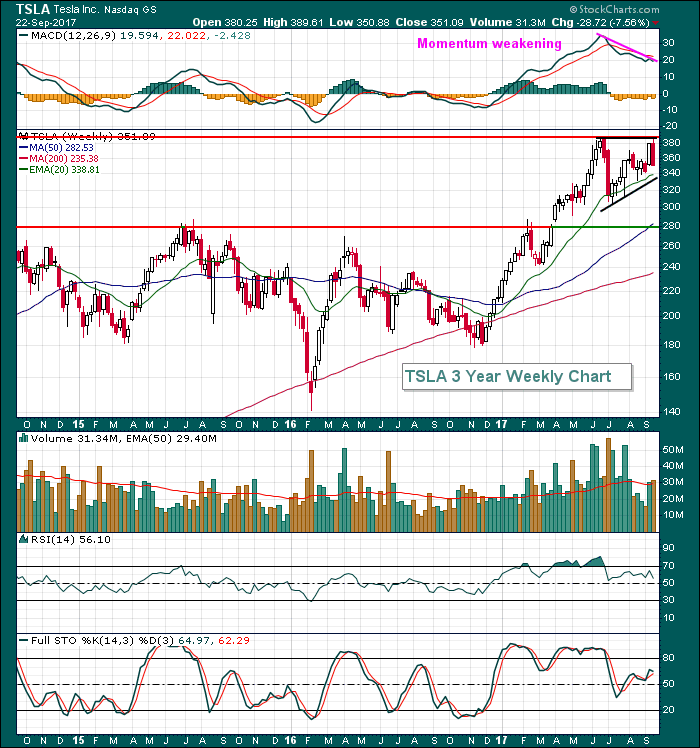
Tesla (TSLA) remains a crowd favorite as the stock's 2017 advance has been accompanied by extremely heavy volume. I see major accumulation when I look at TSLA's chart. But like every other stock, momentum can become an issue from time to time and TSLA appears to be battling momentum issues. Here's the latest weekly chart after TSLA dropped 7.56% last week:
Back in June, TSLA's weekly RSI moved above 80 and that's, quite frankly, an unsustainable level. Consolidation began at that point and I expect to see one of two things moving forward. Either TSLA continues to consolidate in a potential bullish ascending triangle with upcoming price lows in the 340-350 area or the slowing momentum results in a drop back to test recent lows and price support from the 280-300 range.
In either case, I'd be a buyer of TSLA. Obviously, the best reward to risk would be that 280-300 test, but I'm not sure we get there.
Information posted to this board is not meant to suggest any specific action, but to point out the technical signs that can help our readers make their own specific decisions. Your Due Dilegence is a must! • DiscoverGold
Register for free to join our community of investors and share your ideas. You will also get access to streaming quotes, interactive charts, trades, portfolio, live options flow and more tools.


 News
News  Market Data
  Discover