(SPY) Weekly Wrap: AAPL Leads Market Top By: Carl Swenlin | September 22, 2017
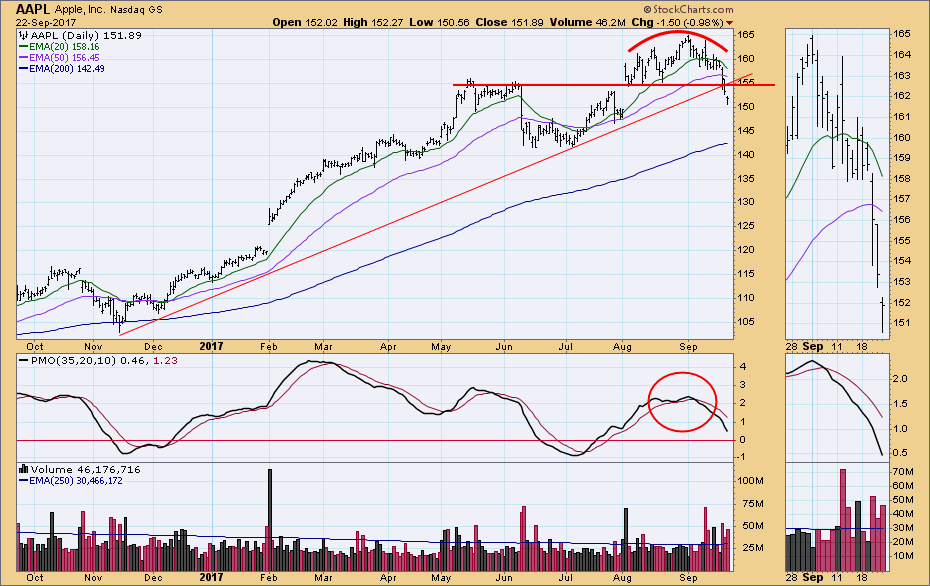
We usually feature a SPY chart in this space, but Apple (AAPL) has really grabbed my attention recently. I have been watching it for a few weeks as it formed a rounded top, and finally broke down through horizontal support on Thursday. AAPL is important to the broad market because it is so heavily weighted in the major market indexes. If it tanks, it will certainly affect the rest of the market. On the positive side, after three day's of selling, it appears to have made a short-term bottom.
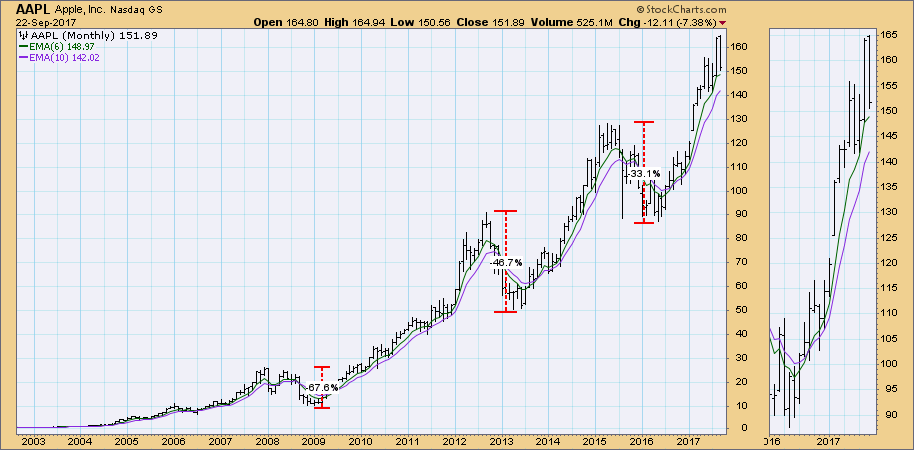
I know it is blasphemy to speak ill of AAPL, but a healthy correction is possible. On the monthly chart below we can see that there have been three major pullbacks in the last ten years, and sufficient time has elapsed since the last one, that it would not be unreasonable to expect another correction at this time. Actually, it is already in a correction (-9%). The question is when it will end.
STOCKS
IT Trend Model: BUY as of 11/15/2016
LT Trend Model: BUY as of 4/1/2016
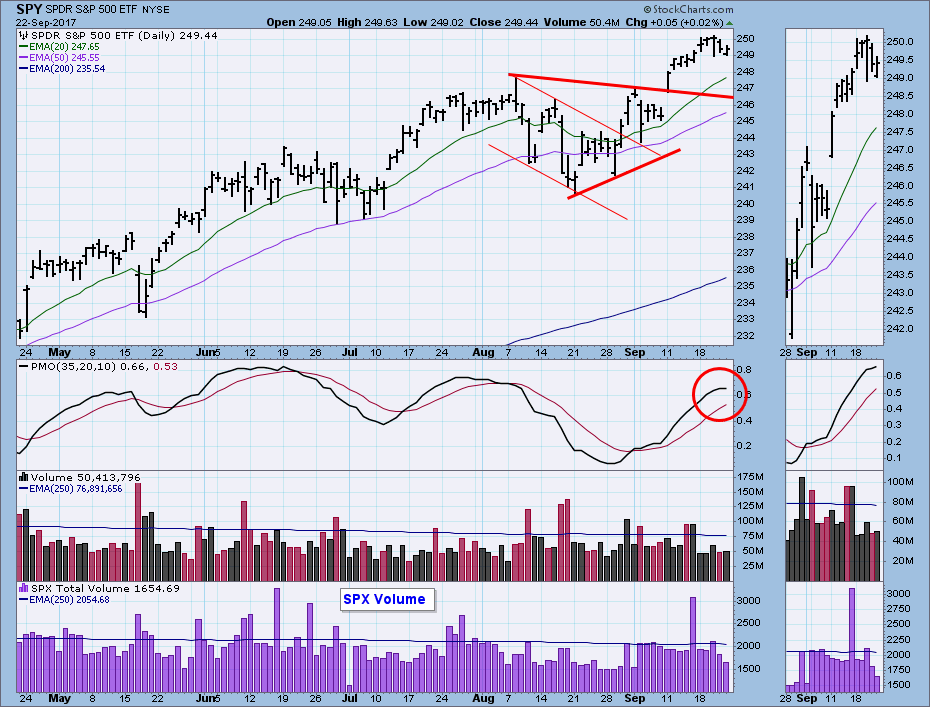
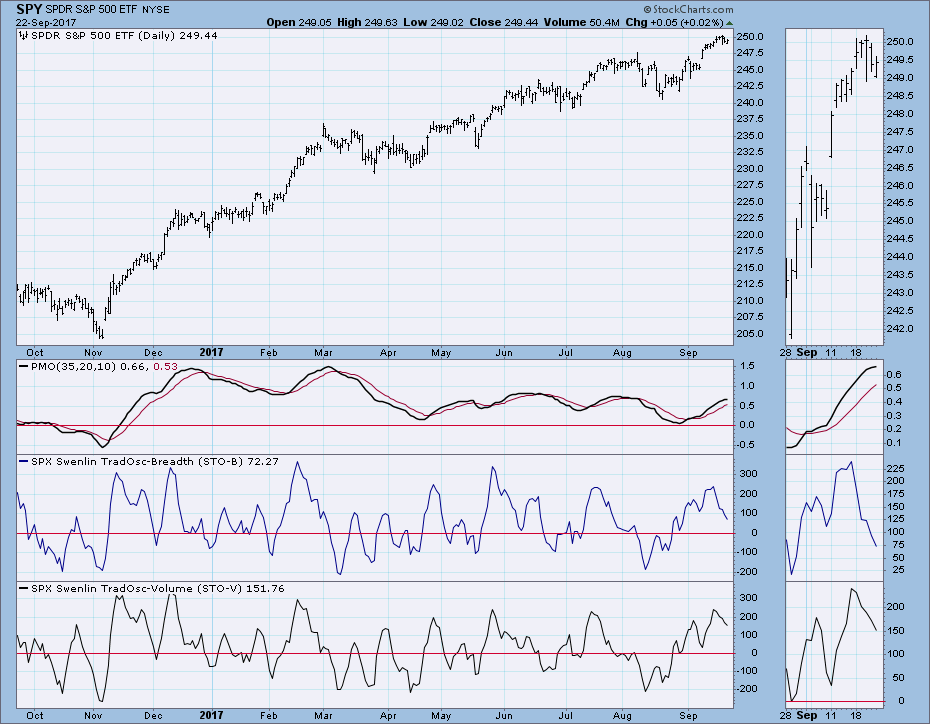
The daily chart shows the market very close to all-time highs, but it looks as if it is trying to top. The daily PMO is overbought and about to top as well.
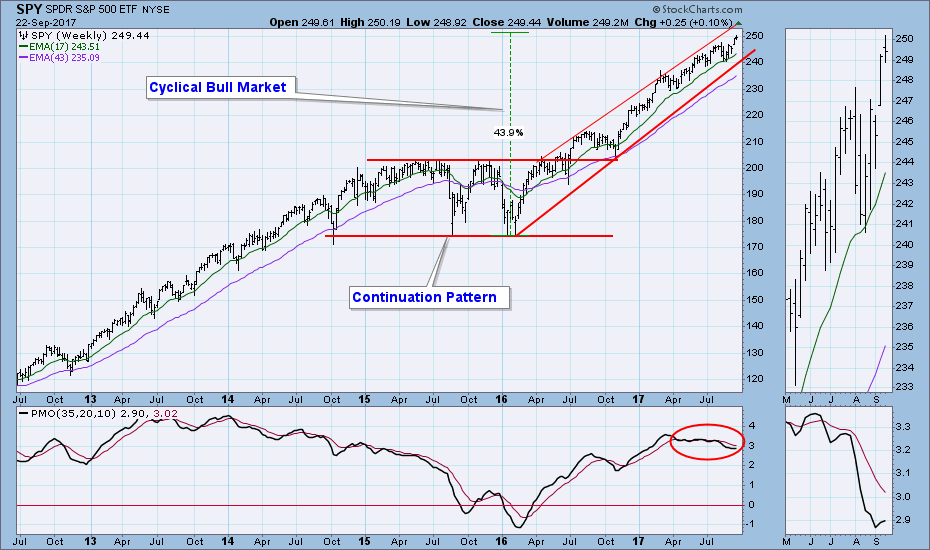
The weekly PMO turned up last week. There is room for a small correction without doing any damage in this time frame.
Short-Term Market Indicators: They topped last week, but it wasn't until this week that we finally got a small price top. The indicators leave plenty of room for further price decline.
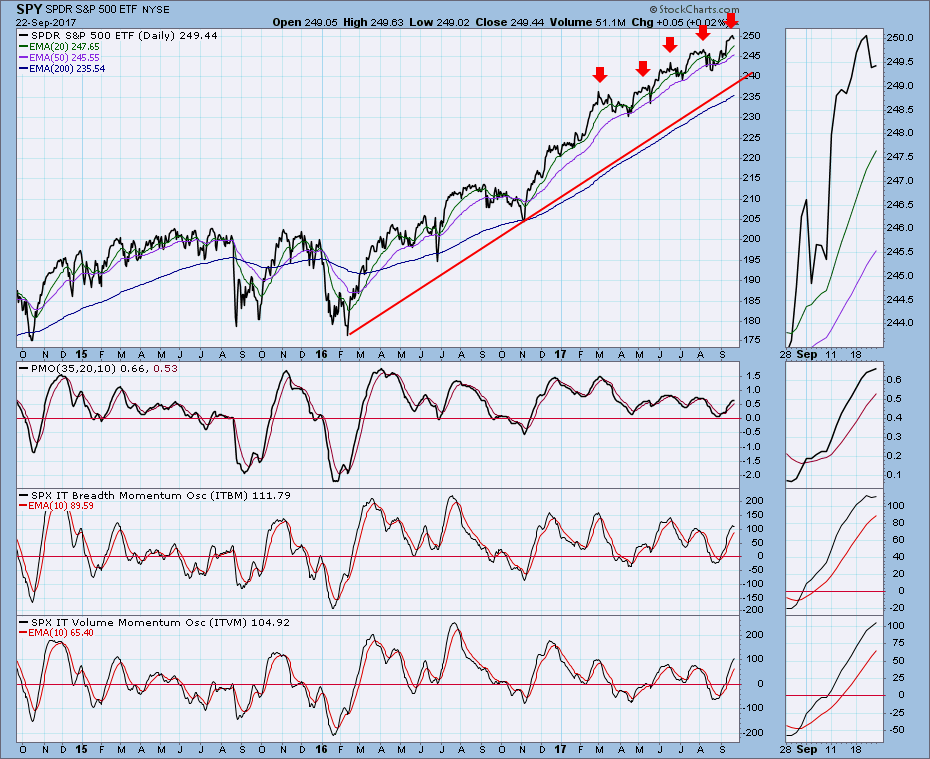
Intermediate-Term Market Indicators: These indicators are relatively overbought, and they will top if there is any price weakness next week. Note the fairly regular cyclical price tops we have seen this year, and it appears that another top has just appeared.
Conclusion: The weakness AAPL is showing is bleeding through to the rest of the market, which seems to be preparing for its own correction. If I am right about that, I have no reason to think it will be a major downturn, just move down to the 50EMA as we have seen four other times in the last seven months. . .
Click on "In reply to", for Authors past commentaries
Information posted to this board is not meant to suggest any specific action, but to point out the technical signs that can help our readers make their own specific decisions. Your Due Dilegence is a must! • DiscoverGold
Register for free to join our community of investors and share your ideas. You will also get access to streaming quotes, interactive charts, trades, portfolio, live options flow and more tools.


 News
News  Market Data
  Discover