Taking A Look At Near-Term Downside Risk For The S&P 500 By: Tom Bowley | September 22, 2017
We are in one of the most bearish historical periods of the year and I've provided a bit more information about it in the Historical Tendencies section below. I'm pointing this out because equities took a break on Thursday and futures are down slightly this morning. We could be in for more short-term weakness and I've identified key support levels to watch on the S&P 500 in the Current Outlook section below.
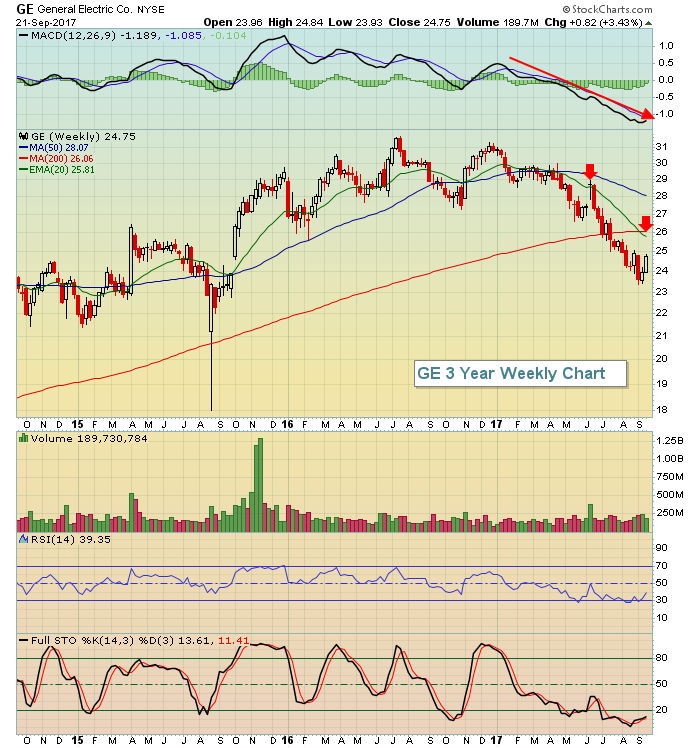
But first, let's get to Thursday's action. All of our major indices showed declines, although the selling was contained. In other words, I saw no major technical glitches with the selling, just normal profit taking after days of strength. Among sectors, industrials (XLI, +0.30%) and financials (XLF, +0.24%) were the leaders. General Electric (GE) was a nice winner as diversified industrials ($DJUSID) showed continuing September strength after breaking a recent three month downtrend. GE is now testing its 50 day SMA after printing a recent positive divergence. But as you can see on the following weekly chart, the longer-term momentum remains with the bears:
Once momentum turns south, that declining 20 week EMA becomes key overhead resistance. Therefore, I'd say GE has another 4% or so of upside potential, but from there GE has much technical work left to do.
Pre-Market Action
We're seeing a drop in the 10 year treasury yield ($TNX) and buying in gold ($GOLD) is resuming as traders turn a bit more defensive ahead of the weekend. There was weakness in Asian markets overnight and European markets this morning are mixed. Given the overbought conditions here in the U.S. and historical head winds, futures are struggling. Dow Jones futures are lower by 34 points with 30 minutes left to the opening bell.
Current Outlook
We know that history is a head wind for the U.S. equity bulls over the next few days. In fact, as the data in Historical Tendencies below shows, the September 20-26 week has seen falling S&P 500 prices in 8 of the past 10 years with losses in seven of those years in excess of 1%. Two of the years have seen weekly losses in excess of 3%. So knowing that type of selling is not only possible, but historically probable, where should we be looking for key price support in the very near-term:
Broken price resistance becomes price support. That's TA 101. The rising 20 day EMA also tends to be excellent support during uptrends. Price support and the 20 day EMA are currently at 2481 and 2483, respectively. From our recent high, this pullback would measure roughly 1% from the September 19th high.
Now let's look at the shorter-term hourly chart:
The pink arrows show that the negative divergence I wrote about a few days ago has now played out. We've seen a MACD centerline test and 50 hour SMA test. That doesn't mean we can't go down further. It simply means that the short-term momentum issues are gone. If the 2481-2483 support is lost, the next area that I see is the combination of gap and trendline support close to 2460. I suspect, worst case, the S&P 500 holds 2460 on lows this week or next. . .
Information posted to this board is not meant to suggest any specific action, but to point out the technical signs that can help our readers make their own specific decisions. Your Due Dilegence is a must! • DiscoverGold
Register for free to join our community of investors and share your ideas. You will also get access to streaming quotes, interactive charts, trades, portfolio, live options flow and more tools.


 News
News  Market Data
  Discover