DP Alert: Short-Term Overbought Conditions Suggest Upcoming Pause/Pullback By: Erin Heim | September 19, 2017
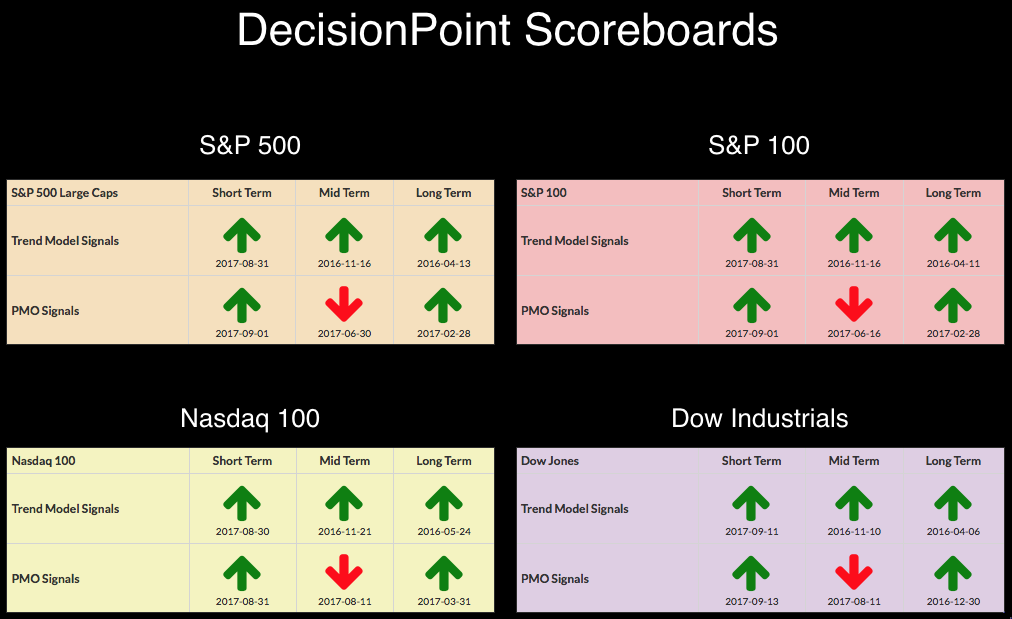
It may seem strange that all of the Scoreboards are green except in the area of intermediate-term PMO signals. A look at the weekly charts for all four indexes reveals all but the NDX weekly PMO are rising up toward IT PMO BUY signals. The margin is still rather large so I wouldn't expect to see these signals update until next Friday at the earliest. To see the weekly charts (including daily and monthly charts) of the four Scoreboard indexes, go to the DecisionPoint ChartList. The link is located at the top of the main DecisionPoint blog page.
SIGNALS: Here we include charts of any important signal changes triggered today by our Intermediate-Term Trend Model.
NO NEW SIGNALS TO REPORT.
STOCKS
IT Trend Model: BUY as of 11/15/2016
LT Trend Model: BUY as of 4/1/2016
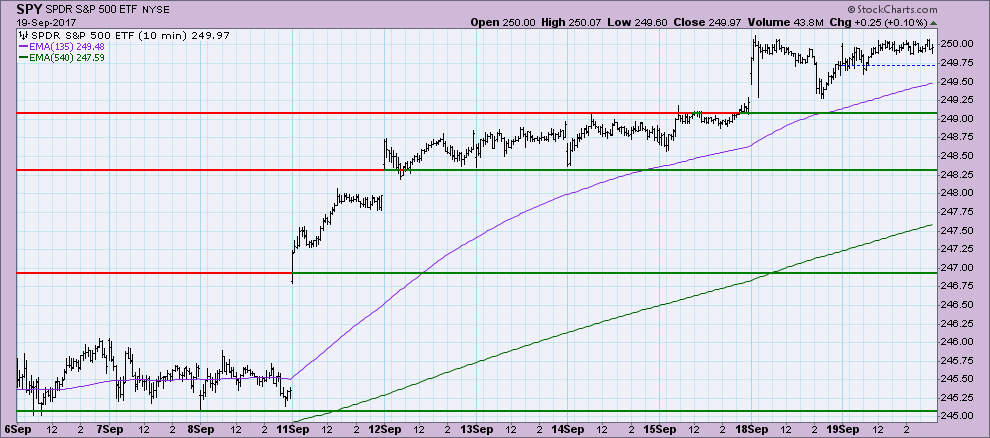
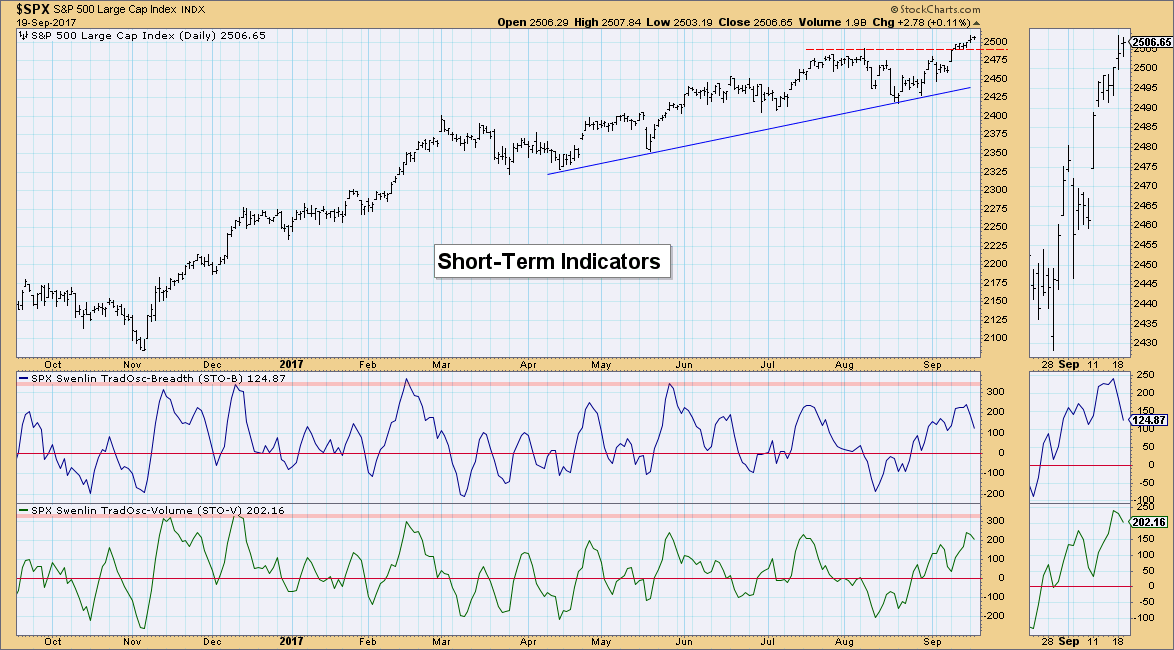
The intraday highs of yesterday were challenged, but resistance held. I've been looking for a short-term "pause" as our short-term indicators are very overbought. I suspect this area of consolidation will continue a few more days.
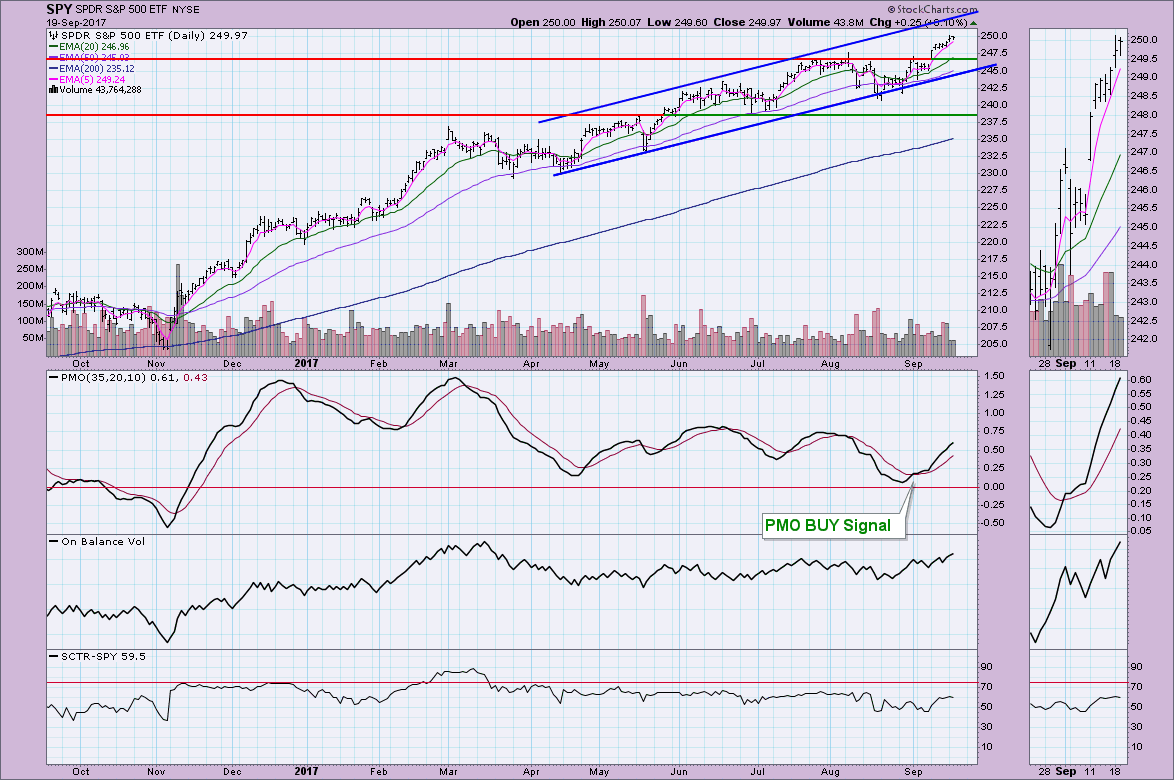
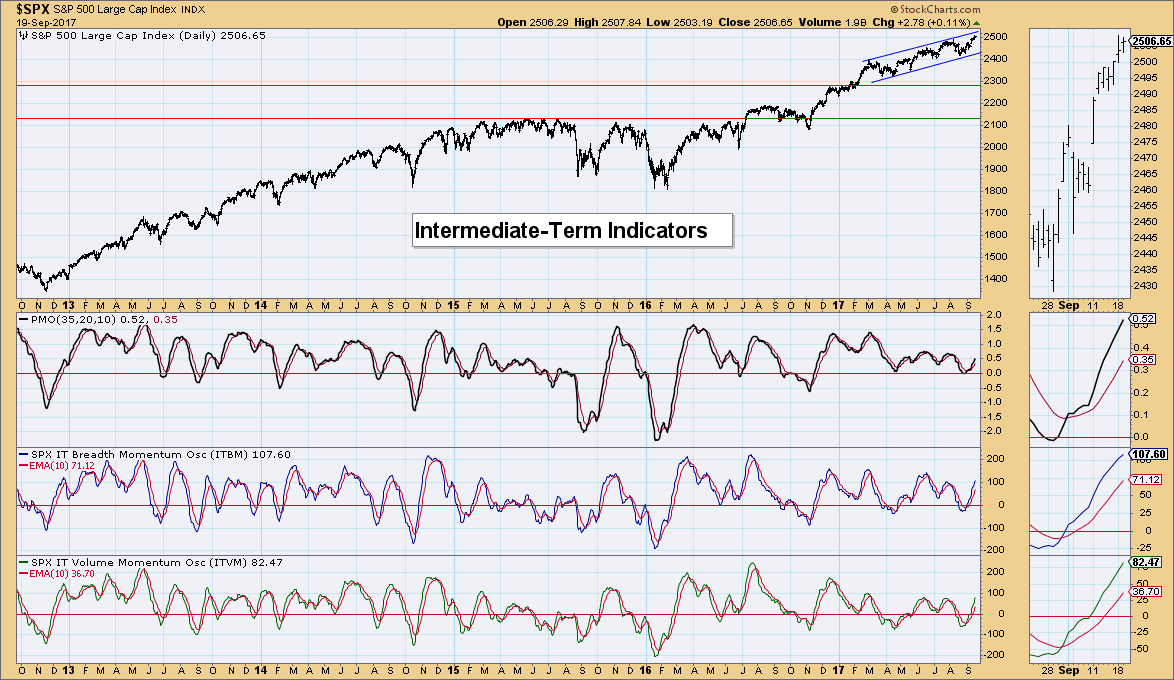
I've annotated a loose rising trend channel for the SPY. I continue to look for consolidation or a pullback, but it is hard to argue against the indicators on this chart, with the PMO being primary. It is rising strongly. However, note that the previous PMO top is still below the current reading which sets up a negative divergence (should the PMO turn down before reaching above that top). OBV looks positive and is behind the current move.
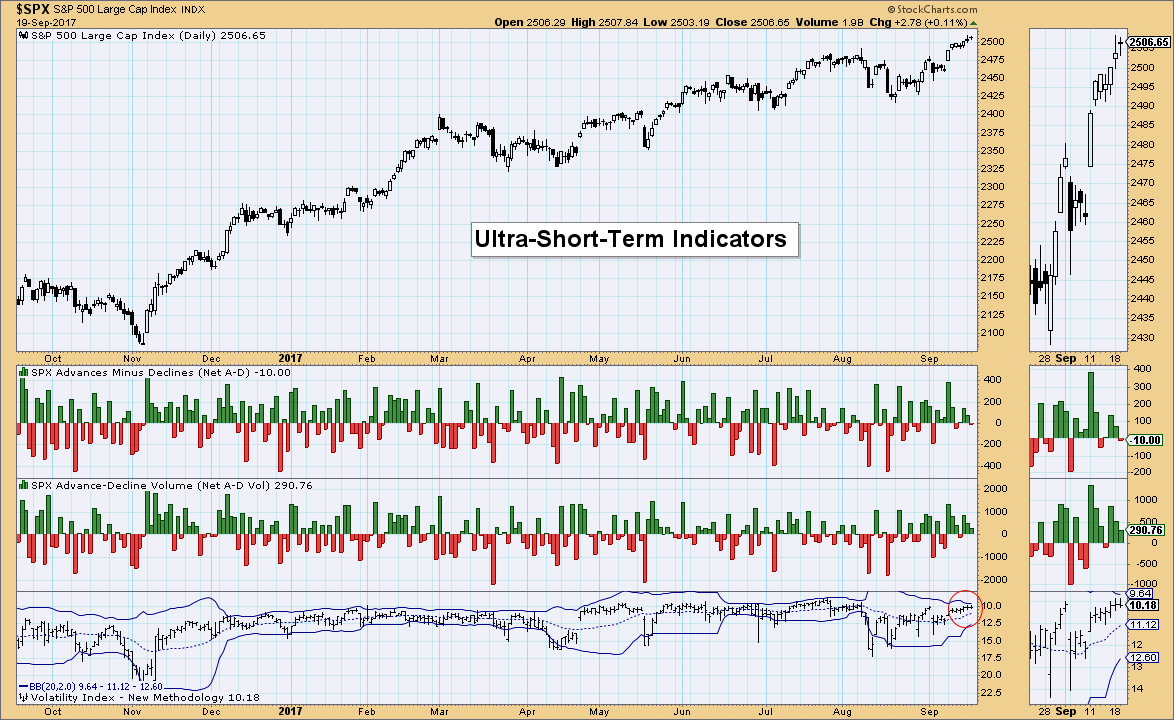
Ultra-Short-Term Indicators: I noticed that the VIX is finally starting to challenge the upper Bollinger Band. This generally sets up a one or two day decline (or consolidation). The bands on the VIX are getting very tight again and we know from earlier this summer that this indicator is less helpful. Ultimately, the market is getting a bit complacent based on the low VIX reading and that usually a time for a pullback.
Short-Term Indicators: The rising bottoms of the STO-B have now been broken as it moves lower. This is exactly what is needed right now and two days of moving mostly sideways on the 10-minute bar chart explains the decline of the STO-B and STO-V. We don't need to see these readings dip below zero. In fact, if they turn up before going negative, I find that shows internal strength. For now, more consolidation or decline is needed to finish the job.
Intermediate-Term Indicators: After short-term indicators unwind, the intermediate-term indicators tell us to expect the rising trend channel to be maintained. While they are getting near-term overbought, there is still plenty of room for them to meander higher.
Conclusion: The intermediate-term picture remains rosy, but the short-term picture is a bit more murky. Based on the VIX and declining overbought short-term indicators, I still expect to see a pullback or at least some consolidation. The PMO on the SPY suggests a decline isn't necessarily ahead, but the PMO can be viewed as an intermediate-term indicator and it is in concert with the ITBM and ITVM. I'm looking for a boring week and some excitement in the next two. . .
Information posted to this board is not meant to suggest any specific action, but to point out the technical signs that can help our readers make their own specific decisions. Your Due Dilegence is a must! • DiscoverGold
Register for free to join our community of investors and share your ideas. You will also get access to streaming quotes, interactive charts, trades, portfolio, live options flow and more tools.


 News
News  Market Data
  Discover