


| Followers | 679 |
| Posts | 140863 |
| Boards Moderated | 36 |
| Alias Born | 03/10/2004 |
Tuesday, August 29, 2017 4:41:41 PM
By Bespoke | August 29, 2017
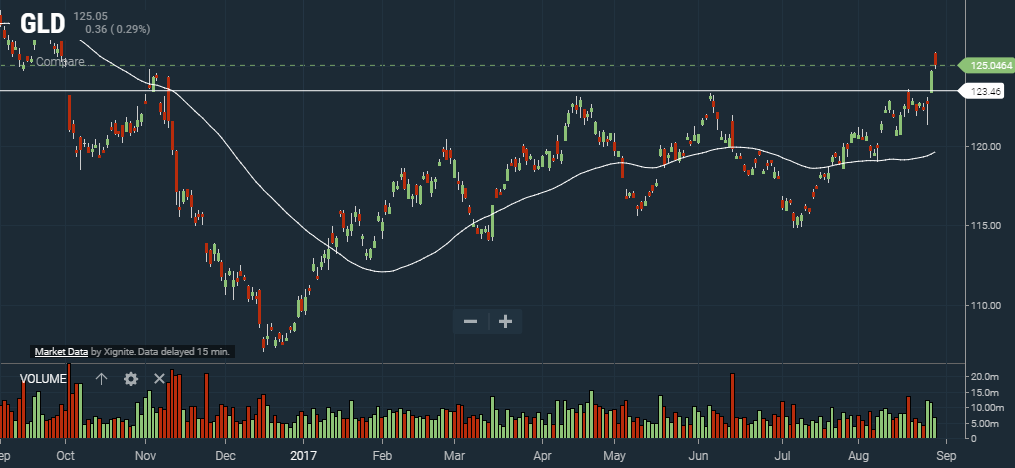
The GLD ETF that tracks the yellow metal is now up 13% year-to-date after breaking out of a sideways range yesterday. Check out the chart for GLD below. (Remember, you can use Bespoke’s new Interactive Chart Tool for free at any time.)
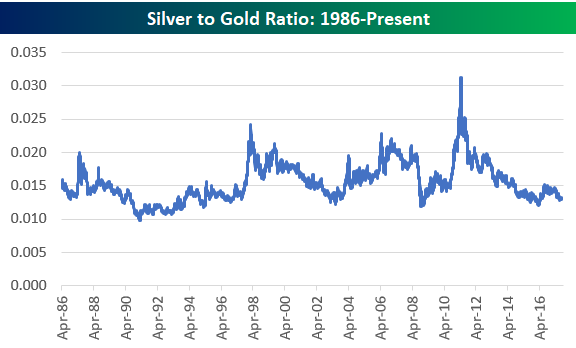
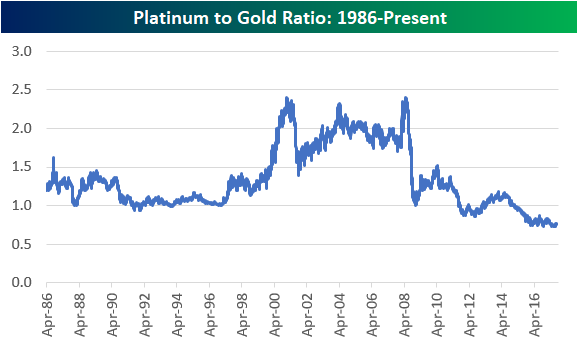
We like to look at gold price ratios compared to other metals, and below we’ve charted the historical silver-to-gold ratio and platinum-to-gold ratio. When the line is rising in the charts below, it means gold is underperforming the other metal. When the line is falling, it means gold is outperforming.
As you can see, both silver and platinum have been underperforming gold for years now. The silver-to-gold ratio is right at the bottom of its 30-year range, while the platinum-to-gold ratio has been making new multi-decade lows for the last two years. Remember when platinum was considered more precious than gold? Even though platinum is 30x as rare as gold, it currently trades at just 75% of the price of gold. At multiple points in the mid-2000s, platinum traded close to 2.5x the price of gold. Given that platinum has more uses than gold in the industrial economy, you definitely wouldn’t expect the ratio to be at record lows multiple years into the current economic expansion. At least based on its historical average ratio of 1.34x the price of gold, platinum looks cheap to us on a relative basis. Unfortunately, it has looked cheap for quite some time now!
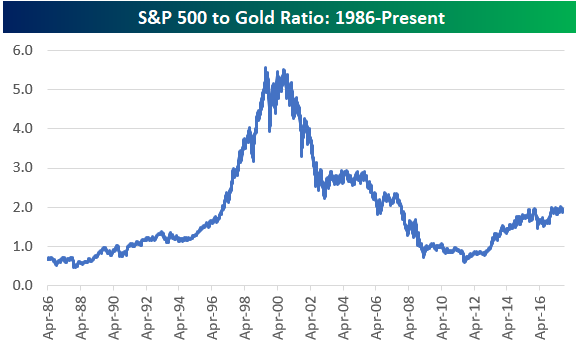
For those interested, below is a chart of the S&P 500 to gold ratio. Throughout the entire equity bull market that we’ve been in since 2009, this ratio hasn’t been able to break solidly above 2x. At the end of the Dot Com bubble back in early 2000, this ratio was over 5.5x!
https://www.bespokepremium.com/think-big-blog/gold-ratios/
• DiscoverGold
*** For Market Direction and Trends visit our board:
https://investorshub.advfn.com/Market-Direction-and-Trends-26249/
Information posted to this board is not meant to suggest any specific action, but to point out the technical signs that can help our readers make their own specific decisions. Your Due Dilegence is a must!
• DiscoverGold
Recent GOLD News
- Barrick On Track to Achieve 2024 Targets • GlobeNewswire Inc. • 04/16/2024 11:00:00 AM
- Notice of Release of Barrick’s First Quarter 2024 Results • GlobeNewswire Inc. • 04/09/2024 11:00:00 AM
- Strategy-Driven Barrick Builds on Value Foundation • GlobeNewswire Inc. • 03/28/2024 09:20:38 PM
- Barrick Hunts New Gold and Copper Prospects in DRC From Kibali Base • GlobeNewswire Inc. • 03/20/2024 02:00:00 PM
- Barrick Opens Academy at Closed Buzwagi Mine • GlobeNewswire Inc. • 03/18/2024 08:00:00 AM
- Barrick to Grow Production and Value on Global Asset Foundation • GlobeNewswire Inc. • 03/15/2024 11:53:01 AM
- Loulo-Gounkoto Delivers Another Value-Creating Performance • GlobeNewswire Inc. • 03/10/2024 10:00:00 AM
- Passing of the Right Honorable Brian Mulroney • GlobeNewswire Inc. • 03/02/2024 01:17:35 AM
- Kibali and DRC Partner to Promote Local Content • GlobeNewswire Inc. • 03/01/2024 02:22:43 PM
- Tanzanian Parliamentary Committee Lauds Barrick’s Work at North Mara • GlobeNewswire Inc. • 02/23/2024 12:00:00 PM
- Form 6-K - Report of foreign issuer [Rules 13a-16 and 15d-16] • Edgar (US Regulatory) • 02/14/2024 10:28:08 PM
- Form 6-K - Report of foreign issuer [Rules 13a-16 and 15d-16] • Edgar (US Regulatory) • 02/14/2024 08:05:25 PM
- Clear Strategies and Strong Partnerships Set Barrick Up to Outperform, Says Bristow • GlobeNewswire Inc. • 02/14/2024 11:00:00 AM
- Barrick Announces New Share Buyback Program • GlobeNewswire Inc. • 02/14/2024 10:59:00 AM
- Barrick Declares Q4 Dividend • GlobeNewswire Inc. • 02/14/2024 10:58:00 AM
- NGM Strongly Positioned for Growth • GlobeNewswire Inc. • 02/10/2024 01:00:16 AM
- Form SC 13G - Statement of acquisition of beneficial ownership by individuals • Edgar (US Regulatory) • 02/08/2024 03:03:08 PM
- Form 6-K - Report of foreign issuer [Rules 13a-16 and 15d-16] • Edgar (US Regulatory) • 02/08/2024 12:46:55 PM
- Geologically Driven Asset Management Delivers Barrick’s Third Successive Year of Reserve Growth at Sustained Quality, While Unlocking Embedded Growth Portfolio • GlobeNewswire Inc. • 02/08/2024 12:00:00 PM
- Form SC 13G/A - Statement of acquisition of beneficial ownership by individuals: [Amend] • Edgar (US Regulatory) • 02/01/2024 06:04:56 PM
- Africa’s Largest Gold Mine Now Also One of Its Greenest • GlobeNewswire Inc. • 01/29/2024 04:00:00 PM
- Barrick Continues to be a Major Value Creator for Mali • GlobeNewswire Inc. • 01/27/2024 09:00:00 AM
- Barrick’s Lumwana Super Pit Project On Track for First Production in 2028 • GlobeNewswire Inc. • 01/23/2024 03:35:00 PM
- Barrick’s Tanzanian Mines on Tier One Track With Potential for Extending Lives, Growing Production • GlobeNewswire Inc. • 01/21/2024 12:00:00 PM
- New Airport Terminal at Kahama Airstrip to Leave Lasting Legacy at Barrick’s Buzwagi Gold Mine • GlobeNewswire Inc. • 01/21/2024 08:00:00 AM
Bantec Reports an Over 50 Percent Increase in Sales and Profits in Q1 2024 from Q1 2023 • BANT • Apr 25, 2024 10:00 AM
Cannabix's Breath Logix Alcohol Device Delivers Positive Impact to Private Monitoring Agency in Montana, USA • BLO • Apr 25, 2024 8:52 AM
Kona Gold Beverages, Inc. Announces Name Change to NuVibe, Inc. and Initiation of Ticker Symbol Application Process • KGKG • Apr 25, 2024 8:30 AM
Axis Technologies Group and Carbonis Forge Ahead with New Digital Carbon Credit Technology • AXTG • Apr 24, 2024 3:00 AM
North Bay Resources Announces Successful Equipment Test at Bishop Gold Mill, Inyo County, California • NBRI • Apr 23, 2024 9:41 AM
Epazz, Inc.: CryObo, Inc. solar Bitcoin operations will issue tokens • EPAZ • Apr 23, 2024 9:20 AM

