SPY Weekly Wrap: Failed Retest By Carl Swenlin | August 18, 2017
Last week I wrote: "I would like for the correction to continue for a while, but honestly, we may have just hit bottom." Well, the market did make a bottom, but it was just for a short bounce prior to this week's failed retest of last week's low. It was not the enduring intermediate-term bottom I had imagined, and it may be a while before we see that. As I watched decelerating price movement on Tuesday and Wednesday, it became apparent that a retest was more likely than an upside breakout. Similar to last week, this Friday was a day of rest to digest Thursday's collapse and to process options expiration.
STOCKS
IT Trend Model: BUY as of 11/15/2016
LT Trend Model: BUY as of 4/1/2016
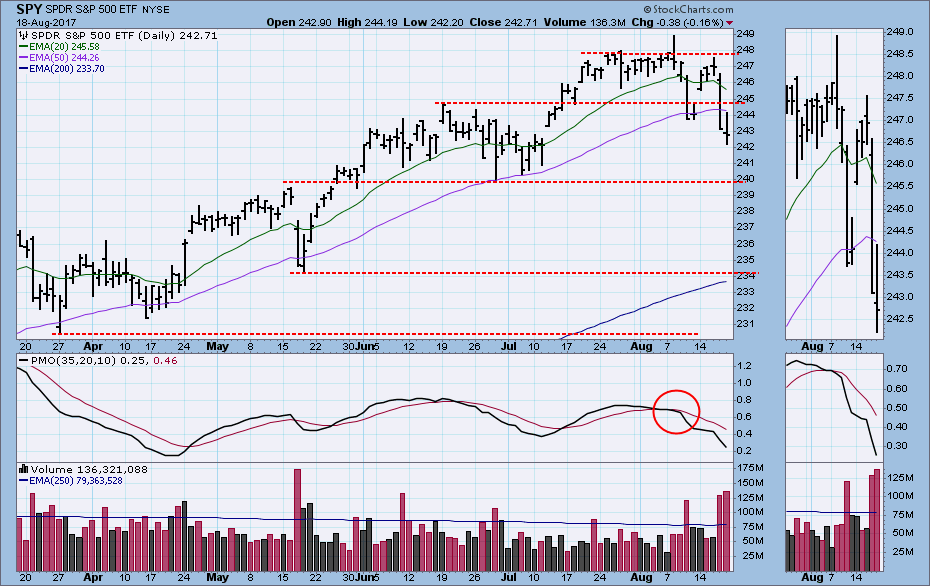
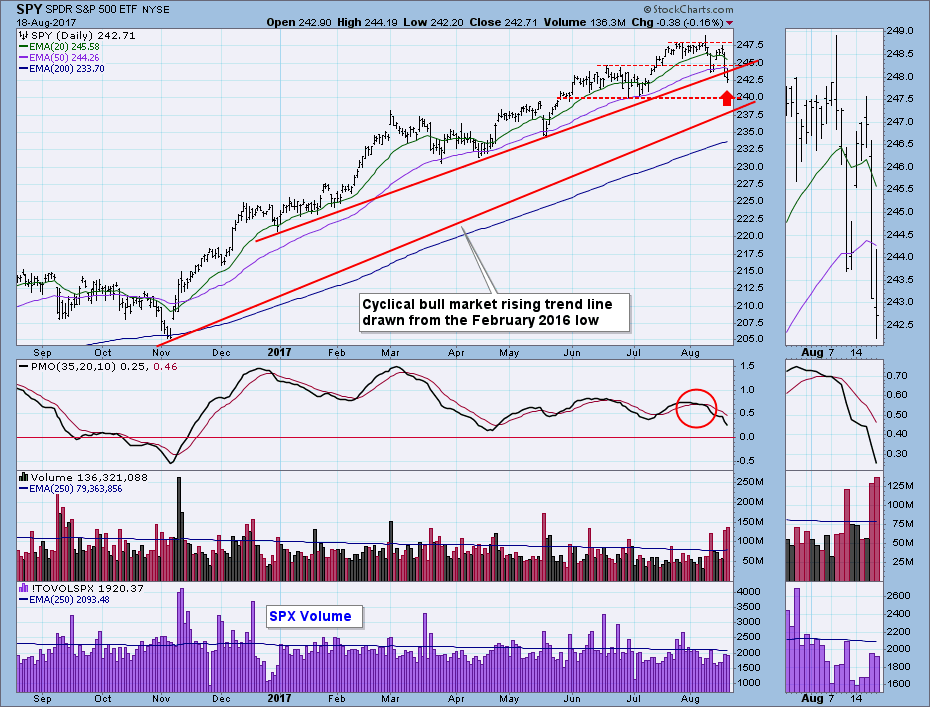
The most compelling change to this daily chart since last week is the break below the rising bottoms line going back to December. This is far from being a decisive break, but it is significant in its singularity. The next horizontal support is SPY 240 (SPX 2405). Just below that is the cyclical bull market rising trend line. As long as that line holds, my opinion would be that no serious technical damage had been done.
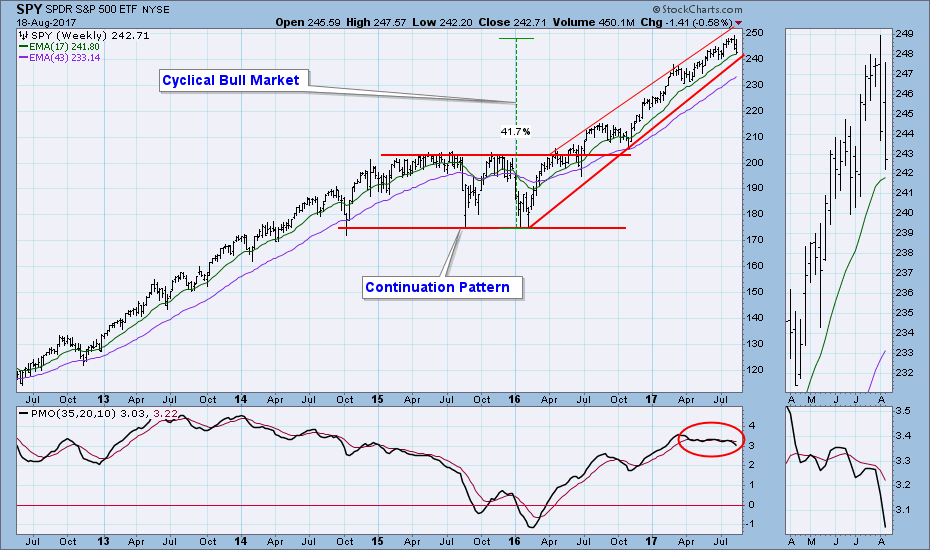
On the weekly chart price remains within the rising trend channel, but the stress of the correction has caused the weekly PMO to drop below the tight horizontal pattern it has held for at least four months.
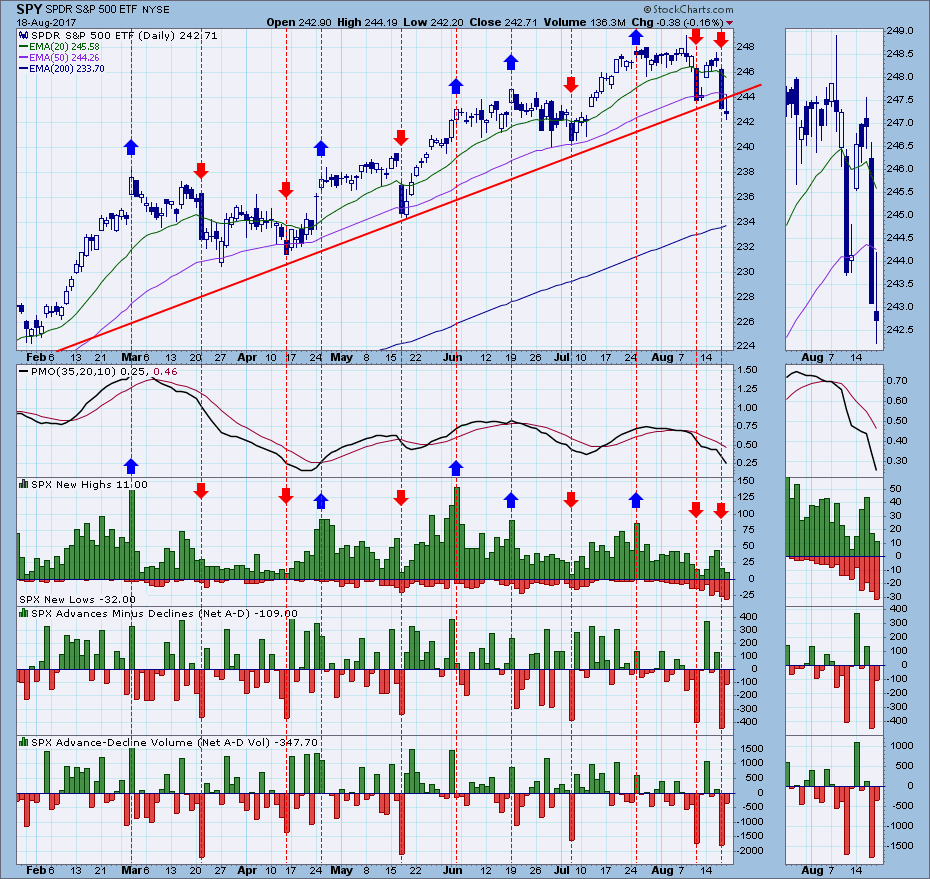
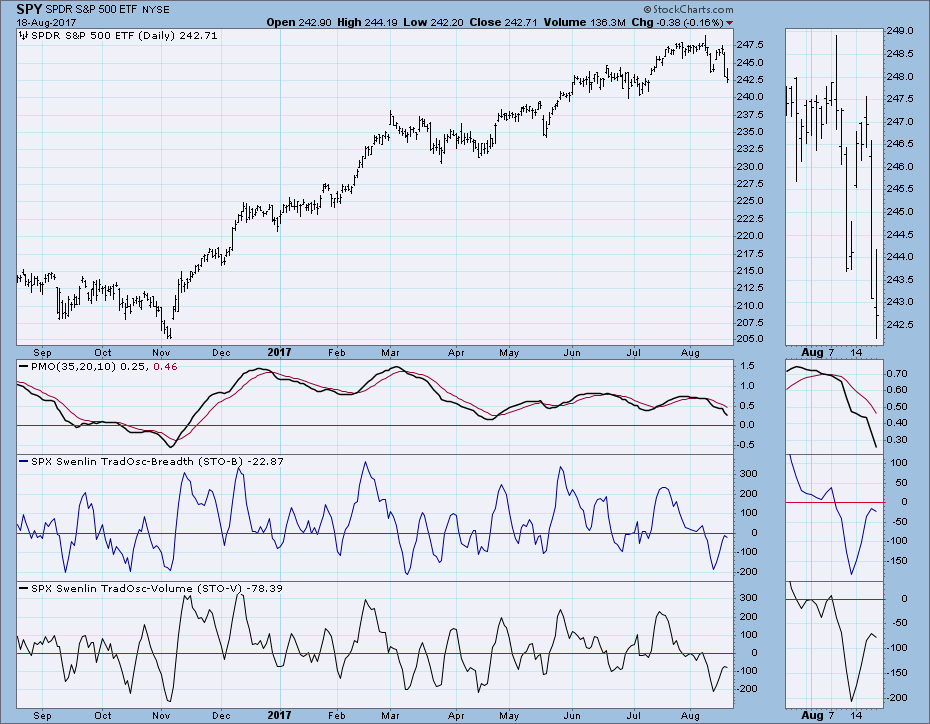
Climactic Market Indicators: There was a downside climax last Thursday that resulted in the short price bounce this week. This week there was a more severe downside climax on Thursday, and Friday's price action was similar to the prior Friday's. Maybe we'll get another bounce next week, or maybe the decline will continue, but expanding New Lows make me think that a rally to new, all-time highs is not in the cards.
Short-Term Market Indicators: These indicators have topped below the zero line. Very negative.
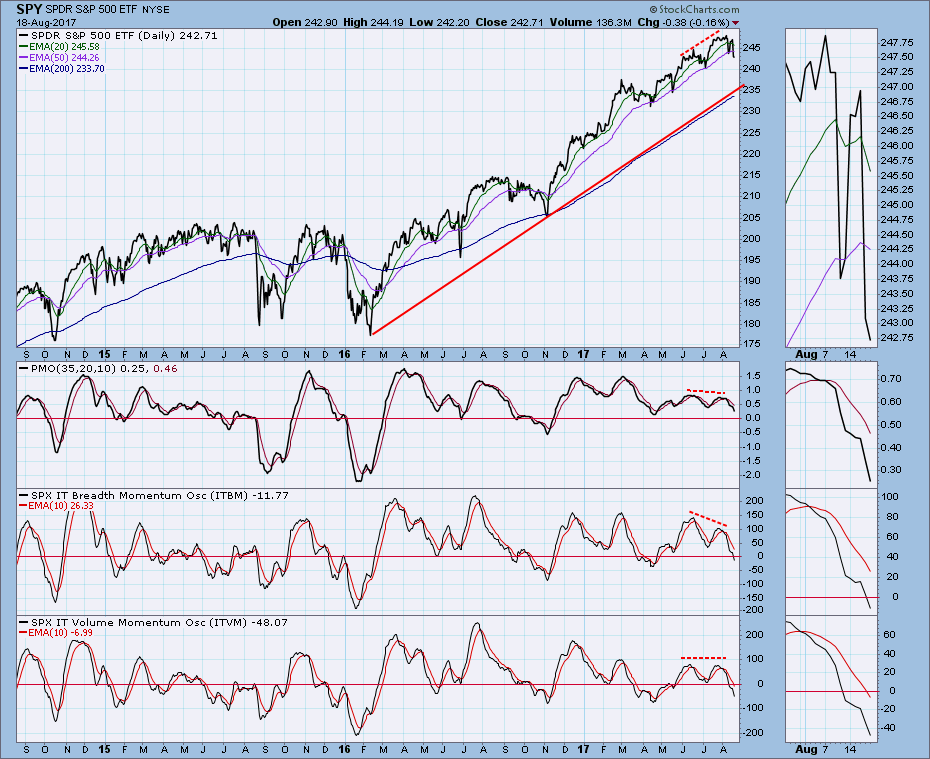
Intermediate-Term Market Indicators: At this point I am less confident that these indicators will find support at the same level as they have for the last 18 months. I am now more interested in potential downside -- about -250 on the ITBM and ITVM scales. That is not necessarily a target, rather it allows for a healthy decline.
Conclusion: We have had only two days in the last two weeks where there was some enthusiastic selling. It was a nice change, but losses were small. The loss was only -2.7% from the August intraday high to Friday's intraday low, and only about -2.0% from the all-time high close earlier this month to Friday's close. The most encouraging thing for bears would be the fact that price finally broke below the 'Trump Rally' rising bottoms line that goes back to January. This was not a decisive breakdown, but I will be looking for follow through next week. There is still plenty of room for downside correction before the cyclical bull market rising trend line is challenged. If that line is violated, I would be concerned that the bull market was over; however, let's first wait to see if we get there.
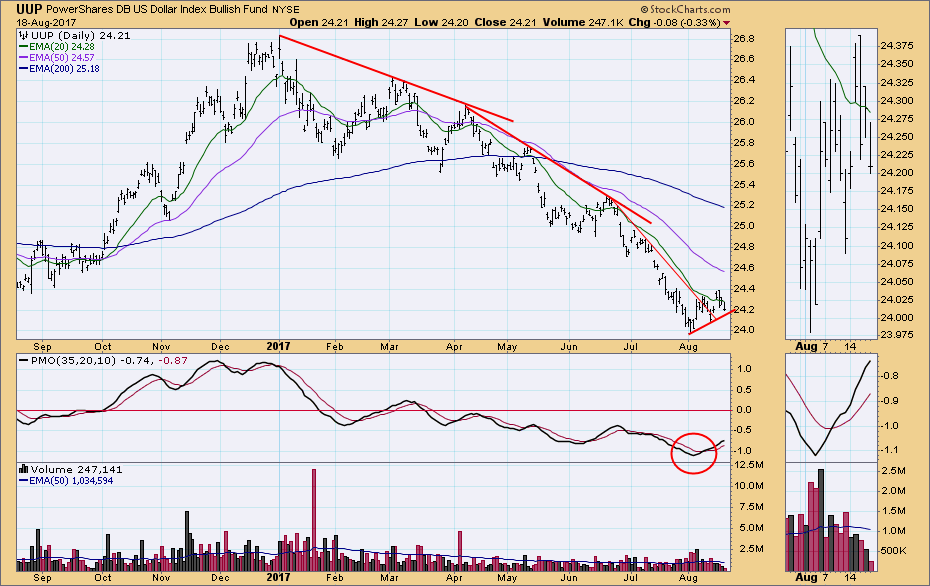
DOLLAR (UUP)
IT Trend Model: NEUTRAL as of 3/21/2017
LT Trend Model: SELL as of 5/24/2017
UUP has broken above the steepest declining tops line, and a short-term rally has begun.
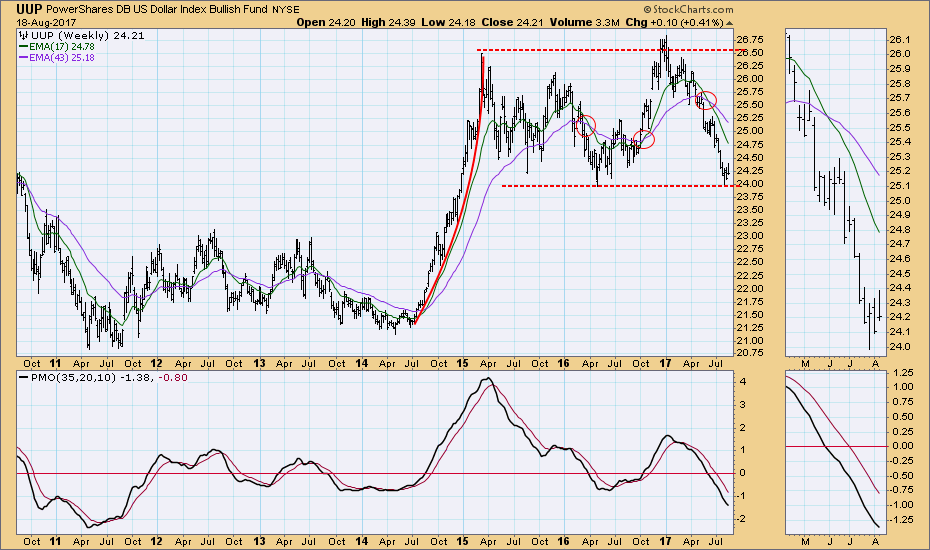
On the weekly chart UUP is currently holding above long-term support drawn across the 2016 low, but the weekly PMO is still falling. . .
Click on "In reply to", for Authors past commentaries
Information posted to this board is not meant to suggest any specific action, but to point out the technical signs that can help our readers make their own specific decisions. Your Due Dilegence is a must! • DiscoverGold
Register for free to join our community of investors and share your ideas. You will also get access to streaming quotes, interactive charts, trades, portfolio, live options flow and more tools.


 News
News  Market Data
  Discover