


| Followers | 689 |
| Posts | 143817 |
| Boards Moderated | 35 |
| Alias Born | 03/10/2004 |
Wednesday, August 16, 2017 9:59:40 AM
5-Must See Charts For Retirement Distributions
By Richard Rosso | August 16, 2017
I possess an extensive library that covers financial topics with an emphasis on market history.
My first guess is I own close to 150 hard copies – somewhere in that range. I page through at least 30 of them a few times a year. Some require handling with care as they’re first editions from the late 1800s like “Ten Years in Wall Street,” by William Chauncey Fowler (1870).
I consider it peculiar how when markets trend positively or become extended by the way of fundamental metrics, I pick up the pace on my study of the past. Molded pages are parched gold of worthy reminders of how stock prices can represent on occasion, more fiction than fact.
From approximately 5 years before retirement, through the initial phase (5-7 years) of a retirement income distribution cycle, the priority must be risk management when valuations are reaching extreme levels, like today.
Unfortunately, where you retire in a market cycle is primarily a spin of the roulette wheel. Basically, luck.
However, one truth remains – when attempting to produce a steady stream of retirement income from variable assets like stocks and to some extent bonds, then distributions must be consistently monitored and possibly adjusted depending on market head or tailwinds.
If I had to go out on a limb using current valuations as a guide, I am confident that those close to retirement or just beginning the journey are going to face greater obstacles to future returns.
The following must-see charts were created especially for you.
Heed Market Valuations With Respect To Future Returns:
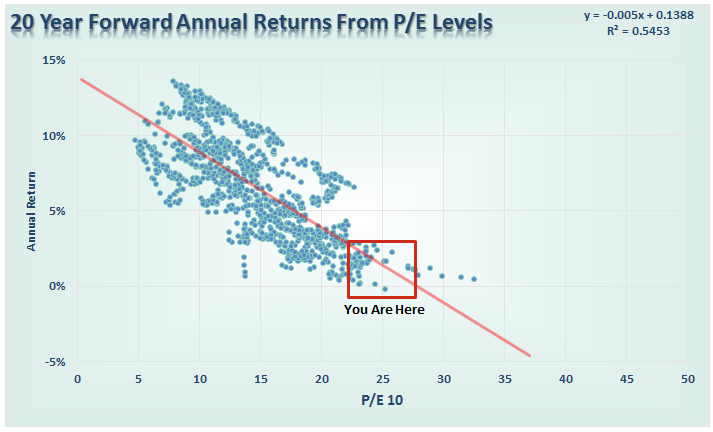
A strong probability exists that a prolonged period of unfavorable or below-average returns will be a formidable obstacle for new retirees. One year of poor returns along with withdrawals is not worth the stress. A series of poor return years strung together may require modification to withdrawal rates. I utilize rolling three-year portfolio gains and losses and compare to actual withdrawals to help retirees determine whether cash flow adjustments are required.
This chart should encourage a reduction in portfolio stock exposure early in or before retirement and less concern over missed opportunities.
Cash Deserves Respect, Especially Now
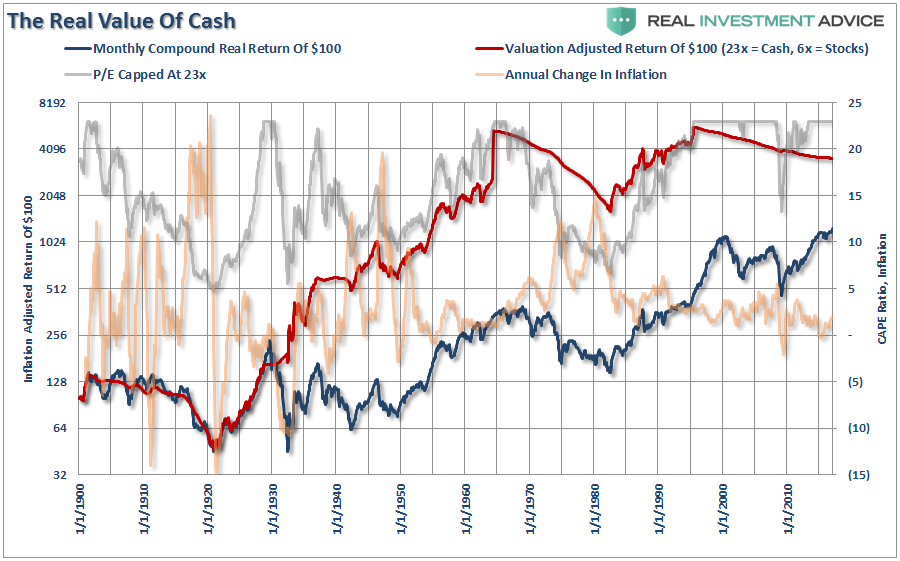
Cash isn’t about interest earned, it’s about the liquidity required to generate a retirement paycheck in addition to Social Security, possible pensions and for some, continued part-time or self-employment income.
It’s important to maintain cash or at the least, quality bonds of short duration to cushion a pre-retirement portfolio from exogenous events that may ultimately extend a planned retirement date.
As part of retirement preparation, partner with a fiduciary who can assist with a holistic rebalancing strategy to assess stock exposure and reduce it accordingly.
Where You Retire In A Long-Term Trend Is Luck
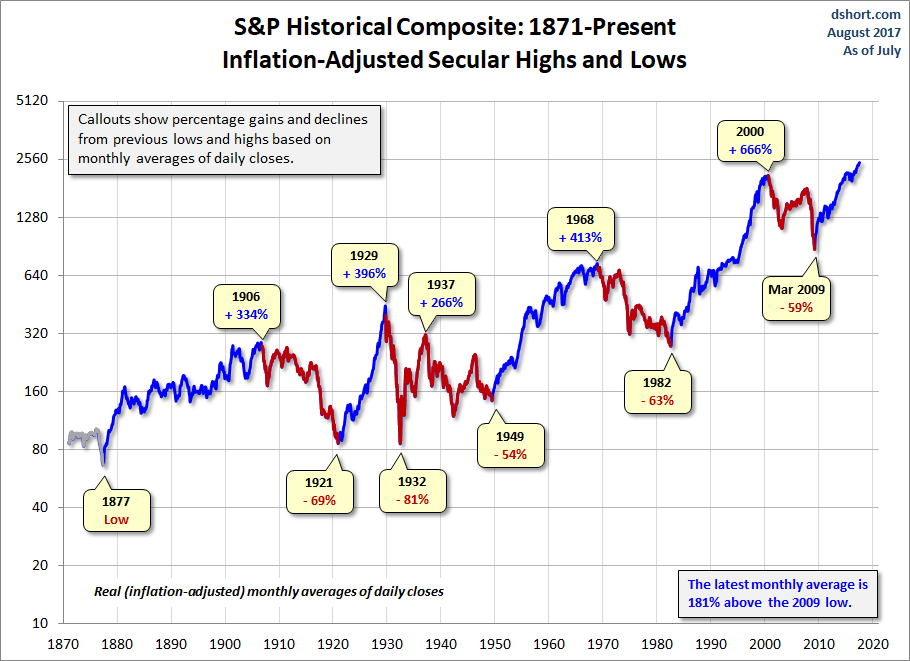
The chart above courtesy of www.dshort.com, outlines secular (blue) or long-term market trends which lead to market highs. The red lines represent secular bears. The red uptrends are cyclical, or shorter-term positive moves imbedded within long-term negative periods.
Although Doug Short has implied the current cycle from the March 2009 bottom is the beginning of a new secular bull (since December 2011 marked a new market high on an inflation-adjust basis), it would be difficult based on current valuations, to validate the deduction.
Since 1877, secular bull years have totaled 80 vs. 52 for bears, which is a 60/40 ratio. Surprised? Bear markets happen more often than investors are led to believe. They usually occur at times of overvaluation which makes recent retirees or those close to retirement at greater risk of experiencing negative or poor future returns. Bad luck or rotten timing. Either way, it’s going to be important to remain cognizant of portfolio distribution rates, place renewed priority on risk management, and adjust spending accordingly perhaps over the next ten years.
Those who were proactive to minimize stock and high-yield bond portfolio risk (like several of the writers for Real Investment Advice), and redeployed capital into stocks at 13x earnings in the summer of 2009, helped new retirees at that time meet their retirement objectives. In addition, they have experienced a cyclical tailwind in stocks that has allowed greater distribution rates. Great luck!
Never Doubt Regression To The Mean

Stock market cycles are vast and span decades. Don’t stumble into a Recency Bias trap where you believe current complacent market conditions lay the path to a smooth, high-return future. Markets are mean reverting mechanisms. Cycles indeed change.
Usually, markets are more volatile with periods of 5 percent pullbacks occurring every 3-4 months. As investors, this year we’ve witnessed shallow retracements followed up by buys on the dips. An environment like this fosters overconfidence.
Volatility may excite traders and be helpful to those who are seeking lower prices to purchase risk assets. For those in retirement distribution mode, volatility and corrections have potential to place portfolio longevity in jeopardy.
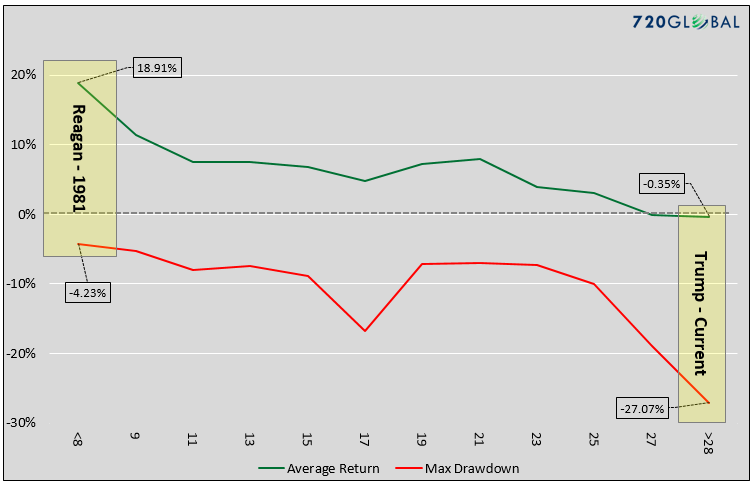
“It’s A Reagan-Type Market,” More Fiction Than Fact
Sure, I miss the 80s. I had a chance to converse with President Reagan in 1985 as he gave the commencement speech at one of my alma maters. Being a reporter for the university newspaper, I wrote of how the campus was magical that day. I had a rare opportunity to be more close-up than most. Clear weather characterized by deep blue skies, youthful spirits high and a perspective of hope direct from the President, provided a cherished memory.
This isn’t the 80s, although I believe ‘skinny’ ties have made a comeback.
As Michael Lebowitz wrote for Real Investment Advice:
“Equity investors betting on Reagan in 1981 were investing in an environment where the probabilities of success were asymmetrically high. With Cyclically Adjusted Price-to-Earnings (CAPE) ratios below 10, investors could buy in to a stock market whose valuation on this basis had only been cheaper 8% of the time going back to 1885. Current equity market valuations require investors to believe beyond all doubt that Trump’s policies can produce strong economic growth and overcome hefty economic and demographic headwinds. More bluntly, the risk-return profile of 1981 is the polar opposite to that of today.”
In his chart above, Michael outlines five-year forward returns and the maximum drawdowns that have occurred over the last 60 years at similar cyclically-adjusted price-to-earnings ratios.
If Michael is correct, investors should expect returns over the next five years, including dividends, to be near zero with a greater probability of double-digit loss. This conclusion can be devastating for those entering a retirement distribution period and no longer adding to investments through periodic savings programs.
Preparing for a smooth retirement transition requires caution, occasionally followed by a seismic dilution in portfolio risks. The perspective should be one of capital loss minimization, not a stretch for greater returns.
When valuations normalize, increased stock exposure should be considered. There’s absolutely nothing wrong with adding to riskier assets when prices and valuations warrant, regardless of age.
Don’t allow the story of “this time it’s different,” to derail your plans.
“While enthusiasm may be necessary for great accomplishments elsewhere, on Wall Street it almost invariably leads to disaster.” – Benjamin Graham.
Richard Rosso, MS, CFP, CIMA
https://realinvestmentadvice.com/5-must-see-charts-for-retirement-distributions/
• DiscoverGold
*** For Market Direction and Trends visit our board:
https://investorshub.advfn.com/Market-Direction-and-Trends-26249/
By Richard Rosso | August 16, 2017
I possess an extensive library that covers financial topics with an emphasis on market history.
My first guess is I own close to 150 hard copies – somewhere in that range. I page through at least 30 of them a few times a year. Some require handling with care as they’re first editions from the late 1800s like “Ten Years in Wall Street,” by William Chauncey Fowler (1870).
I consider it peculiar how when markets trend positively or become extended by the way of fundamental metrics, I pick up the pace on my study of the past. Molded pages are parched gold of worthy reminders of how stock prices can represent on occasion, more fiction than fact.
From approximately 5 years before retirement, through the initial phase (5-7 years) of a retirement income distribution cycle, the priority must be risk management when valuations are reaching extreme levels, like today.
Unfortunately, where you retire in a market cycle is primarily a spin of the roulette wheel. Basically, luck.
However, one truth remains – when attempting to produce a steady stream of retirement income from variable assets like stocks and to some extent bonds, then distributions must be consistently monitored and possibly adjusted depending on market head or tailwinds.
If I had to go out on a limb using current valuations as a guide, I am confident that those close to retirement or just beginning the journey are going to face greater obstacles to future returns.
The following must-see charts were created especially for you.
Heed Market Valuations With Respect To Future Returns:

A strong probability exists that a prolonged period of unfavorable or below-average returns will be a formidable obstacle for new retirees. One year of poor returns along with withdrawals is not worth the stress. A series of poor return years strung together may require modification to withdrawal rates. I utilize rolling three-year portfolio gains and losses and compare to actual withdrawals to help retirees determine whether cash flow adjustments are required.
This chart should encourage a reduction in portfolio stock exposure early in or before retirement and less concern over missed opportunities.
Cash Deserves Respect, Especially Now

Cash isn’t about interest earned, it’s about the liquidity required to generate a retirement paycheck in addition to Social Security, possible pensions and for some, continued part-time or self-employment income.
It’s important to maintain cash or at the least, quality bonds of short duration to cushion a pre-retirement portfolio from exogenous events that may ultimately extend a planned retirement date.
As part of retirement preparation, partner with a fiduciary who can assist with a holistic rebalancing strategy to assess stock exposure and reduce it accordingly.
Where You Retire In A Long-Term Trend Is Luck

The chart above courtesy of www.dshort.com, outlines secular (blue) or long-term market trends which lead to market highs. The red lines represent secular bears. The red uptrends are cyclical, or shorter-term positive moves imbedded within long-term negative periods.
Although Doug Short has implied the current cycle from the March 2009 bottom is the beginning of a new secular bull (since December 2011 marked a new market high on an inflation-adjust basis), it would be difficult based on current valuations, to validate the deduction.
Since 1877, secular bull years have totaled 80 vs. 52 for bears, which is a 60/40 ratio. Surprised? Bear markets happen more often than investors are led to believe. They usually occur at times of overvaluation which makes recent retirees or those close to retirement at greater risk of experiencing negative or poor future returns. Bad luck or rotten timing. Either way, it’s going to be important to remain cognizant of portfolio distribution rates, place renewed priority on risk management, and adjust spending accordingly perhaps over the next ten years.
Those who were proactive to minimize stock and high-yield bond portfolio risk (like several of the writers for Real Investment Advice), and redeployed capital into stocks at 13x earnings in the summer of 2009, helped new retirees at that time meet their retirement objectives. In addition, they have experienced a cyclical tailwind in stocks that has allowed greater distribution rates. Great luck!
Never Doubt Regression To The Mean

Stock market cycles are vast and span decades. Don’t stumble into a Recency Bias trap where you believe current complacent market conditions lay the path to a smooth, high-return future. Markets are mean reverting mechanisms. Cycles indeed change.
Usually, markets are more volatile with periods of 5 percent pullbacks occurring every 3-4 months. As investors, this year we’ve witnessed shallow retracements followed up by buys on the dips. An environment like this fosters overconfidence.
Volatility may excite traders and be helpful to those who are seeking lower prices to purchase risk assets. For those in retirement distribution mode, volatility and corrections have potential to place portfolio longevity in jeopardy.
“It’s A Reagan-Type Market,” More Fiction Than Fact

Sure, I miss the 80s. I had a chance to converse with President Reagan in 1985 as he gave the commencement speech at one of my alma maters. Being a reporter for the university newspaper, I wrote of how the campus was magical that day. I had a rare opportunity to be more close-up than most. Clear weather characterized by deep blue skies, youthful spirits high and a perspective of hope direct from the President, provided a cherished memory.
This isn’t the 80s, although I believe ‘skinny’ ties have made a comeback.
As Michael Lebowitz wrote for Real Investment Advice:
“Equity investors betting on Reagan in 1981 were investing in an environment where the probabilities of success were asymmetrically high. With Cyclically Adjusted Price-to-Earnings (CAPE) ratios below 10, investors could buy in to a stock market whose valuation on this basis had only been cheaper 8% of the time going back to 1885. Current equity market valuations require investors to believe beyond all doubt that Trump’s policies can produce strong economic growth and overcome hefty economic and demographic headwinds. More bluntly, the risk-return profile of 1981 is the polar opposite to that of today.”
In his chart above, Michael outlines five-year forward returns and the maximum drawdowns that have occurred over the last 60 years at similar cyclically-adjusted price-to-earnings ratios.
If Michael is correct, investors should expect returns over the next five years, including dividends, to be near zero with a greater probability of double-digit loss. This conclusion can be devastating for those entering a retirement distribution period and no longer adding to investments through periodic savings programs.
Preparing for a smooth retirement transition requires caution, occasionally followed by a seismic dilution in portfolio risks. The perspective should be one of capital loss minimization, not a stretch for greater returns.
When valuations normalize, increased stock exposure should be considered. There’s absolutely nothing wrong with adding to riskier assets when prices and valuations warrant, regardless of age.
Don’t allow the story of “this time it’s different,” to derail your plans.
“While enthusiasm may be necessary for great accomplishments elsewhere, on Wall Street it almost invariably leads to disaster.” – Benjamin Graham.
Richard Rosso, MS, CFP, CIMA
https://realinvestmentadvice.com/5-must-see-charts-for-retirement-distributions/
• DiscoverGold
*** For Market Direction and Trends visit our board:
https://investorshub.advfn.com/Market-Direction-and-Trends-26249/
Information posted to this board is not meant to suggest any specific action, but to point out the technical signs that can help our readers make their own specific decisions. Your Due Dilegence is a must!
• DiscoverGold
Join the InvestorsHub Community
Register for free to join our community of investors and share your ideas. You will also get access to streaming quotes, interactive charts, trades, portfolio, live options flow and more tools.

