


Sunday, August 13, 2017 9:17:18 PM
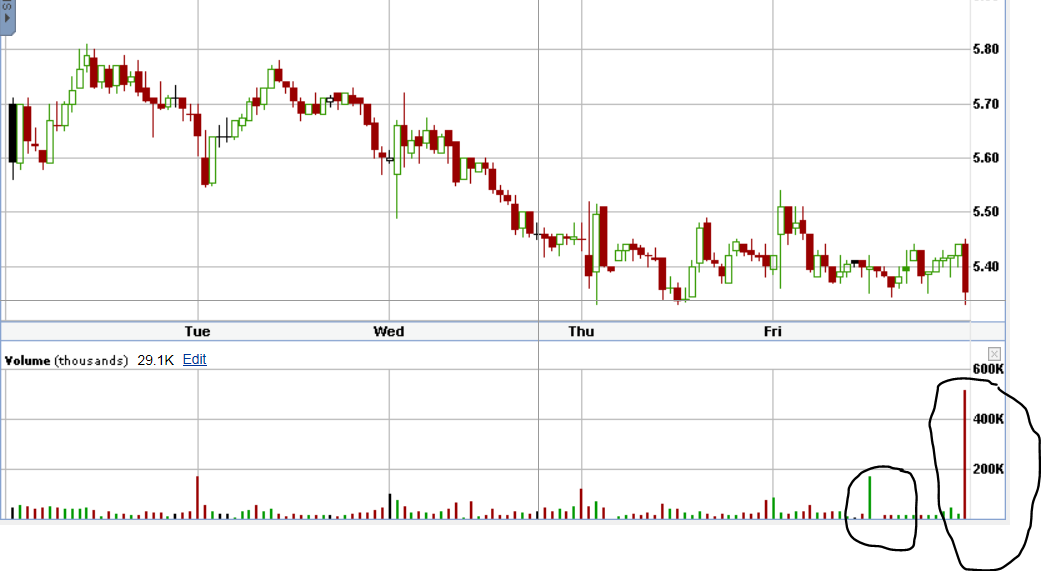
I glanced at a five day chart and the volume candles stuck out to me from this trading range as well.
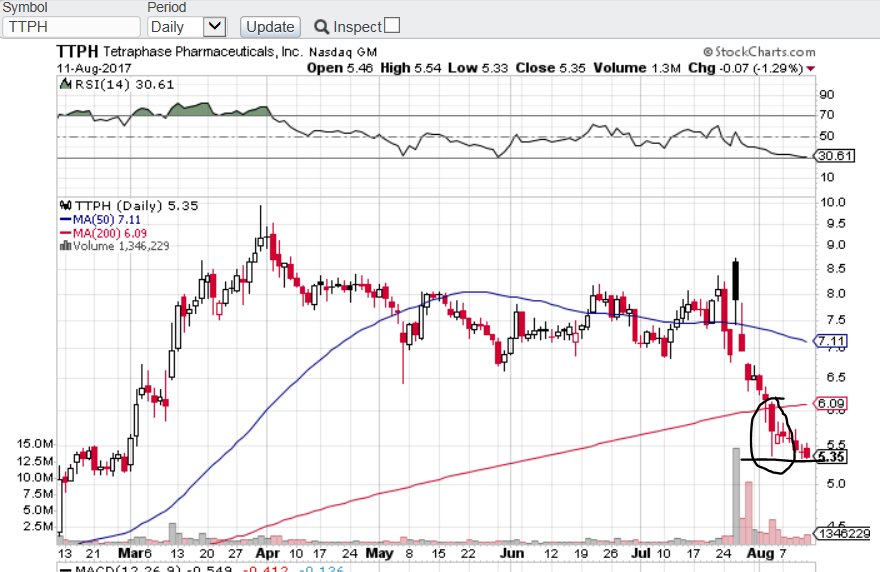
Also noticed on a daily chart that the day the big candle down below $6 occurred on Aug 3rd (day after earnings) where it again dipped to that $5.35 level before seeing high volume and support.
Again, I have much less of a clue as to the in's and out's of technical analysis. Just reaching for straws and looking for trends here. BUT.... It does appear there is support in that range. Guess the coming week will tell if this is the bottom and the share price starts to climb or if it keeps selling off from here.
Fundamentally there's really no justification that I can think of for this continued sell off. Nothing in the earnings was a surprise, the company is in good standings financially, and there are many short term catalysts that are coming soon. With so many shares were just bought for $6.50 like two weeks ago I just cant see it going down much more from here. But I'm probably wrong and it's going to drop to $4.50 lol. Guess we shall see.
I know the red/green volume is supposed to represent a buy vs a sell, but theoretically speaking, doesn't there always have to be a buyer if there is a seller and vice versa? Does it just represent a sell into the bid vs a buy on the ask? Really wish I knew more of the ins and outs as to how that whole process works.

Lingerie Fighting Championships Signs Broadcast Deal With Maybacks Global Entertainment • BOTY • Sep 26, 2024 9:00 AM
Maybacks Global Entertainment and Lingerie Fighting Championships Enter Into Broadcast And Revenue Sharing Agreement • AHRO • Sep 26, 2024 8:30 AM
North Bay Resources Commences Operations at Bishop Gold Mill, Inyo County, California; Engages Sabean Group Management Consulting • NBRI • Sep 25, 2024 9:15 AM
CEO David B. Dorwart Anticipates a Bright Future at Good Gaming Inc. Through His Most Recent Shareholder Update • GMER • Sep 25, 2024 8:30 AM
Cannabix Technologies and Omega Laboratories Inc. Advance Marijuana Breathalyzer Technology - Dr. Bruce Goldberger to Present at Society of Forensic Toxicologists Conference • BLOZF • Sep 24, 2024 8:50 AM
Integrated Ventures, Inc Announces Strategic Partnership For GLP-1 (Semaglutide) Procurement Through MedWell USA, LLC. • INTV • Sep 24, 2024 8:45 AM

