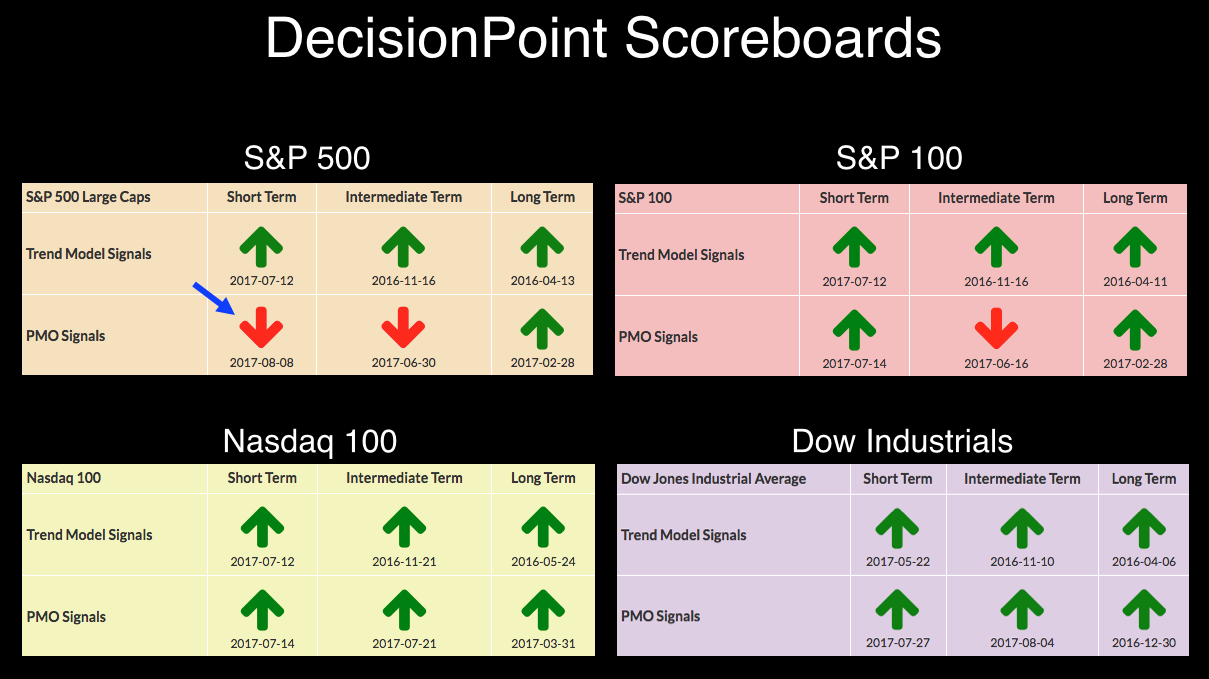
DP Bulletin: S&P 500 ($SPX) Generates ST PMO SELL Signal By Carl Swenlin | August 8, 2017
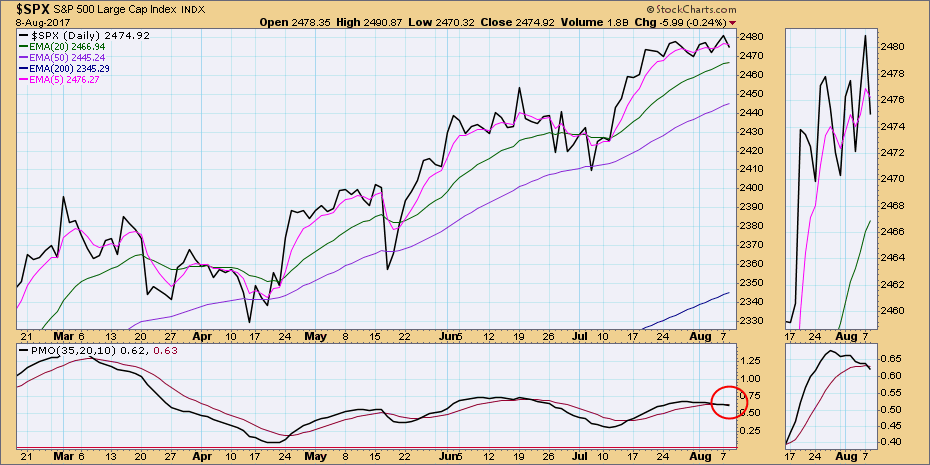
Today on the daily chart the $SPX PMO dropped below its signal line and generated a short-term PMO SELL signal. More notable, price opened and traded higher, but then it reversed and closed lower -- a key reversal day.
The line chart shows the modestly overbought PMO topping, then falling through its 10EMA.
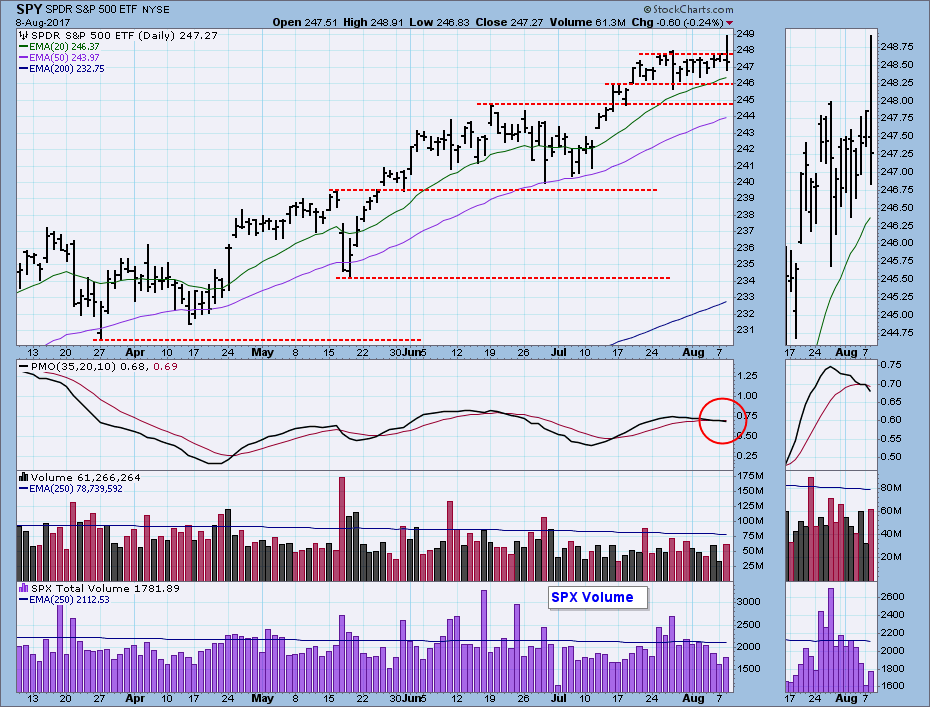
The key reversal is obvious on the daily bar chart below. Note that volume for both SPY and $SPX was well below the one-year average, so today was not a blowoff day. That is not necessarily a positive thing, considering (in my opinion) the distribution that has been taking place for the last few weeks.
Happy Charting! - Carl
Technical Analysis is a windsock, not a crystal ball.
Information posted to this board is not meant to suggest any specific action, but to point out the technical signs that can help our readers make their own specific decisions. Your Due Dilegence is a must! • DiscoverGold
Register for free to join our community of investors and share your ideas. You will also get access to streaming quotes, interactive charts, trades, portfolio, live options flow and more tools.


 News
News  Market Data
  Discover