| Followers | 689 |
| Posts | 143817 |
| Boards Moderated | 35 |
| Alias Born | 03/10/2004 |
Friday, July 28, 2017 9:20:45 AM
By Tom McClellan | July 27, 2017
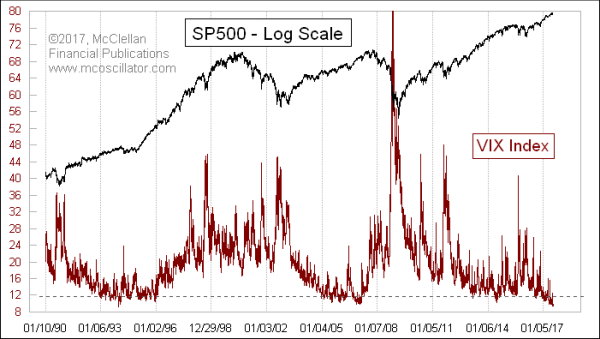
With the VIX Index down in the 9s, and with valuations at historic extremes, investors are wondering how long this all can last. The short answer is, MORE.
The VIX Index made its all-time closing low of 9.31 back on Dec. 22, 1993. It has posted intraday values below that number in July 2017, but has not yet made a lower closing low. The most important point that history teaches us about these extreme low VIX readings is that the lowest VIX closing value seldom coincides with the highest price high. And the amount of time between those two events can vary wildly.
Here is a look back at that all-time low in 1993:
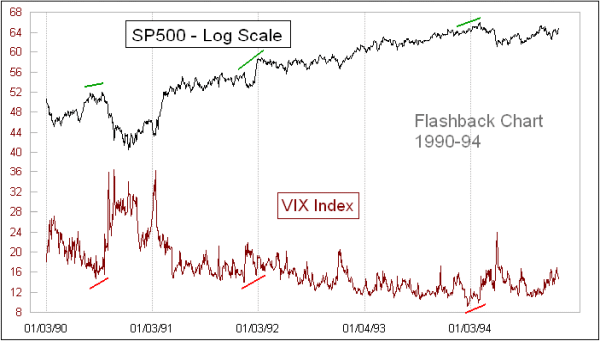
Notice that at each of the significant price tops in this period, the VIX was making a divergent higher low. So if one had understood this point back then, one could have observed the lower VIX levels and had some assurance that the top was not in at those moments.
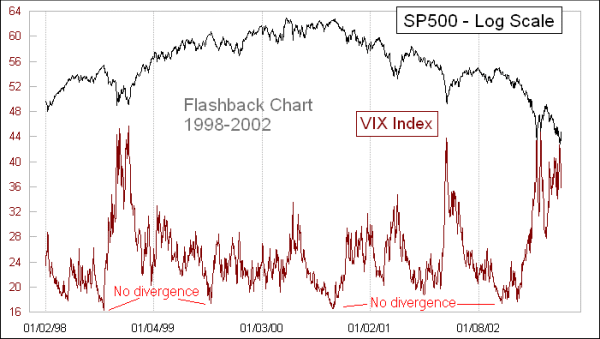
But this principle has not always been perfect. Around the Internet Bubble top in 2000, there were none of these nice VIX divergences. Thankfully there were lots of other indications back then to tell us that the market was having problems.
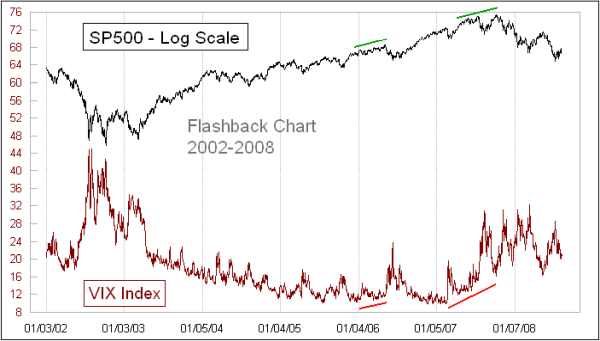
At the 2007 top, the VIX was back to giving us nice divergences to mark the price tops. And the old rule about seeing the VIX making lower lows was a good sign to stay long, expecting more uptrend for prices.
So it appears to matter whether we are in a period of strong liquidity, with the A-D Line making higher highs along with prices, versus an illiquid bubble blowoff condition like we saw around 2000. In a liquid market, an A-D Line divergence shows a loss of that liquidity, and the transition to a corrective period or an outright bear market. VIX divergences may have that same message.
Here is a final chart that zooms in on the most recent time period.
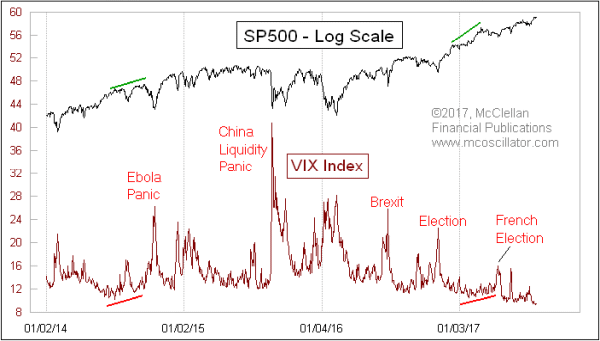
There have been some momentary bits of excitement along the way, but hardly any divergences. And the lower VIX lows now say that the uptrend in prices is not done yet.
Tom McClellan
Editor, The McClellan Market Report
http://www.mcoscillator.com/learning_center/weekly_chart/how_vix_ends_a_long_run_of_low_values/
• DiscoverGold
Click on "In reply to", for Authors past commentaries
*** For Market Direction and Trends visit our board:
https://investorshub.advfn.com/Market-Direction-and-Trends-26249/
Information posted to this board is not meant to suggest any specific action, but to point out the technical signs that can help our readers make their own specific decisions. Your Due Dilegence is a must!
• DiscoverGold
Recent VXX News
- Form 424B2 - Prospectus [Rule 424(b)(2)] • Edgar (US Regulatory) • 09/04/2024 03:13:56 PM
- Form 424B2 - Prospectus [Rule 424(b)(2)] • Edgar (US Regulatory) • 09/04/2024 03:03:20 PM
- Form 424B2 - Prospectus [Rule 424(b)(2)] • Edgar (US Regulatory) • 09/04/2024 03:03:17 PM
- Form 424B2 - Prospectus [Rule 424(b)(2)] • Edgar (US Regulatory) • 09/04/2024 03:02:00 PM
- Form 424B2 - Prospectus [Rule 424(b)(2)] • Edgar (US Regulatory) • 09/04/2024 02:55:01 PM
- Form 424B2 - Prospectus [Rule 424(b)(2)] • Edgar (US Regulatory) • 09/04/2024 02:43:31 PM
- Form 424B2 - Prospectus [Rule 424(b)(2)] • Edgar (US Regulatory) • 09/04/2024 02:41:39 PM
- Form 424B2 - Prospectus [Rule 424(b)(2)] • Edgar (US Regulatory) • 09/04/2024 02:37:13 PM
- Form 424B2 - Prospectus [Rule 424(b)(2)] • Edgar (US Regulatory) • 09/03/2024 07:50:34 PM
- Form 424B2 - Prospectus [Rule 424(b)(2)] • Edgar (US Regulatory) • 09/03/2024 07:48:28 PM
- Form 424B2 - Prospectus [Rule 424(b)(2)] • Edgar (US Regulatory) • 09/03/2024 07:45:20 PM
- Form 424B2 - Prospectus [Rule 424(b)(2)] • Edgar (US Regulatory) • 09/03/2024 07:44:01 PM
- Form 424B2 - Prospectus [Rule 424(b)(2)] • Edgar (US Regulatory) • 09/03/2024 07:40:58 PM
- Form 424B2 - Prospectus [Rule 424(b)(2)] • Edgar (US Regulatory) • 09/03/2024 07:32:41 PM
- Form 424B2 - Prospectus [Rule 424(b)(2)] • Edgar (US Regulatory) • 09/03/2024 07:31:05 PM
- Form 424B2 - Prospectus [Rule 424(b)(2)] • Edgar (US Regulatory) • 09/03/2024 06:59:48 PM
- Form 424B2 - Prospectus [Rule 424(b)(2)] • Edgar (US Regulatory) • 09/03/2024 06:55:59 PM
- Form 424B2 - Prospectus [Rule 424(b)(2)] • Edgar (US Regulatory) • 08/30/2024 06:36:03 PM
- Form 424B2 - Prospectus [Rule 424(b)(2)] • Edgar (US Regulatory) • 08/30/2024 06:17:15 PM
- Form 424B2 - Prospectus [Rule 424(b)(2)] • Edgar (US Regulatory) • 08/30/2024 06:17:13 PM
- Form 424B2 - Prospectus [Rule 424(b)(2)] • Edgar (US Regulatory) • 08/30/2024 05:08:26 PM
- Form 424B2 - Prospectus [Rule 424(b)(2)] • Edgar (US Regulatory) • 08/30/2024 04:51:12 PM
- Form 424B2 - Prospectus [Rule 424(b)(2)] • Edgar (US Regulatory) • 08/30/2024 04:51:00 PM
- Form 424B2 - Prospectus [Rule 424(b)(2)] • Edgar (US Regulatory) • 08/30/2024 04:17:39 PM
- Form 424B2 - Prospectus [Rule 424(b)(2)] • Edgar (US Regulatory) • 08/30/2024 04:14:48 PM
VHAI - Vocodia Partners with Leading Political Super PACs to Revolutionize Fundraising Efforts • VHAI • Sep 19, 2024 11:48 AM
Dear Cashmere Group Holding Co. AKA Swifty Global Signs Binding Letter of Intent to be Acquired by Signing Day Sports • DRCR • Sep 19, 2024 10:26 AM
HealthLynked Launches Virtual Urgent Care Through Partnership with Lyric Health. • HLYK • Sep 19, 2024 8:00 AM
Element79 Gold Corp. Appoints Kevin Arias as Advisor to the Board of Directors, Strengthening Strategic Leadership • ELMGF • Sep 18, 2024 10:29 AM
Mawson Finland Limited Further Expands the Known Mineralized Zones at Rajapalot: Palokas step-out drills 7 metres @ 9.1 g/t gold & 706 ppm cobalt • MFL • Sep 17, 2024 9:02 AM
PickleJar Announces Integration With OptCulture to Deliver Holistic Fan Experiences at Venue Point of Sale • PKLE • Sep 17, 2024 8:00 AM


