


| Followers | 680 |
| Posts | 141212 |
| Boards Moderated | 36 |
| Alias Born | 03/10/2004 |
Monday, July 24, 2017 9:13:06 AM
How Big Of A Deleveraging Are We Talking About?
By Lance Roberts | July 24, 2017
Last week, I discussed the issue of debt and why “people buy payments.” This article generated much discussion and several emails including the following.
“You argue that rising debt levels lead to slower economic growth, but what if it is slower growth leading to rising debt levels?”
This is essentially the “causation” or “correlation” argument which has been a point of contentious debate over the last several years as debt levels in the U.S. have soared higher.
One of the primary problems, not only in the U.S., but globally, is that government spending has shifted away from productive investments that create jobs (infrastructure and development) to primarily social welfare and debt service which has a negative rate of return. According to the Center On Budget & Policy Priorities, nearly 75% of every tax dollar goes to non-productive spending.

Here is the real kicker, though. In the first quarter of 2017, the Federal Government spent $4.27 Trillion which was equivalent to 22.45% of the nation’s entire GDP. Of that total spending, $3.61 Trillion was financed by Federal revenues and $660 billion was financed through debt. In other words, it took almost all of the revenue received by the Government just to cover social welfare and service interest on the debt.
Debt Is The Cause, Not The Cure
Debt, if used for productive investments, can be a solution to stimulating economic growth in the short-term. However, in the U.S., debt has been squandered on increases in social welfare programs and debt service which has an effective negative return on investment. Therefore, the larger the balance of debt becomes, the more economically destructive it is by diverting an ever growing amount of dollars away from productive investments to service payments.
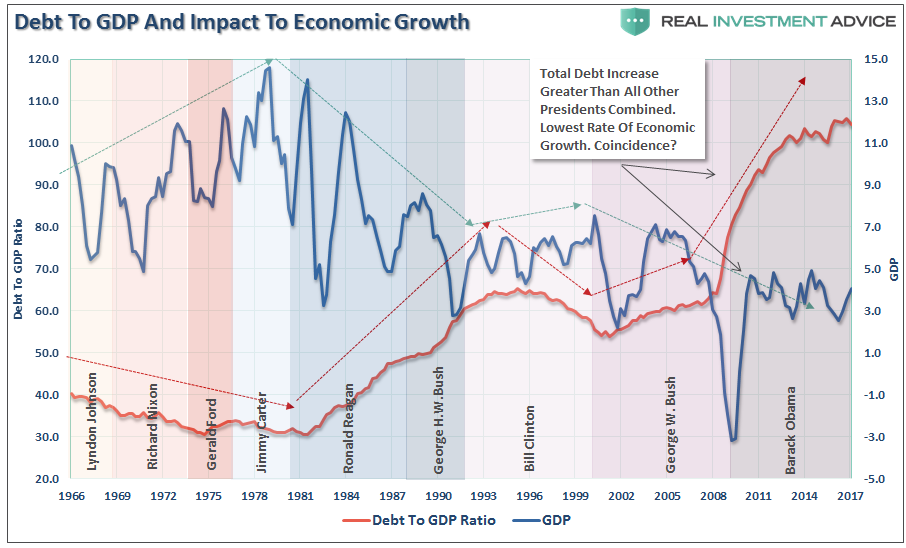
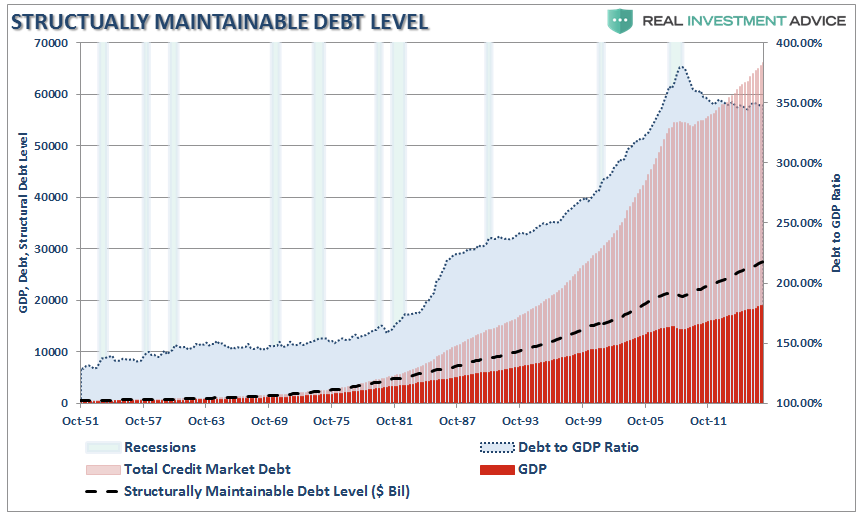
The relevance of debt growth versus economic growth is all too evident as shown below. Since 1980, the overall increase in debt has surged to levels that currently usurp the entirety of economic growth. With economic growth rates now at the lowest levels on record, the growth in debt continues to divert more tax dollars away from productive investments into the service of debt and social welfare.
(Note: I have not included the beginning of the Trump Presidency yet because the debt ceiling remains frozen. When the debt ceiling is lifted and the current ACTUAL debt is reflected, I will revise accordingly.)
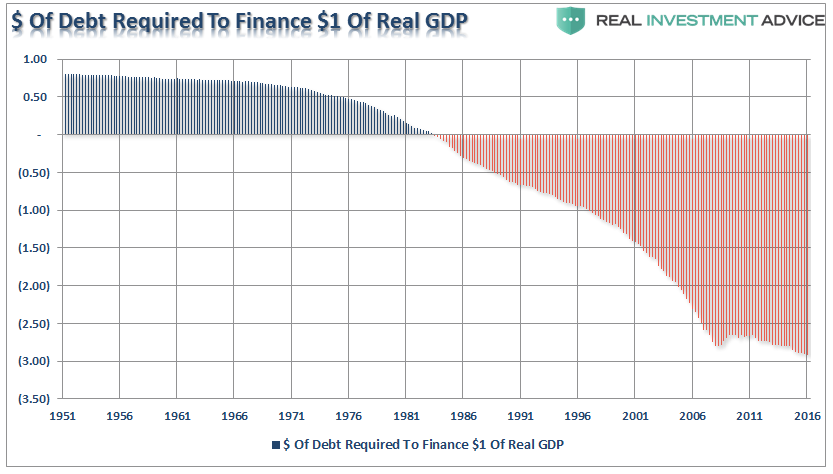
It now requires nearly $3.00 of debt to create $1 of economic growth.
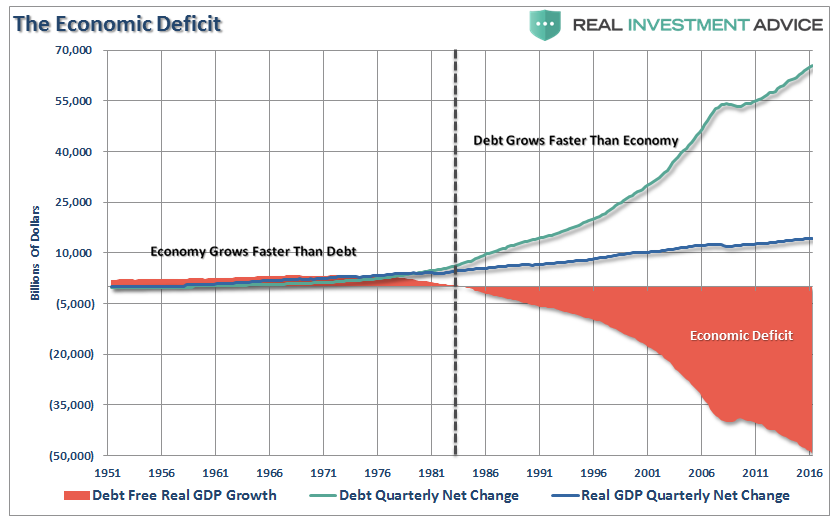
In fact, the economic deficit has never been greater. For the 30-year period from 1952 to 1982, the economic surplus fostered a rising economic growth rate which averaged roughly 8% during that period. Today, with the economy growing at an average rate of just 2%, the economic deficit has never been greater.
But again, it isn’t just Federal debt that is the problem. It is all debt.
As discussed last week, when it comes to households, which are responsible for roughly 2/3rds of economic growth through personal consumption expenditures, debt was used to sustain a standard of living well beyond what income and wage growth could support. This worked out as long as the ability to leverage indebtedness was an option. The problem is that eventually, the debt reaches a level where the level of debt service erodes the ability to consume at levels great enough to foster stronger economic growth.
In reality, the economic growth of the U.S. has been declining rapidly over the past 35 years supported only by a massive push into deficit spending by households.
What was the difference between pre-1980 and post-1980?
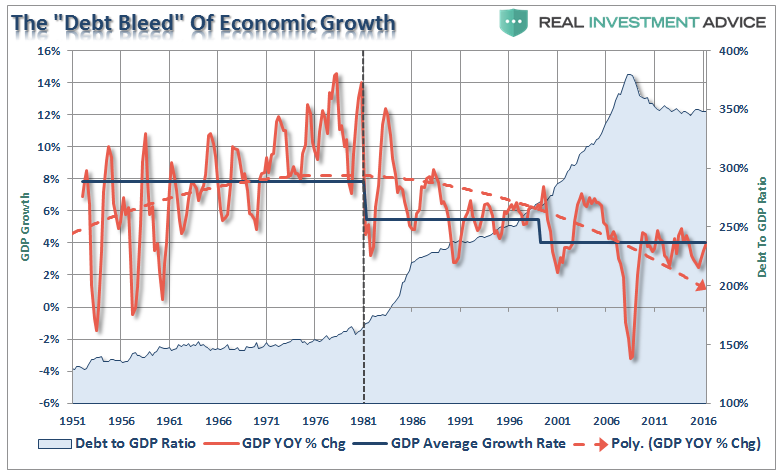
From 1950-1980, the economy grew at an annualized rate of 7.70%. This was accomplished with a total credit market debt to GDP ratio of less 150%. The CRITICAL factor to note is that economic growth was trending higher during this span going from roughly 5% to a peak of nearly 15%. There were a couple of reasons for this. First, lower levels of debt allowed for personal savings to remain robust which fueled productive investment in the economy. Secondly, the economy was focused primarily on production and manufacturing which has a high multiplier effect on the economy. This feat of growth also occurred in the face of steadily rising interest rates which peaked with economic expansion in 1980.
The obvious problem is the ongoing decline in economic growth over the past 35 years has kept the average American struggling to maintain their standard of living. As wage growth stagnates or declines, consumers are forced to turn to credit to fill the gap in maintaining their current standard of living. However, as more leverage is taken on, the more dollars are diverted from consumption to debt service thereby weighing on stronger rates of economic growth.
How Big Of A Deleveraging Are We Talking About?
The massive indulgence in debt, or a “credit induced boom”, has now begun to reach its inevitable conclusion. The debt driven expansion, which leads to artificially stimulated borrowing, seeks out diminishing investment opportunities. Ultimately these diminished investment opportunities lead to widespread malinvestments. Not surprisingly, we clearly saw it play out in “real-time” in 2005-2007 in everything from sub-prime mortgages to derivative instruments. Today, we see it again in mortgages, subprime auto loans, student loan debt and debt driven stock buybacks and acquisitions.
When credit creation can no longer be sustained the markets will begin to “clear” the excesses. It is only then, and must be allowed to happen, can resources be reallocated back towards more efficient uses. This is why all the efforts of Keynesian policies to stimulate growth in the economy have ultimately failed. Those fiscal and monetary policies, from TARP and QE to tax cuts, only delay the clearing process. Ultimately, that delay only potentially worsens the inevitable clearing process.
That clearing process is going to be very substantial. With the economy currently requiring roughly $3 of debt to create $1 of real, inflation-adjusted, economic growth, a reversion to a structurally manageable level of debt would involve a nearly $35 Trillion reduction of total credit market debt from current levels.
* * *
https://realinvestmentadvice.com/how-big-of-a-deleveraging-are-we-talking-about/
• DiscoverGold
Click on "In reply to", for Authors past commentaries
By Lance Roberts | July 24, 2017
Last week, I discussed the issue of debt and why “people buy payments.” This article generated much discussion and several emails including the following.
“You argue that rising debt levels lead to slower economic growth, but what if it is slower growth leading to rising debt levels?”
This is essentially the “causation” or “correlation” argument which has been a point of contentious debate over the last several years as debt levels in the U.S. have soared higher.
One of the primary problems, not only in the U.S., but globally, is that government spending has shifted away from productive investments that create jobs (infrastructure and development) to primarily social welfare and debt service which has a negative rate of return. According to the Center On Budget & Policy Priorities, nearly 75% of every tax dollar goes to non-productive spending.

Here is the real kicker, though. In the first quarter of 2017, the Federal Government spent $4.27 Trillion which was equivalent to 22.45% of the nation’s entire GDP. Of that total spending, $3.61 Trillion was financed by Federal revenues and $660 billion was financed through debt. In other words, it took almost all of the revenue received by the Government just to cover social welfare and service interest on the debt.
Debt Is The Cause, Not The Cure
Debt, if used for productive investments, can be a solution to stimulating economic growth in the short-term. However, in the U.S., debt has been squandered on increases in social welfare programs and debt service which has an effective negative return on investment. Therefore, the larger the balance of debt becomes, the more economically destructive it is by diverting an ever growing amount of dollars away from productive investments to service payments.
The relevance of debt growth versus economic growth is all too evident as shown below. Since 1980, the overall increase in debt has surged to levels that currently usurp the entirety of economic growth. With economic growth rates now at the lowest levels on record, the growth in debt continues to divert more tax dollars away from productive investments into the service of debt and social welfare.
(Note: I have not included the beginning of the Trump Presidency yet because the debt ceiling remains frozen. When the debt ceiling is lifted and the current ACTUAL debt is reflected, I will revise accordingly.)

It now requires nearly $3.00 of debt to create $1 of economic growth.

In fact, the economic deficit has never been greater. For the 30-year period from 1952 to 1982, the economic surplus fostered a rising economic growth rate which averaged roughly 8% during that period. Today, with the economy growing at an average rate of just 2%, the economic deficit has never been greater.

But again, it isn’t just Federal debt that is the problem. It is all debt.
As discussed last week, when it comes to households, which are responsible for roughly 2/3rds of economic growth through personal consumption expenditures, debt was used to sustain a standard of living well beyond what income and wage growth could support. This worked out as long as the ability to leverage indebtedness was an option. The problem is that eventually, the debt reaches a level where the level of debt service erodes the ability to consume at levels great enough to foster stronger economic growth.
In reality, the economic growth of the U.S. has been declining rapidly over the past 35 years supported only by a massive push into deficit spending by households.

What was the difference between pre-1980 and post-1980?
From 1950-1980, the economy grew at an annualized rate of 7.70%. This was accomplished with a total credit market debt to GDP ratio of less 150%. The CRITICAL factor to note is that economic growth was trending higher during this span going from roughly 5% to a peak of nearly 15%. There were a couple of reasons for this. First, lower levels of debt allowed for personal savings to remain robust which fueled productive investment in the economy. Secondly, the economy was focused primarily on production and manufacturing which has a high multiplier effect on the economy. This feat of growth also occurred in the face of steadily rising interest rates which peaked with economic expansion in 1980.
The obvious problem is the ongoing decline in economic growth over the past 35 years has kept the average American struggling to maintain their standard of living. As wage growth stagnates or declines, consumers are forced to turn to credit to fill the gap in maintaining their current standard of living. However, as more leverage is taken on, the more dollars are diverted from consumption to debt service thereby weighing on stronger rates of economic growth.
How Big Of A Deleveraging Are We Talking About?
The massive indulgence in debt, or a “credit induced boom”, has now begun to reach its inevitable conclusion. The debt driven expansion, which leads to artificially stimulated borrowing, seeks out diminishing investment opportunities. Ultimately these diminished investment opportunities lead to widespread malinvestments. Not surprisingly, we clearly saw it play out in “real-time” in 2005-2007 in everything from sub-prime mortgages to derivative instruments. Today, we see it again in mortgages, subprime auto loans, student loan debt and debt driven stock buybacks and acquisitions.
When credit creation can no longer be sustained the markets will begin to “clear” the excesses. It is only then, and must be allowed to happen, can resources be reallocated back towards more efficient uses. This is why all the efforts of Keynesian policies to stimulate growth in the economy have ultimately failed. Those fiscal and monetary policies, from TARP and QE to tax cuts, only delay the clearing process. Ultimately, that delay only potentially worsens the inevitable clearing process.
That clearing process is going to be very substantial. With the economy currently requiring roughly $3 of debt to create $1 of real, inflation-adjusted, economic growth, a reversion to a structurally manageable level of debt would involve a nearly $35 Trillion reduction of total credit market debt from current levels.

* * *
https://realinvestmentadvice.com/how-big-of-a-deleveraging-are-we-talking-about/
• DiscoverGold
Click on "In reply to", for Authors past commentaries
Information posted to this board is not meant to suggest any specific action, but to point out the technical signs that can help our readers make their own specific decisions. Your Due Dilegence is a must!
• DiscoverGold
Join the InvestorsHub Community
Register for free to join our community of investors and share your ideas. You will also get access to streaming quotes, interactive charts, trades, portfolio, live options flow and more tools.

