DecisionPoint Weekly Wrap -- Another Breakout to New, All-Time Highs By Carl Swenlin | July 21, 2017
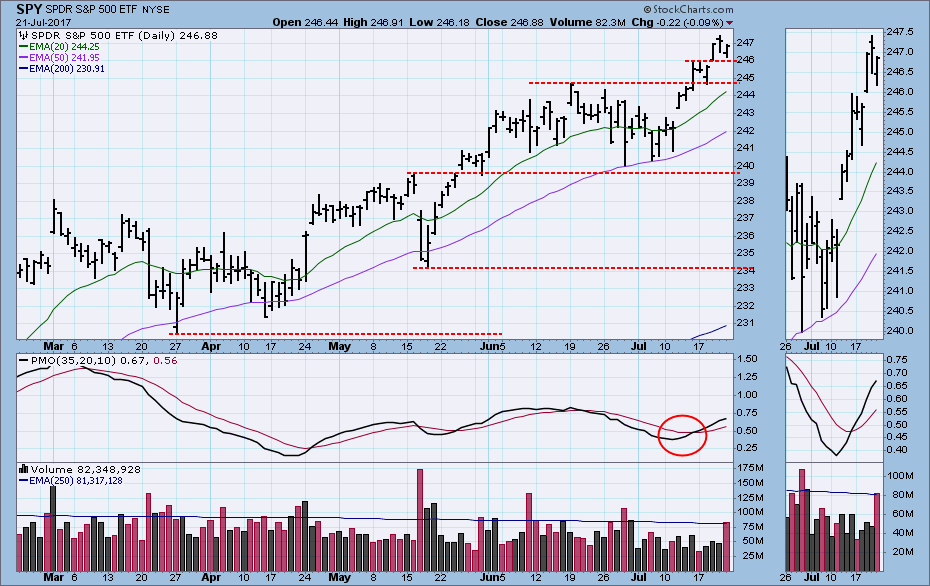
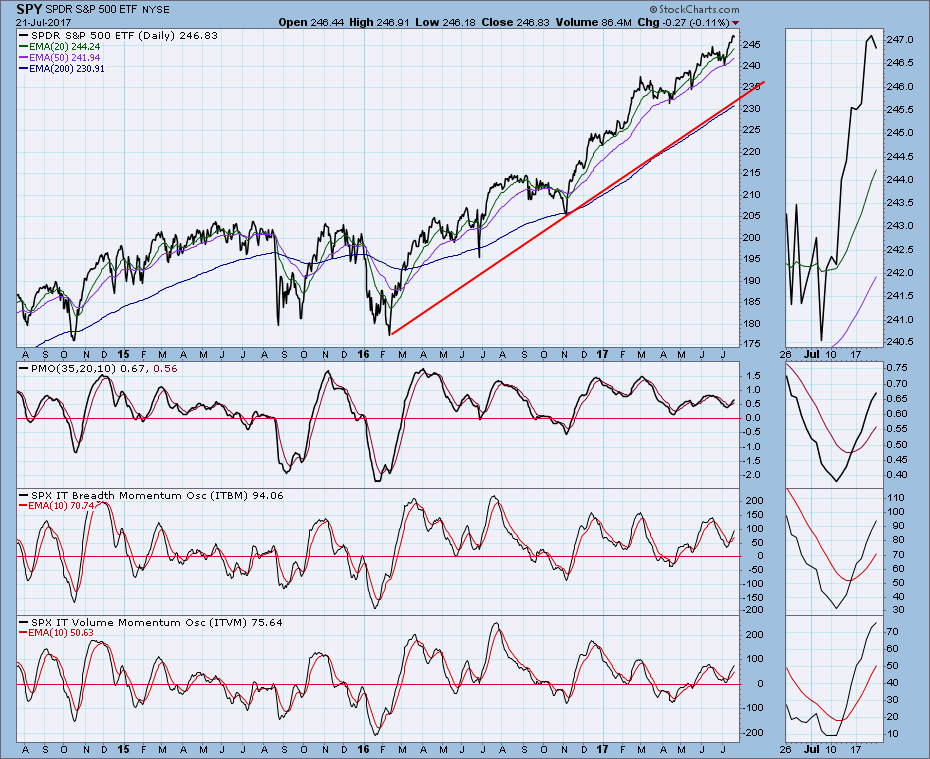
Last week the market broke out of a month-long rounded top to new, all-time highs. This week there was a short snapback to the point of breakout, then on Wednesday it once again broke to new, all-time highs. Thursday and Friday it again pulled back to the point of breakout. Friday was options expiration day, so there is no sinister message to be found in the high volume on SPY.
STOCKS
IT Trend Model: BUY as of 11/15/2016
LT Trend Model: BUY as of 4/1/2016
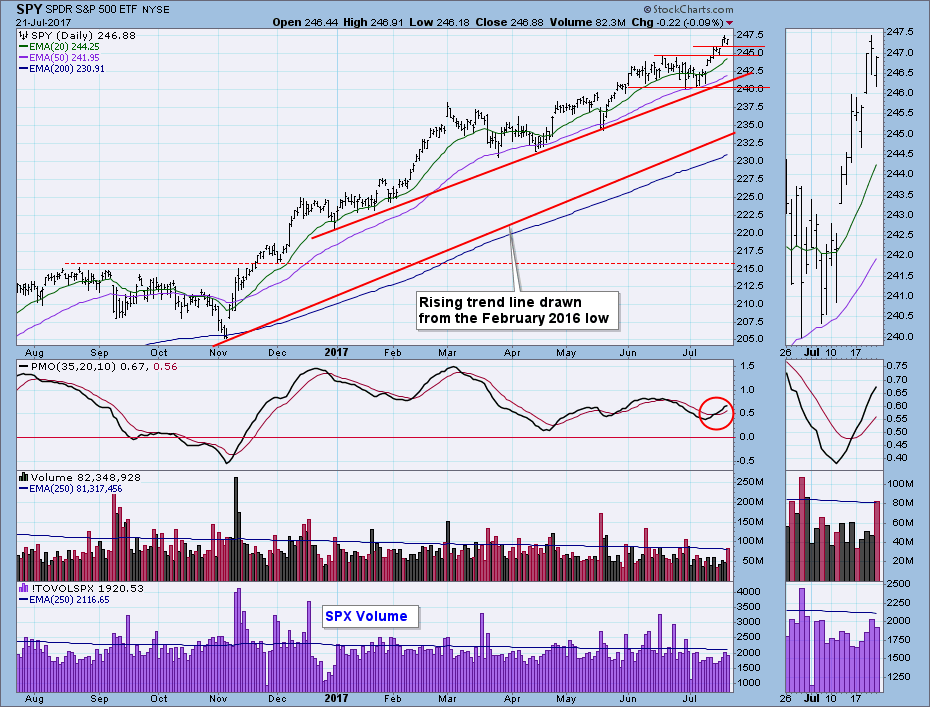
Based upon how far price is above the 200EMA, we can safely say that the market is overbought. One of these days price is going to correct back to the bull market rising trend line, but it hasn't had the inclination to do so for about nine months. On the large PMO panel below the PMO looks as if it is trying to top, but the thumbnail chart shows no such inclination.
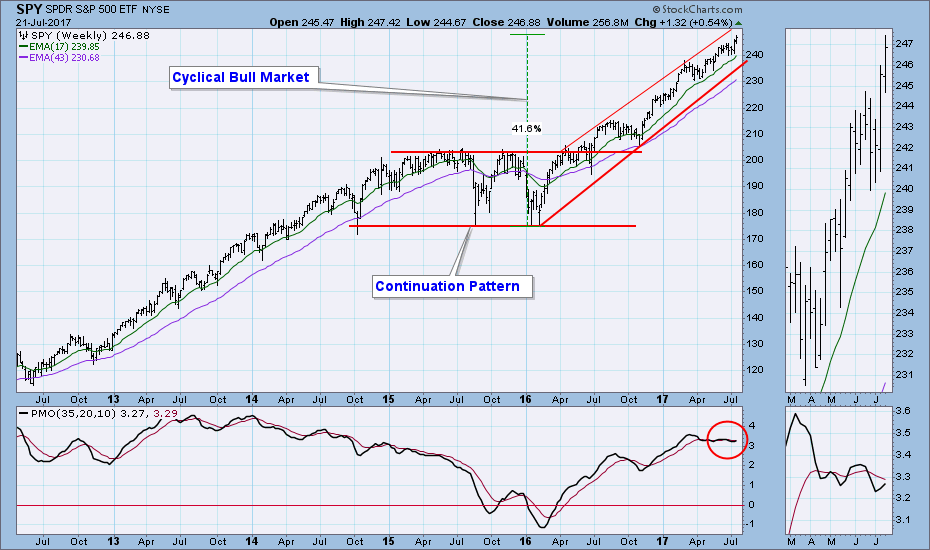
During the current cyclical bull market price has advanced +42% off the February 2016 low. Price is hugging the top half of the rising trend channel, and the weekly PMO is moving sideways at a high level. Nothing but strength showing here.
Short-Term Market Indicators: The bottom two indicators have topped, so we may see price moving sideways in this time frame.
Intermediate-Term Market Indicators: These indicators are moving higher from recent bottoms in the neutral zone. They have room to accommodate higher price, but price is pretty overbought.
Conclusion: Short-term indicators imply that some sideways movement in price is possible, but intermediate-term indicators allow for higher prices. Internals aside, price is far above the bull market rising trend line (see chart above), which is a compelling picture of how overbought the market is. Some amount of correction is needed, but in a strong bull market it is not a setup for shorting.
DOLLAR
IT Trend Model: NEUTRAL as of 3/21/2016
LT Trend Model: SELL as of 5/24/2017
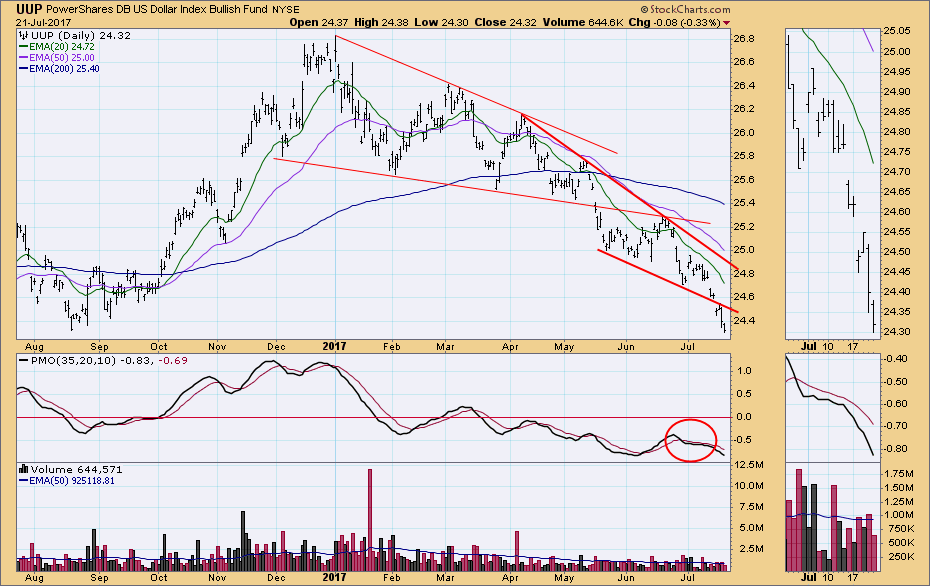
Last week it looked as if UUP was going to fall below the bottom of the falling wedge pattern, and on Tuesday it did just that. We can see that this is the second time since May that a bullish falling wedge has resolved bearishly, and there is a clear impression that the price decline from the January high is accelerating.
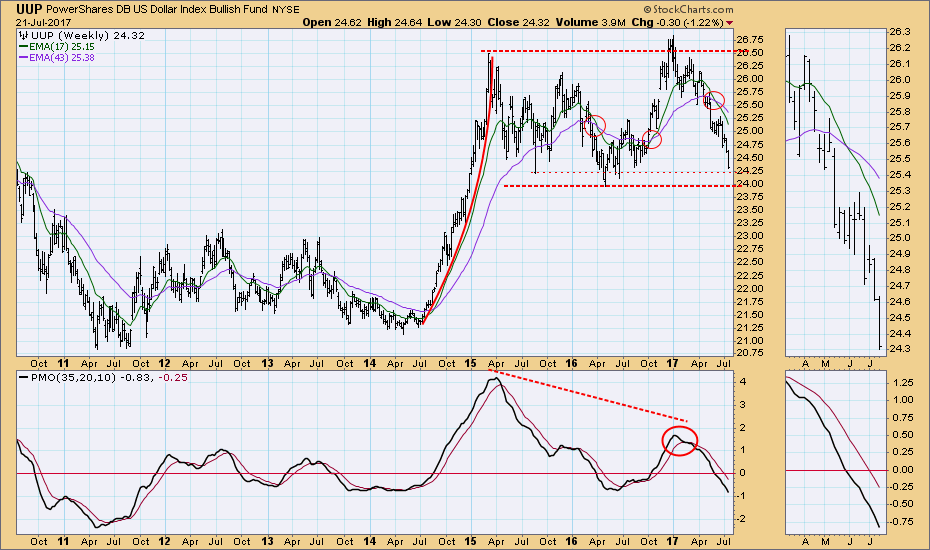
The weekly chart shows that price has reached a zone of support, but so far there is no indication that it is getting ready to form a bottom.
Click on "In reply to", for Authors past commentaries
Information posted to this board is not meant to suggest any specific action, but to point out the technical signs that can help our readers make their own specific decisions. Your Due Dilegence is a must! • DiscoverGold
Register for free to join our community of investors and share your ideas. You will also get access to streaming quotes, interactive charts, trades, portfolio, live options flow and more tools.


 News
News  Market Data
  Discover