


| Followers | 689 |
| Posts | 143817 |
| Boards Moderated | 35 |
| Alias Born | 03/10/2004 |
Saturday, July 22, 2017 11:48:43 AM
CoT: Peek Into Future Through Futures – How Hedge Funds Are Positioned
By Hedgopia | July 22, 2017
Following futures positions of non-commercials are as of July 18, 2017.
E-mini S&P 500: Currently net long 102.4k, up 23.8k.
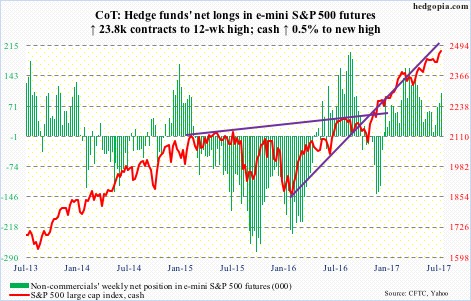
Last Friday’s mini-breakout on the cash was tested this week – successfully – quickly followed by a new high. The new number to beat: 2477.62.
Weekly and monthly charts have been in overbought territory, now joined by the daily. That said, shorter-term averages are rising, particularly the 10-day, which the bulls will try to defend for sure – at least initially.
As far as the flows go, the divergence among SPY (SPDR S&P 500 ETF), VOO (Vanguard S&P 500 ETF) and IVV (iShares core S&P 500 ETF) continued with the former losing $2.6 billion in the week to Wednesday and the latter attracting $2.6 billion. VOO lost $61 million (courtesy of ETF.com).
In the same week, U.S.-based equity funds lost $2.6 billion (courtesy of Lipper). In the last five weeks, four saw outflows, totaling $14.3 billion.
Nasdaq 100 index (mini): Currently net long 38.8k, up 8k.
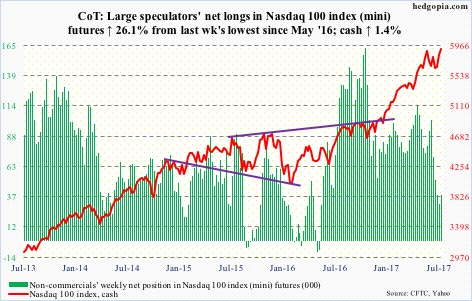
After five weeks of outflows totaling $3 billion, QQQ (PowerShares Nasdaq 100 ETF) experienced inflows for the second week running – $3.1 billion in total, $663 million of which came in the week ended Wednesday (courtesy of ETF.com).
The 5.4-percent drop, nearly lasting a month, since June 9 (5897.69) has all been recouped, and then some. Wednesday, it surpassed that high, followed by a new high Thursday (5932.61).
Shorts likely lent a helping hand. Short interest on QQQ, XLK (SPDR technology ETF), or the Nasdaq composite for that matter, remains elevated. Mid-July numbers will be reported Tuesday.
Russell 2000 mini-index: Currently net short 30k, down 7.5k.
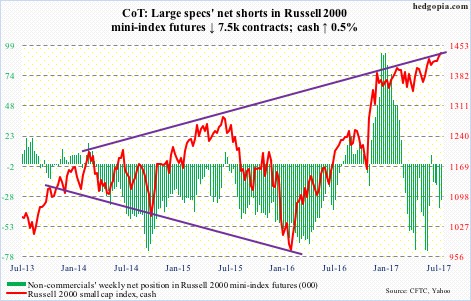
Small-cap bulls continue to hammer on the upper bound of a rising channel from last December. No breakout yet, with the cash reversing hard Friday after rising to a new all-time high of 1452.05. This followed Thursday’s long-legged doji.
Flows continue to be a problem.
In the week to Wednesday, IWM (iShares Russell 2000 ETF) witnessed outflows in every single session, for a total of $1.4 billion. In the past four weeks, redemptions totaled $3 billion. On Wednesday, when the Russell 2000 rallied one percent to a new high, $574 million came out of the ETF (courtesy of ETF.com).
US Dollar Index: Currently net long 2.1k, down 288.
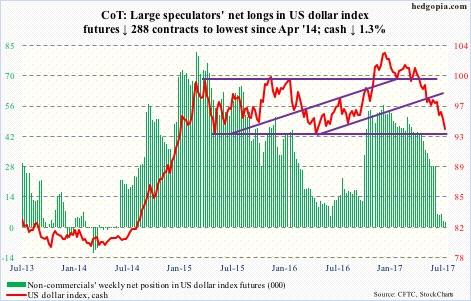
The euro comprises 57.6 percent of the US dollar index. The former’s gain was the latter’s loss on Thursday, down 0.5 percent.
The US dollar index has been under incessant pressure since it peaked early this year, and is at/near crucial support. Between May last year and the peak early this year, it rallied 13 percent. At 94.70, it retraced 76.4 percent of that move – an important Fibonacci level.
This week also saw completion of a measured-move target of a head-and-shoulders pattern that formed over several months late last year and early this year.
Also, for two and a half years now, barring a false breakout last November, the dollar index (93.68) has been range-bound, with the lower bound north of 93. Dollar bulls better be hoping this support holds.
VIX: Currently net short 140.4k, up 30.1k.
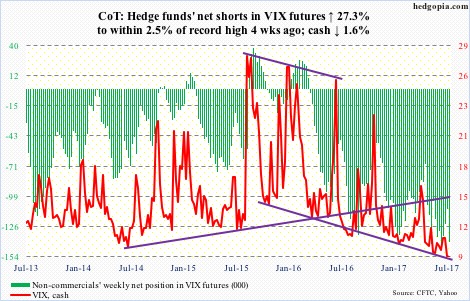
Through Friday, the cash closed below 10 for seven straight sessions. In the history of VIX (going back to 1990), there have only been 21 sub-10 closes, 12 of which occurred since May this year. Talk about volatility suppression!
Volatility bulls will have their day – whenever that is. Misery will end when it ends.
At least near term, the CBOE equity put-to-call ratio has been in the .50s the past three sessions. Things are complacent.
https://hedgopia.com/cot-peek-into-future-through-futures-how-hedge-funds-are-positioned-10/
• DiscoverGold
Click on "In reply to", for Authors past commentaries
Information posted to this board is not meant to suggest any specific action, but to point out the technical signs that can help our readers make their own specific decisions. Your Due Dilegence is a must!
• DiscoverGold
Join the InvestorsHub Community
Register for free to join our community of investors and share your ideas. You will also get access to streaming quotes, interactive charts, trades, portfolio, live options flow and more tools.

