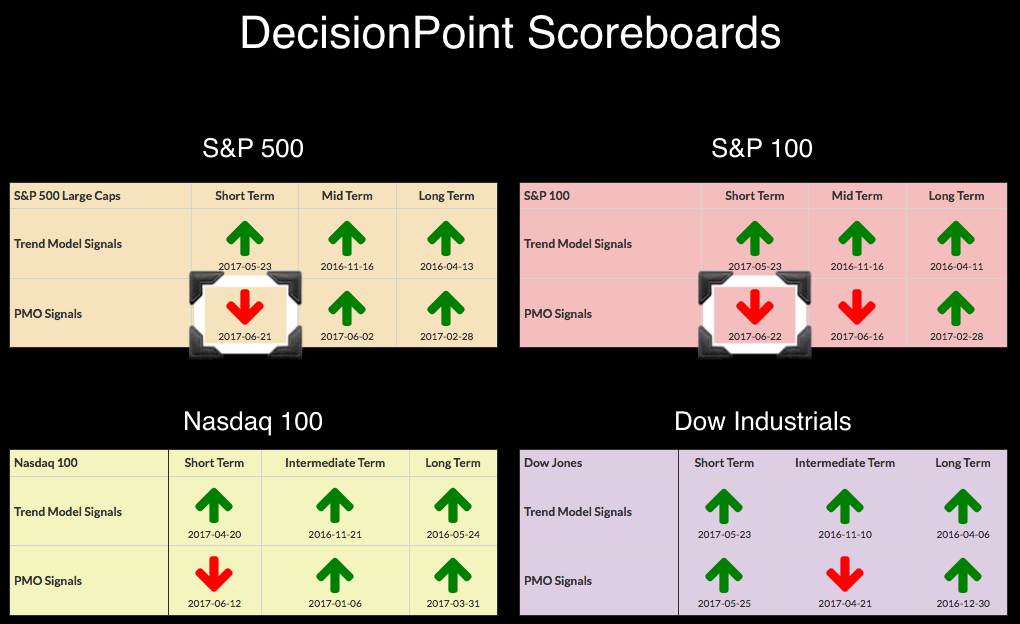
DP Alert: NEW PMO SELL Signals on $OEX and $SPX - TLT Closing the Gap By Erin Heim | June 22, 2017
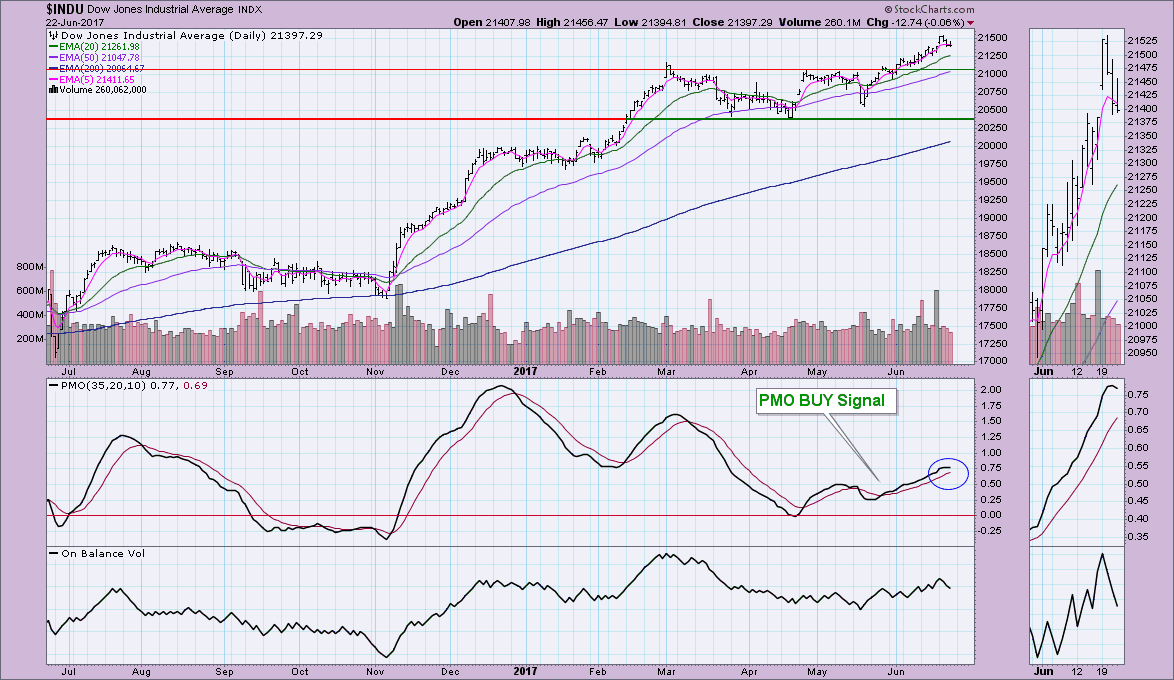
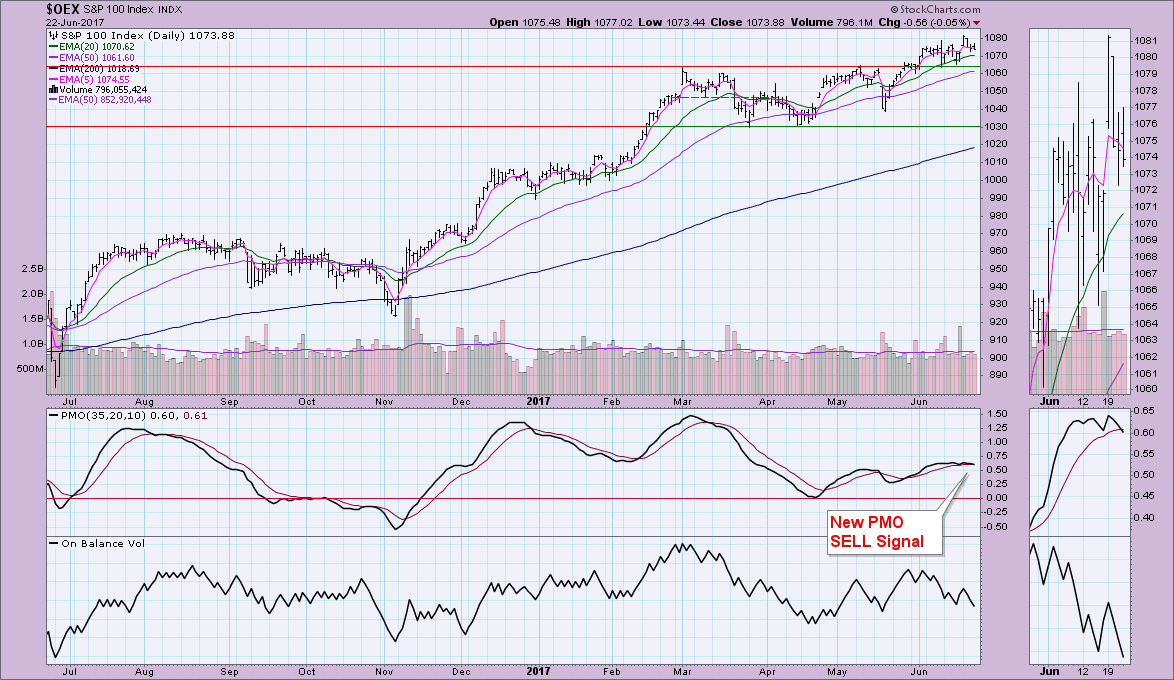
The S&P 500 triggered a new PMO SELL signal yesterday at the close. Today, the S&P 100 joined in with its own PMO SELL signal. At this point, the Dow is the only one holding onto a PMO BUY signal, but a quick peek at the chart and we can see the PMO has topped and is heading down.
SIGNALS: Here we include charts of any important signal changes triggered today by our Intermediate-Term Trend Model.
NO NEW SIGNALS TO REPORT.
STOCKS
IT Trend Model: BUY as of 11/15/2016
LT Trend Model: BUY as of 4/1/2016
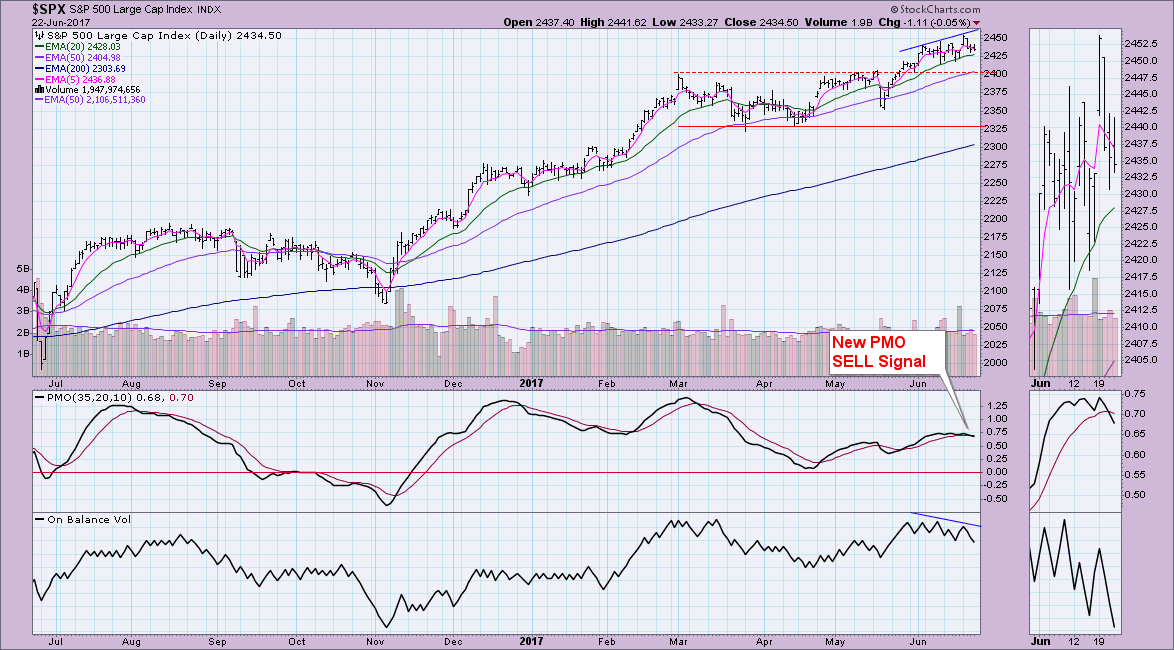
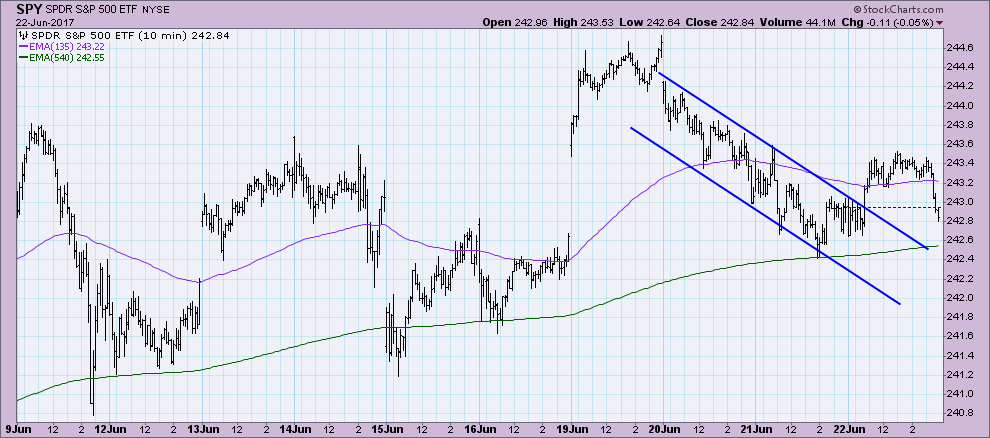
The declining trend channel looked as if it would stay intact this morning, but price did rally enough to breakout. Unfortunately, by the end of the day, it was back in negative territory, making a move down toward the declining tops line that formed the top of the channel.
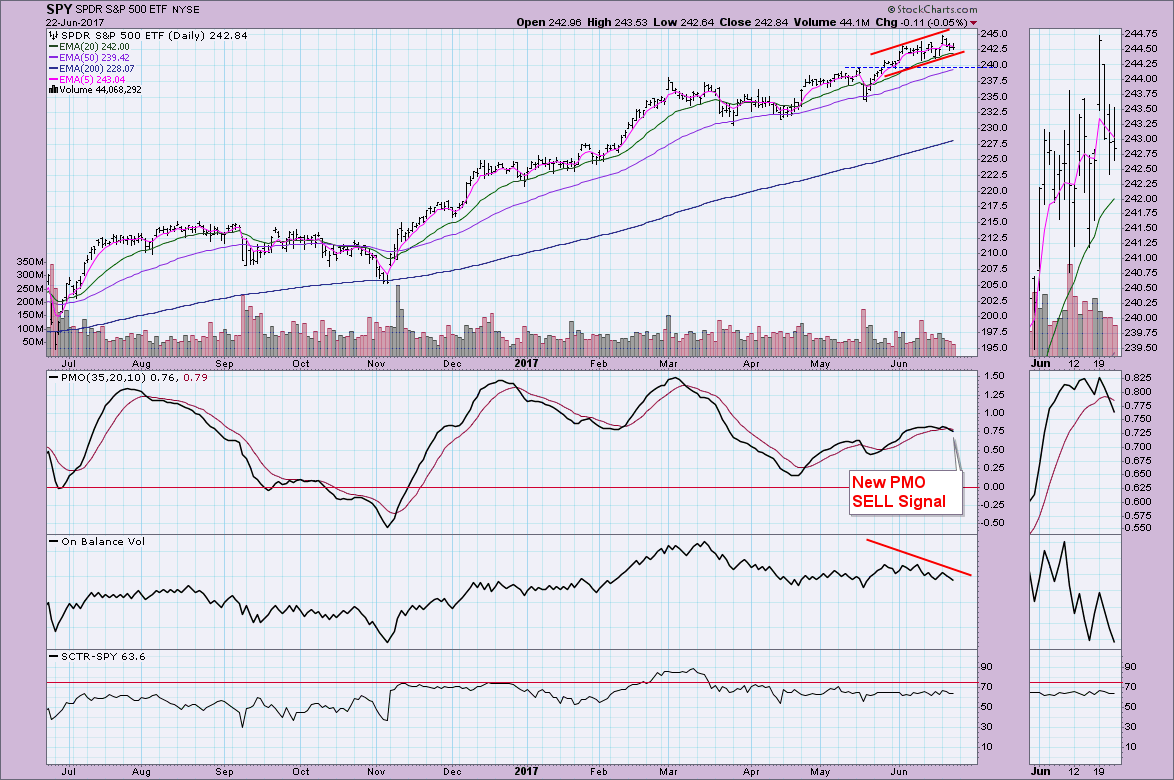
I've annotated the new PMO SELL signal. Note also that we have a clear negative divergence between the OBV and price tops. The SCTR remains healthy which is why I am looking for more sideways movement or even possibly a pullback of some sort. The SCTR tells us that there is still internal and relative strength within the SPY so I'm not looking for a correction past $240.
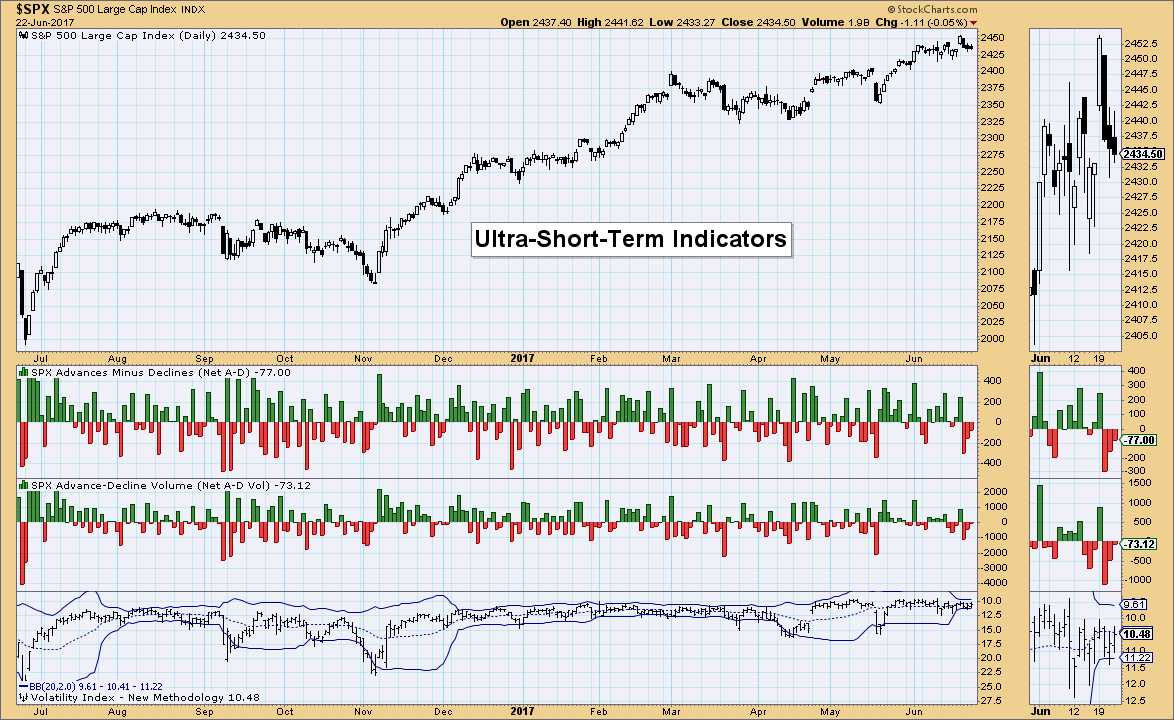
Ultra-Short-Term Indicators: Not much to say here except to note that negative breadth is declining as price moves lower. This is actually bullish for the next few days.
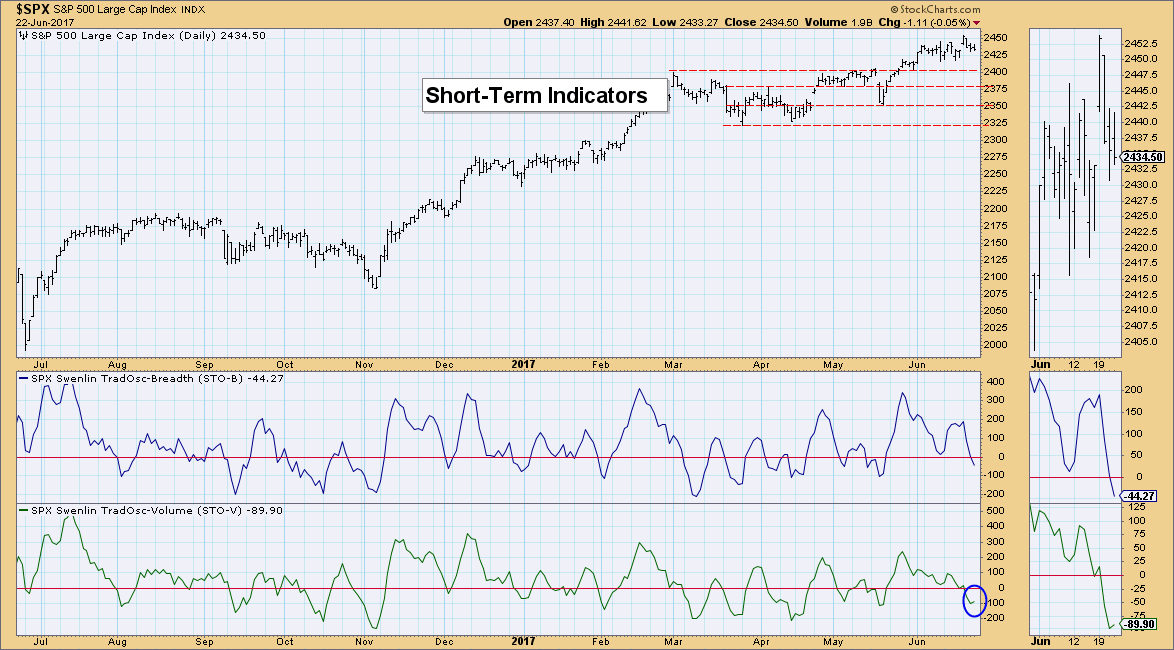
Short-Term Indicators: Good news here is that the STO-V has turned up. It's only tick up, so I'm not going to get really excited, but it is an improvement. These indicators are now in somewhat near-term oversold territory, so a turn back up here would still give us plenty of upside to support a rally. For now, they are in a declining trend and suggest more consolidation or some downside movement.
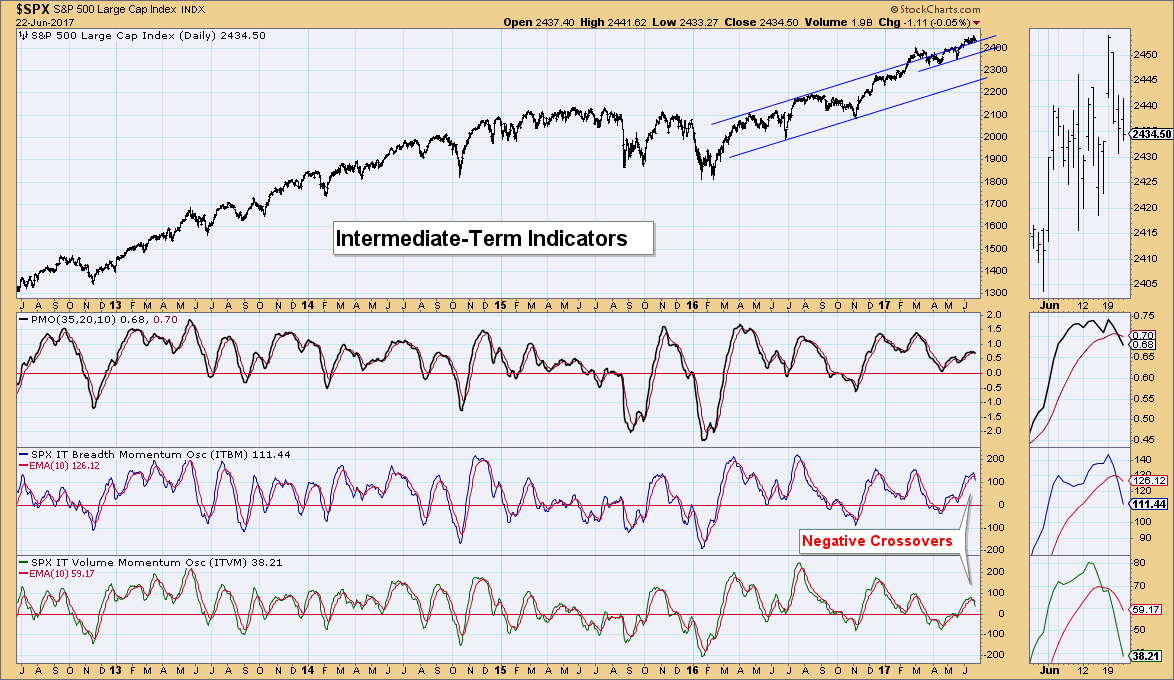
Intermediate-Term Indicators: These indicators have the bastion of hope for a continued rally higher, but they have topped and are negative in my opinion. I've held off judgement, but two negative crossovers are hard to ignore. Realizing that the market is still relatively strong, I'm not expecting a serious decline just yet. Remember the short-term indicators are thinking about getting bullish.
Conclusion: Indicators are somewhat mixed. Breadth seems to suggest this decline is ready to subside already and short-term indicators are considering bottoming in somewhat oversold territory. However, the intermediate term is a concern. If the market would cool, I would be looking for a correction, but it simply has not. It will pullback somewhat and travel sideways and that, has helped indicators unwind back to oversold territory. So despite bearish intermediate-term indicators, I am still not yet looking for a serious correction. A pullback and some consolidation around $240 for the SPY seems about right. . .
Information posted to this board is not meant to suggest any specific action, but to point out the technical signs that can help our readers make their own specific decisions. Your Due Dilegence is a must! • DiscoverGold
Register for free to join our community of investors and share your ideas. You will also get access to streaming quotes, interactive charts, trades, portfolio, live options flow and more tools.


 News
News  Market Data
  Discover