Buyback Deceleration Continues – Stocks Immune Thus Far By Hedgopia | June 22, 2017
The final numbers are in for buybacks, and it continues to show a decelerating trend.
In 1Q17, S&P 500 companies spent $133.2 billion in share purchases– down 1.6 percent quarter-over-quarter and down a whopping 17.5 percent year-over-year. One year ago, buybacks reached $161.4 billion, which was the highest since the all-time high $172 billion in 3Q07.
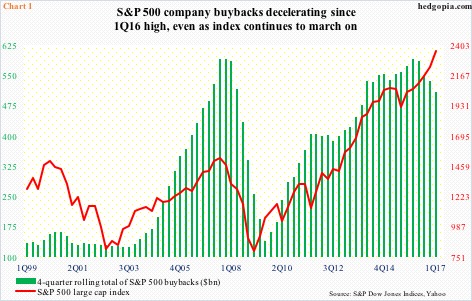
On a 12-month rolling total basis, too, buybacks peaked in 1Q16 at $589.4 billion – a record, with 1Q17 at $508.1 billion (Chart 1).
The decelerating trend in buybacks is yet to catch up with the S&P 500 large cap index. In 1Q17, the index rose 5.5 percent.
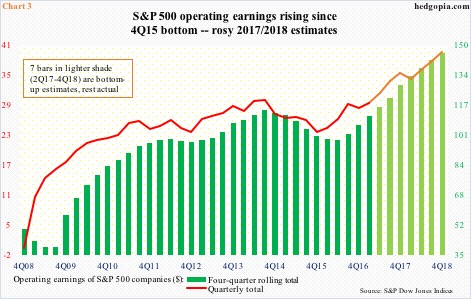
In fact, a combination of less money spent and a rising price resulted in fewer share reductions, which by default meant lesser tailwind for earnings per share. During the quarter, operating earnings rose 3.3 percent q/q (Chart 3).
The relation between the two variables in Chart 1 does not necessarily have to be linear quarter by quarter. But over time the red line tends to follow the green bars.
Thus far, the two have diverged.
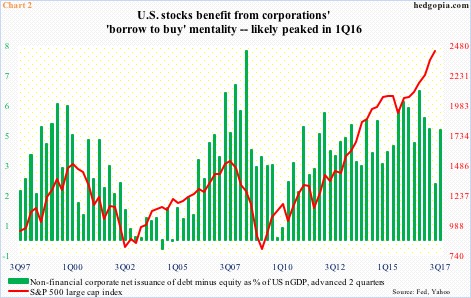
There is a similar dynamic in play in Chart 2, which combines non-financial corporate equity issuance with debt issuance. Equity issuance is subtracted from debt issuance, and the net is used to calculate a share of nominal GDP.
In 1Q17, for instance, corporations raised $426.6 billion (seasonally adjusted annual rate) in debt, even as they spent $475.9 billion in equity purchases. The total equaled 4.7 percent of nominal GDP of $19 trillion, which is what the green bars show, and they are advanced by two quarters.
In 1Q17, there was a nice jump in the green bar, but it also peaked a year ago. The trend is down. Once again, the two variables in Chart 2 are on a divergent path.
Hence the importance of Chart 3.
Buybacks are already in deceleration. There is a limit to using debt issuance as a perennial funding source of buybacks. Earnings are a different matter.
As things stand, 2017/2018 estimates have built in a very optimistic scenario. If they are realized, the buyback ship can steady itself.
Here is the thing, though.
As of the 15th this month, operating earnings estimates of S&P 500 companies for this year were $128.16. This would have risen from $106.26 last year. Similarly, 2018 estimates stand at $145.67. How realistic are these estimates?
We know this much. The revision trend is decidedly down.
In January last year, 2017 estimates were $141.11. In February 2015, 2016 estimates were $137.50. Even 2018 estimates in January this year were $147.21, but are holding up – relatively.
For these estimates to come through, the U.S. economy probably needs to do a 360 and start growing in the three-percent range. Given where things are in the cycle and how subdued the cycle has been thus far, it is one scenario to fade. Translation: Elevated earnings expectations in all probability fail to come through, and buyback deceleration continues.
Information posted to this board is not meant to suggest any specific action, but to point out the technical signs that can help our readers make their own specific decisions. Your Due Dilegence is a must! • DiscoverGold
Register for free to join our community of investors and share your ideas. You will also get access to streaming quotes, interactive charts, trades, portfolio, live options flow and more tools.


 News
News  Market Data
  Discover