


| Followers | 689 |
| Posts | 143817 |
| Boards Moderated | 35 |
| Alias Born | 03/10/2004 |
Wednesday, June 21, 2017 9:08:40 AM
By Almanac Trader | June 20, 2017
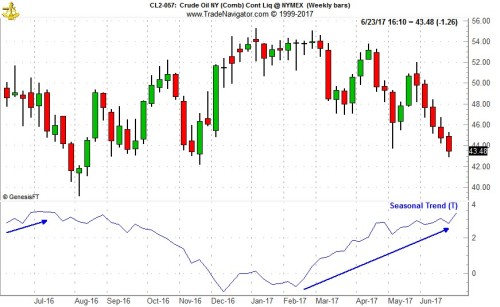
Typically at this time of the year crude oil would still be enjoying a rally off of its February lows as the North American summer driving season lifts demand and pulls prices higher until sometime in early July (lower pane of above chart highlighted by blue arrows). This has not been the situation this year. Crude oil rallied off a November low to an early January peak just above $55 per barrel. It hung out around that level through early-March before entering its current downtrend. Crude’s losses really accelerated at the start of this month and it traded under $43 per barrel earlier today. Using the standard 20% decline from peak as the rule, crude oil is now in a bear market.
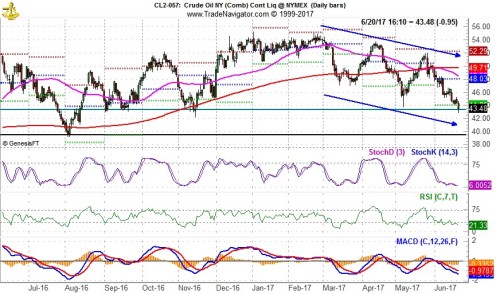
In the above chart, crude oil’s continuously-linked, non-adjusted, front month futures contract daily price is plotted. It is an ugly chart at this moment, with a series of lower lows and lower highs. It has plunged through projected monthly support (horizontal green dashed line), its 50-day moving average (solid magenta line) has plunged below its 200-day moving average (solid red line) tracing out a bearish death cross and Stochastic, relative strength and MACD indicators are all negative. Crude has not yet broken below its November closing low (solid green line) but could do so any day. The next level of support would be last August’s closing lows right around $39.50 (solid black line).
Crude oil supply is more than ample while demand, at least here in the U.S. appears to be flat at best to lower at worst. There are more alternative energy sources available today than any other time in the past and economies are becoming more efficient with crude’s use, but persistent price weakness could be a warning sign that the global economy is not as strong as it appears. The Atlanta Fed’s GDPNow model is also showing signs of growth cooling as it now predicts Q2 GDP at 2.9%, down from 3.2% on June 14 and 4.0% on June 1. Slipping Q2 growth expectations could lead to a similar effect on Q2 corporate earnings expectations which in turn could lead to a choppy market in Q3.
http://jeffhirsch.tumblr.com/post/162058214948/tumbling-crude-a-possible-early-warning-sign
• DiscoverGold
*** For Market Direction and Trends visit our board:
https://investorshub.advfn.com/Market-Direction-and-Trends-26249/
Information posted to this board is not meant to suggest any specific action, but to point out the technical signs that can help our readers make their own specific decisions. Your Due Dilegence is a must!
• DiscoverGold
FEATURED Element79 Gold Corp. Appoints Kevin Arias as Advisor to the Board of Directors, Strengthening Strategic Leadership • Sep 18, 2024 10:29 AM
Mawson Finland Limited Further Expands the Known Mineralized Zones at Rajapalot: Palokas step-out drills 7 metres @ 9.1 g/t gold & 706 ppm cobalt • MFL • Sep 17, 2024 9:02 AM
PickleJar Announces Integration With OptCulture to Deliver Holistic Fan Experiences at Venue Point of Sale • PKLE • Sep 17, 2024 8:00 AM
North Bay Resources Announces Mt. Vernon Gold Mine Bulk Sample, Sierra County, California • NBRI • Sep 11, 2024 9:15 AM
One World Products Issues Shareholder Update Letter • OWPC • Sep 11, 2024 7:27 AM
Kona Gold Beverage Inc. Reports $1.225 Million in Revenue and $133,000 Net Profit for the Quarter • KGKG • Sep 10, 2024 1:30 PM

